


 |
市场调查报告书
商品编码
1891243
免疫检查点抑制剂市场-产业趋势及全球预测(至2030年)-依关键免疫检查点标靶、标靶适应症、作用机转、治疗方式、治疗方法及主要地区划分Immune Checkpoint Inhibitors Market: Industry Trends and Global Forecasts, till 2030 - Distribution by Key Immune Checkpoint Targets, Target Indications, Mechanism of Action, Therapeutic Modalities Used, Therapy and Key Geographical Regions |
||||||
免疫检查点抑制剂市场概况
预计2025年,免疫检查点抑制剂市场规模将达620亿美元,到2035年将成长至2,460亿美元,预测期内复合年增长率(CAGR)为14.7%。
市场规模和机会分析基于以下参数进行细分:
免疫检查点抑制剂市场
市场规模和机会分析基于以下参数进行细分:
免疫检查点蛋白类型
- PD-1
- PD-L1
- CTLA-4
- 其他
标靶适应症
- 肺癌
- 乳癌
- 膀胱癌
- 子宫颈癌
- 大肠直肠癌
- 黑色素瘤
- 霍奇金淋巴瘤
- 其他
治疗类型
- 抗体片段
- 单株抗体
- 小分子分子
- 其他疗法
给药途径
- 静脉注射
- 皮下注射
- 细胞内注射
- 其他
地理区域
- 北美
- 欧洲
- 亚太地区
- 中东和非洲
- 拉丁美洲
免疫检查点抑制剂市场 - 成长与趋势
癌症是全球主要的死亡原因之一,光是2019年美国就有60万人死于癌症。世界卫生组织(WHO)预测,未来20年全球新增癌症病例将增加70%。化疗、手术和放射疗法等传统疗法仍然是公认的标准治疗方案。然而,它们的疗效非常有限,尤其是在治疗晚期癌症方面。此外,化疗和放疗的非特异性和高毒性已被证实会显着影响患者的生活品质。
目前,市面上已有多种标靶癌症治疗药物,还有更多药物正在研发中。其中,免疫检查点疗法展现出巨大的潜力,它是一种有效且强效的治疗选择,能够抑制肿瘤细胞逃避免疫监视。 2011年,百时美施贵宝公司的抗CTLA-4单株抗体Yervoy®(伊匹木单抗)成为首个获得FDA核准用于治疗转移性黑色素瘤的免疫检查点抑制剂。包括伊匹木单抗在内的早期免疫检查点抑制剂,针对PD-1/PD-L1和CTLA-4,已显示出显着延长晚期癌症患者存活期的潜力。儘管PD-1/PD-L1免疫检查点抑制剂疗效显着,但在部分患者群体中仍观察到明显的抗药性,这阻碍了这个相对较新的治疗类别的疗效。
多年来,免疫检查点调节的研究取得了显着进展,发现了多种抑制性受体(LAG-3、TIM-3、TIGIT、VISTA、B7-H3)和刺激性受体(OX40、ICOS、GITR、4-1BB、CD40),这些受体目前正被用于开发下一代免疫检查点靶向疗法。此外,涉及免疫检查点阻断和共刺激的联合疗法的临床研究,包括新发现的检查点和已知的免疫检查点抑制剂,已证实其具有增强疗效的潜力。重要的是,这些分子也展现出调节免疫耐受性以及预防或治疗自体免疫疾病的能力。因此,在令人鼓舞的临床结果和后期疗法范围不断扩大的支持下,免疫检查点抑制剂和刺激剂市场预计将在预测期内实现显着增长。
免疫检查点抑制剂市场 - 主要发现
本报告深入分析了全球免疫检查点抑制剂市场的现状,并指出了该行业潜在的成长机会。报告的主要发现包括:
- 临床研究的成功很大程度上取决于其终点和结果指标。这些指标应清晰、可靠、易于测量、灵敏且具有临床意义。
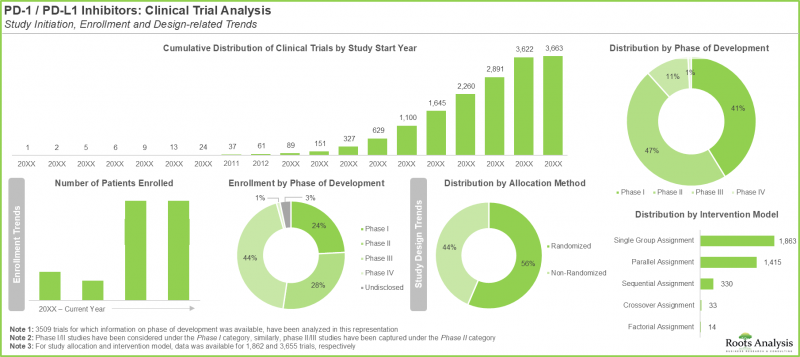
- 自2000年以来,全球已註册超过3600项旨在评估标靶PD-1/PD-L1的免疫检查点抑制剂的临床试验。
- 目前,已有超过450篇科学论文发表了已完成和正在进行的临床试验的结果。 这些出版品大多发表在影响因子介于 1 到 20 之间的同侪审查期刊上。
- 本报告详细总结了 85 篇以上临床研究论文的关键发现,这些论文介绍并讨论了已获批准和正在研发的 PD-1/PD-L1 标靶药物的结果。
- 本报告涵盖的 I 期临床试验涉及多种旨在阻断 PD-1 信号通路以治疗包括转移性癌症在内的各种肿瘤的新型分子实体。
- II 期临床试验主要关注疗法的安全性和有效性。这些试验通常针对特定适应症进行,并可能探索药物或疗法的合併应用。
- III期临床研究试验是复杂的多中心研究,患者来自世界各地,并根据既定的选择标准进行筛选。了解副作用特征是主要目标之一。
- 研究设计至关重要,它不仅优化和简化流程,还有助于确定指导研究的关键目标(例如,优效性、非劣效性、等效性)。
- 现代临床研究正在评估多种新型PD-1/PD-L1抑制剂,许多已核准的产品也正在与其他产品联合使用进行研究。
- 由于这些疗法具有标靶性,PD-L1表现被认为是设计免疫检查点抑制剂临床试验的重要标准。
- 许多临床试验旨在客观地确定一种新的治疗药物或合併疗法是否具有足够的生物活性,值得进一步研究。
- 后期临床试验的重点通常在于评估不同患者族群长期治疗相关的疗效和毒性。
- 虽然已有多种PD-1/PD-L1标靶药物上市,但仍有多种新的生物製剂候选药物正在评估中,预计在不久的将来上市。
免疫检查点抑制剂市场代表性公司
- 百时美施贵宝
- 葛兰素史克
- Incyte
- 诺华
- Trillium Therapeutics
免疫检查点抑制剂市场概览
- 市场规模及机会分析:本报告对全球免疫检查点抑制剂市场进行了详细分析,重点关注以下关键市场细分:[A] 主要免疫检查点靶点,[B] 标靶适应症,[C] 作用机制,[D] 治疗方式,[H] 治疗类型,[I] 给药途径,以及 [J] 主要地理区域。
- 市场概况:对已上市和在研分子进行全面评估,考虑以下各项参数:[A] 先导候选药物的研发阶段,[B] 靶向免疫检查点,[C] 作用机制,[D] 治疗类型,[E] 给药途径,[F] 靶向疾病适应症,[G] 靶向治疗领域,以及 [H] 治疗类型。
- 公司简介:详细介绍新一代免疫检查点调节剂的公司概况。报告主要关注:[A] 公司概述,[B] 财务资讯(如有),[C] 产品组合,以及 [E] 近期发展和未来展望。
- 资助分析:对超过 490 项授予从事下一代免疫检查点疗法相关研究机构的资助项目进行详细分析,分析参数包括:[A] 资助年份,[B] 资助金额,[C] 资助管理机构,[D] 资助机构,[E] 支持期限,[F] 资助申请类型,[G] 资助目标,[H] 资助机制,[K] 资助机构重点领域,[L] 计画负责人,[M] 受资助机构类型。
- 伙伴关係与合作:对该领域利害关係人之间达成的各种合作与伙伴关係进行全面分析。分析参数包括:[A] 合作年份,[B] 合作类型,以及 [C] 地理活动范围。
- 标靶竞争分析:对生物标靶进行详细分析,考虑以下因素:基于特定标靶的先导化合物数量、[A]候选疗法的研发阶段、[B]资助数量以及[C]发表论文数量。采用五维蜘蛛网分析法,重点在于最常见的免疫检查点标靶。
- 大型製药公司:对主要製药公司进行详细分析。基于以下参数:[A]在研疗法数量、[B]标靶疾病适应症、[C]合作活动以及[D]标靶组合。
目录
第一章:前言
第二章:摘要整理
第三章:导论
- 章节概要
- 癌症免疫疗法简介
- 癌症免疫疗法基础
- 免疫检查点调节剂
- 第一代免疫检查点调节剂
- 新一代免疫检查点调节剂
- 免疫检查点调节疗法面临的挑战
- 未来展望
第四章:目前市场概况:已上市及在研产品
- 章节概要
- 新一代免疫检查点抑制剂免疫检查点抑制剂和刺激剂:已上市和在研产品线
- 下一代免疫检查点抑制剂和刺激剂:产品线分析
- 下一代免疫检查点抑制剂和刺激剂:药物研发商列表
第五章 市场概况:CD47标靶疗法
- 章节概述
- 下一代免疫检查点抑制剂:CD47标靶疗法研发产品线
- 下一代免疫检查点抑制剂CD47标靶治疗管线分析
- 下一代免疫检查点抑制剂:CD47标靶疗法研发公司列表
第六章:市场概况:4-1BB标靶疗法
- 章节概述
- 下一代免疫检查点刺激剂:4-1BB标靶疗法研发管线
- 下一代免疫检查点刺激剂:4-1BB标靶疗法管线分析
- 下一代免疫检查点刺激剂:4-1BB标靶疗法研发公司列表
第七章:临床试验分析
- 章节概述
- 研究范围与方法
- 下一代免疫检查点抑制剂和刺激剂:临床试验分析
第八章:公司简介:新一代抑制剂和刺激剂
- 章节概述
- 百时美施贵宝
- 葛兰素史克
- Incyte
- 诺华
- Trillium Therapeutics
第九章:学术资助分析
- 章节概述
- 研究范围与方法
- 新一代免疫检查点抑制剂和刺激剂:美国国立卫生研究院 (NIH) 资助分析
第十章:合作关係
第十一章:目标竞争分析
第十二章:大药厂计画
第十三章:市场规模与机会分析
第十四章:结论
第十五章:高阶主管洞察
第十六章:附录一:表格资料
第十七章,附录二:公司与机构列表
Immune Checkpoint Inhibitors Market: Overview
As per Roots Analysis, the immune checkpoint inhibitors market is estimated to be worth USD 62 billion in 2025 and reach USD 246 billion in 2035, growing at a CAGR of 14.7% during the forecast period.
The market sizing and opportunity analysis has been segmented across the following parameters:
Immune Checkpoint Inhibitors Market
The market sizing and opportunity analysis has been segmented across the following parameters:
Type of Immune Checkpoint Proteins
- PD-1
- PD-L1
- CTLA-4
- Others
Target Disease Indication
- Lung Cancer
- Breast Cancer
- Bladder Cancer
- Cervical Cancer
- Colorectal Cancer
- Melanoma
- Hodgkin Lymphoma
- Others
Type of Therapeutic Modality
- Antibody Fragments
- Monoclonal Antibodies
- Small Molecules
- Other Modalities
Route of Administration
- Intravenous
- Subcutaneous
- Intracellular
- Others
Geographical Regions
- North America
- Europe
- Asia-Pacific
- Middle East & Africa
- Latin America
Immune Checkpoint Inhibitors Market: Growth and Trends
Cancer is recognized as a major cause of mortality globally, responsible for 0.6 million fatalities in 2019, in the US alone. The World Health Organization projects that the global incidence of new cancer cases will increase by 70% in the next 20 years. Traditional treatment methods, including chemotherapy, surgical procedures, and radiation therapy, remain the established standard of care. Nonetheless, their effectiveness is significantly constrained, particularly in the treatment of advanced-stage cancers. Further, the non-specific and extremely toxic characteristics of chemotherapy and radiation therapy are recognized to considerably affect the quality of life of individuals.
Numerous targeted cancer treatments are currently available in the market, in addition to the therapies under development. Among these, immune checkpoint therapies have demonstrated significant potential as effective and powerful treatment alternatives, capable of hindering tumor cells from escaping immune detection. In 2011, Yervoy(R) (ipilimumab), an anti-CTLA-4 monoclonal antibody from Bristol-Myers Squibb, was the first immune checkpoint inhibitor approved by the FDA for treating metastatic melanoma. Yervoy(R), together with other early immune checkpoint inhibitors (focusing on PD-1/PD-L1 and CTLA-4), demonstrated potential to significantly extend the lives of individuals with advanced tumors. Nonetheless, despite the effectiveness of PD 1 / PD-L1 immune checkpoint inhibitors, a significant level of resistance to treatment was observed in some patient groups, which hindered the therapeutic effectiveness of this relatively new category of treatments.
Throughout the years, considerable advancements have happened in immune checkpoint modulation research, uncovering various inhibitory (LAG-3, TIM-3, TIGIT, VISTA, and B7-H3) and stimulatory receptors (OX40, ICOS, GITR, 4-1BB, and CD40) that are currently being utilized for the creation of next-generation immune checkpoint-focused therapies. Additionally, clinical research on combinatorial immune checkpoint blockade and co-stimulation, which includes both newly discovered checkpoints and established immune checkpoint inhibitor therapies, has shown the ability to enhance therapeutic advantages. It is important to note that these molecules have also demonstrated the ability to regulate immune tolerance and to prevent or treat autoimmune diseases. Consequently, supported by encouraging clinical outcomes and increasing applicability of therapies under late-stage investigation, the immune checkpoint inhibitors and stimulators market is expected to experience significant growth throughout the forecast period.
Immune checkpoint Inhibitors Market: Key Insights
The report delves into the current state of global immune checkpoint inhibitors market and identifies potential growth opportunities within industry. Some key findings from the report include:
- The success of any clinical research study is heavily dependent on its endpoints and outcome measures used, which should be well defined and reliable, readily measurable, sensitive, and clinically meaningful.
- Since 2000, over 3,600 clinical trials focused on the evaluation of PD-1 / PD-L1 targeting immune checkpoint inhibitors have been registered across the world.
- Presently, there are over 450 scientific articles showcasing the results of completed and ongoing clinical studies; most of these publications are featured in peer-reviewed journals having impact factors ranging from 1 to 20.
- The report features detailed summaries of the key takeaways from 85+ clinical research publications, which showcase and discuss the results of both approved and under development PD-1 / PD-L1 targeting drugs.
- Phase I trials captured in the report feature a variety of new molecular entities designed for PD-1 signaling blockade for the treatment of various types of tumors, including metastatic cancers.
- Phase II trials are primarily focused on how safe a treatment is and how well it works; typically, these studies are conducted for specific indications and may involve combinations of drugs / therapies.
- Phase III of clinical research is an elaborate, multicenter study, involving patients shortlisted based on established selection criteria from across the world; understanding the side effects profile is a key objective.
- The importance of trial design is paramount; it not only serves to optimize, and economize the process, but also helps define critical objectives (such as superiority, non-inferiority, or equivalence) directing the course of research.
- In the contemporary clinical research scenario, multiple new PD-1 / PD-L1 inhibitors are being evaluated, and several of the approved products are also being investigated in combination with other product classes.
- Considering the target-specific nature of these therapies, the expression of PD-L1 is considered an important criterion while designing trials of immune checkpoint blockade-directed treatment options.
- A number of trials have been designed to objectively determine whether the new therapeutic agent, or combination regimen, has sufficient biological activity in order to warrant further research.
- The focus of late phase clinical studies is usually on assessing long term therapy related outcomes and affiliated toxicities, across different groups of patients.
- Although multiple PD-1 / PD-L1 targeting drugs are already in the market, several new biological drug candidates are under evaluation and are likely to enter the market in the foreseen future.
Example Players in the Immune Checkpoint Inhibitors Market
- Bristol-Myers Squibb
- GlaxoSmithKline
- Incyte
- Novartis
- Trillium Therapeutics
Immune Checkpoint Inhibitors Market: Research Coverage
- Market Sizing and Opportunity Analysis: The report features an in-depth analysis of the global immune checkpoint inhibitors market, focusing on key market segments, including [A] key immune checkpoint targets, [B] target indication, [C] mechanism of action, [D] therapeutic modalities used, [H] type of therapy, [I] route of administration, and [J] key geographical regions
- Market Landscape: A comprehensive evaluation of marketed / pipeline molecules, considering various parameters, such as [A] phase of development of lead candidates, [B] target immune checkpoints, [C] mechanism of action, [D] type of therapeutic modality used, [E] route of administration and [F] target disease indication, [G] target therapeutic area and [H] type of therapy.
- Company Profiles: In-depth profiles of next generation immune checkpoint modulators, focusing on [A] company overview, [B] financial information (if available), [C] product portfolio, and [E] recent developments and an informed future outlook.
- Grants Analysis: An in-depth analysis of more than 490 grants that have been awarded to research institutes engaged in next generation immune checkpoint therapy-related projects, based on parameters, such as [A] year of grant award, [B] amount awarded, [C] administration institute center, [D] funding institute center, [E] support period, [F] type of grant application, [G] purpose of grant award, [H] grant mechanism, [I] popular target immune checkpoints, [J] responsible study section, [K] focus area, [L] prominent program officers, and [M] type of recipient organizations.
- Partnerships and Collaborations: A comprehensive analysis of various collaborations and partnerships that have been inked amongst stakeholders in this domain, based on [A] year of partnership, [B] type of partnership and [C] regional activity.
- Target Competitiveness Analysis: A detailed analysis of the biological targets, taking into consideration the number of lead molecules based on a particular target, [A] phase of development of candidate therapies, [B] number of grants and [C] number of publications, a five-dimensional spider-web analysis, highlighting the most popular immune checkpoint targets.
- Big Pharma Players: A detailed analysis of the big pharma players, based on parameters, such as [A] number of therapies under development, [B] target disease indications, [C] partnership activity, and [D] target portfolio.
Key Questions Answered in this Report
- How many companies are currently engaged in this market?
- Which are the leading companies in this market?
- What factors are likely to influence the evolution of this market?
- What is the current and future market size?
- What is the CAGR of this market?
- How is the current and future market opportunity likely to be distributed across key market segments?
Reasons to Buy this Report
- The report provides a comprehensive market analysis, offering detailed revenue projections of the overall market and its specific sub-segments. This information is valuable to both established market leaders and emerging entrants.
- Stakeholders can leverage the report to gain a deeper understanding of the competitive dynamics within the market. By analyzing the competitive landscape, businesses can make informed decisions to optimize their market positioning and develop effective go-to-market strategies.
- The report offers stakeholders a comprehensive overview of the market, including key drivers, barriers, opportunities, and challenges. This information empowers stakeholders to stay abreast of market trends and make data-driven decisions to capitalize on growth prospects.
Additional Benefits
- Complimentary PPT Insights Packs
- Complimentary Excel Data Packs for all Analytical Modules in the Report
- 15% Free Content Customization
- Detailed Report Walkthrough Session with Research Team
- Free Updated report if the report is 6-12 months old or older
TABLE OF CONTENTS
1. PREFACE
- 1.1. Scope of the Report
- 1.2. Research Methodology
- 1.3. Chapter Outlines
2. EXECUTIVE SUMMARY
3. INTRODUCTION
- 3.1. Chapter Overview
- 3.2. Introduction to Cancer Immunotherapy
- 3.3. Fundamentals of Cancer Immunotherapy
- 3.4. Immune Checkpoint Modulators
- 3.5. First Generation Immune Checkpoint Modulators
- 3.6. Next Generation Immune Checkpoint Modulators
- 3.6.1. Types of Next Generation Immune Checkpoint Modulators
- 3.7. Challenges-related to Immune Checkpoint Modulation-based Therapy
- 3.8. Future Perspectives
4. CURRENT MARKET LANDSCAPE: MARKETED AND DEVELOPMENT PIPELINE
- 4.1. Chapter Overview
- 4.2. Next Generation Immune Checkpoint Inhibitors and Stimulators: Marketed and Development Pipeline
- 4.3. Next Generation Immune Checkpoint Inhibitors and Stimulators: Pipeline Analysis
- 4.3.1. Analysis by Phase of Development
- 4.3.2. Analysis by Target Immune Checkpoint
- 4.3.3. Analysis by Mechanism of Action
- 4.3.4. Analysis by Therapeutic Modality
- 4.3.5. Analysis by Route of Administration
- 4.3.6. Analysis by Target Disease Indication
- 4.3.7. Analysis by Therapeutic Area
- 4.3.8. Analysis by Popular Oncological Indication(s) and Popular Target Immune Checkpoint
- 4.3.9. Analysis by Popular Non-Oncological Indication(s) and Popular Target Immune Checkpoint
- 4.3.10. Analysis by Popular Disease Indication(s) and Popular Target Immune Checkpoint in Highest Phase of Development
- 4.4. Next Generation Immune Checkpoint Inhibitors and Stimulators: List of Drug Developers
- 4.4.1. Analysis by Year of Establishment
- 4.4.2. Analysis by Company Size and Geographical Location
- 4.4.3. Leading Developer Companies: Analysis by Number of Pipeline Therapies
- 4.4.4. Popular Targets: Distribution by Number of Developers
- 4.4.5 World Map Representation: Analysis by Geography
5. MARKET LANDSCAPE: THERAPIES TARGETING CD47
- 5.1. Chapter Overview
- 5.2. Next Generation Immune Checkpoint Inhibitors: Development Pipeline of CD47 Targeting Therapies
- 5.3. Next Generation Immune Checkpoint Inhibitors: Pipeline Analysis of CD47 Targeting Therapies
- 5.3.1. Analysis by Phase of Development
- 5.3.2. Analysis by Therapeutic Modality
- 5.3.3. Analysis by Route of Administration
- 5.3.4. Analysis by Target Disease Indication
- 5.4. Next Generation Immune Checkpoint Inhibitors: List of Companies Developing CD47 Targeting Therapies
- 5.4.1. Analysis by Year of Establishment
- 5.4.2. Analysis by Company Size and Geographical Location
- 5.4.3. Leading Developers: Analysis by Number of Therapies
- 5.4.4. World Map Representation: Analysis by Geography
6. MARKET LANDSCAPE: THERAPIES TARGETING 4-1BB
- 6.1. Chapter Overview
- 6.2. Next Generation Immune Checkpoint Stimulators: Development Pipeline of 4-1BB Targeting Therapies
- 6.3. Next Generation Immune Checkpoint Stimulators: Pipeline Analysis of 4-1BB Targeting Therapies
- 6.3.1. Analysis by Phase of Development
- 6.3.2. Analysis by Therapeutic Modality
- 6.3.3. Analysis by Route of Administration
- 6.3.4. Analysis by Target Disease Indication
- 6.4. Next Generation Immune Checkpoint Stimulators: List of Companies Developing 4-1BB Targeting Therapies
- 6.4.1. Analysis by Year of Establishment
- 6.4.2. Analysis by Company Size and Geographical Location
- 6.4.3. Leading Developers: Analysis by Number of Therapies
- 6.4.4. World Map Representation: Analysis by Geography
7. CLINICAL TRIAL ANALYSIS
- 7.1. Chapter Overview
- 7.2. Scope and Methodology
- 7.3. Next Generation Immune Checkpoint Inhibitors and Stimulators: Clinical Trial Analysis
- 7.3.1. Analysis by Trial Registration Year
- 7.3.2. Analysis by Trial Phase
- 7.3.3. Analysis by Trial Recruitment Status
- 7.3.4. Analysis by Trial Registration Year and Number of Patients Enrolled
- 7.3.5. Analysis by Study Design
- 7.3.6. Analysis by Sponsor / Collaborator
- 7.3.7. Leading Players: Analysis by Number of Registered Trials
- 7.3.8. Word Cloud: Key Focus Areas
- 7.3.9. Analysis by Target Immune Checkpoint
- 7.3.10. Analysis by Target Therapeutic Area
- 7.3.11. Popular Indications: Analysis by Number of Registered Trials
- 7.3.12. Popular Interventions: Analysis by Number of Registered Trials
- 7.3.13. Geographical Analysis by Number of Registered Trials
- 7.3.14. Geographical Analysis by Number of Patients Enrolled
8. COMPANY PROFILES: NEXT GENERATION INHIBITORS AND STIMULATORS
- 8.1. Chapter Overview
- 8.2. Bristol-Myers Squibb
- 8.2.1. Company Overview
- 8.2.2. Financial Information
- 8.2.3. Next Generation Immune Checkpoint Therapeutics Portfolio
- 8.2.4. Recent Developments and Future Outlook
- 8.3. GlaxoSmithKline
- 8.3.1. Company Overview
- 8.3.2. Financial Information
- 8.3.3. Next Generation Immune Checkpoint Therapeutics Portfolio
- 8.3.4. Recent Developments and Future Outlook
- 8.4. Incyte
- 8.4.1. Company Overview
- 8.4.2. Financial Information
- 8.4.3. Next Generation Immune Checkpoint Therapeutics Portfolio
- 8.4.4. Recent Developments and Future Outlook
- 8.4. Novartis
- 8.4.1. Company Overview
- 8.4.2. Financial Information
- 8.4.3. Next Generation Immune Checkpoint Therapeutics Portfolio
- 8.4.4. Recent Developments and Future Outlook
- 8.5. Trillium Therapeutics
- 8.5.1. Company Overview
- 8.5.2. Financial Information
- 8.5.3. Next Generation Immune Checkpoint Therapeutics Portfolio
- 8.5.4. Recent Developments and Future Outlook
9. ACADEMIC GRANTS ANALYSIS
- 9.1. Chapter Overview
- 9.2. Scope and Methodology
- 9.3. Next Generation Immune Checkpoint Inhibitors and Stimulators: Analysis of Grants Awarded by the National Institutes of Health (NIH)
- 9.3.1. Analysis by Year of Grant Award
- 9.3.2. Analysis by Amount Awarded
- 9.3.3. Analysis by Administering Institute Center
- 9.3.4. Analysis by Funding Institute Center
- 9.3.5. Analysis by Support Period
- 9.3.6. Analysis by Funding Institute Center and Support Period
- 9.3.7. Analysis by Type of Grant Application
- 9.3.8. Analysis by Purpose of Grant Award
- 9.3.9. Analysis by Grant Mechanism
- 9.3.10. Word Cloud: Emerging Focus Areas
- 9.3.11. Popular Target Immune Checkpoints: Analysis by Number of Grants
- 9.3.12. Analysis of Grant Amount Awarded by Target Immune Checkpoints
- 9.3.13. Analysis by Study Section Involved
- 9.3.14. Popular NIH Departments: Analysis by Number of Grants
- 9.3.15. Analysis by Types of Recipient Organizations
- 9.3.16. Popular Recipient Organizations: Analysis by Number of Grants
- 9.3.17. Prominent Program Officers: Analysis by Number of Grants
- 9.3.18. Regional Analysis of Recipient Organizations
10. PARTNERSHIPS AND COLLABORATIONS
- 10.1. Chapter Overview
- 10.2. Partnership Models
- 10.3. Next Generation Immune Checkpoint Inhibitors and Stimulators: List of Partnerships and Collaborations
- 10.3.1. Analysis by Year of Partnership
- 10.3.2. Analysis by Type of Partnership
- 10.3.3. Analysis by Number of Partnership and Target Immune Checkpoint
- 10.3.4. Analysis by Year of Partnership and Type of Partner
- 10.3.5. Analysis by Type of Partnership and Type of Partner
- 10.3.6. Most Active Players: Analysis by Number of Partnerships
- 10.4. Regional Analysis
- 10.4.1. Intercontinental and Intracontinental Agreements
11. TARGET COMPETITIVENESS ANALYSIS
- 11.1. Chapter Overview
- 11.2. Scope and Methodology
- 11.3. Key Parameters
- 11.4. Competitiveness Analysis: Key Targets for Next Generation Immune Checkpoint Inhibitors and Stimulators
- 11.3.1. Four-Dimensional Bubble Analysis
- 11.3.2 Five-Dimensional Spider Web Analysis
12. BIG PHARMA INITIATIVES
- 12.1. Chapter Overview
- 12.2. Big Pharma Initiatives Focused on Next Generation Immune Checkpoint
- 12.2.1. Analysis by Number of Initiatives
- 12.2.2. Analysis by Number of Targets
- 12.2.3. Analysis by Product Development Strategy
- 12.2.4. Analysis by Target Immune Checkpoint
- 12.2.5. Grid Representation: Analysis by Product Development Strategy and Target Immune Checkpoint
- 12.2.6. Analysis by Type of Intervention
- 12.3. Analysis by Target Disease Indication(s)
- 12.3.1. Heat Map: Big Pharma Initiatives Focused on Oncological Indications
- 12.3.2. Heat Map: Big Pharma Initiatives Focused on Non-Oncological Indications
13. MARKET SIZING AND OPPORTUNITY ANALYSIS
- 13.1. Chapter Overview
- 13.2. Forecast Methodology and Key Assumptions
- 13.3. Global Next Generation Immune Checkpoint Inhibitors and Stimulators Market, Till 2030
- 13.4. Global Next Generation Immune Checkpoint Inhibitors and Stimulators Market: Individual Product Sales Forecasts
- 13.4.1. DARZALEX(R) (Janssen Pharmaceuticals)
- 13.4.1.1. Target Patient Population
- 13.4.1.2. Sales Forecast
- 13.4.2. SAR650984 (Sanofi)
- 13.4.2.1. Target Patient Population
- 13.4.2.2. Sales Forecast
- 13.4.3. RRx-001 (EpicentRx)
- 13.4.3.1. Target Patient Population
- 13.4.3.2. Sales Forecast
- 13.4.4. GSK3359609 (GlaxoSmithKline)
- 13.4.4.1. Target Patient Population
- 13.4.4.2. Sales Forecast
- 13.4.5. Omburtamab (Y-mAbs Therapeutics)
- 13.4.5.1. Target Patient Population
- 13.4.5.2. Sales Forecast
- 13.6.7. APXOO5M (Apogenix)
- 13.6.7.1. Target Patient Population
- 13.6.7.2. Sales Forecast
- 13.7.8. BI 655064 (Boehringer Ingelheim)
- 13.7.1. Target Patient Population
- 13.4.7.2. Sales Forecast
- 13.4.8. BMS-986015 (Bristol-Myers Squibb)
- 13.4.8.1. Target Patient Population
- 13.4.8.2. Sales Forecast
- 13.4.9. CFZ533 (Novartis)
- 13.4.9.1. Target Patient Population
- 13.4.9.2. Sales Forecast
- 13.4.10. GBR 830 (Glenmark)
- 13.4.10.1. Target Patient Population
- 13.4.10.2. Sales Forecast
- 13.4.11. KHK4083 (Kyowa Kirin)
- 13.4.11.1. Target Patient Population
- 13.4.11.2. Sales Forecast
- 13.12.13. LAG525 (Novartis)
- 13.12.13.1. Target Patient Population
- 13.12.13.2. Sales Forecast
- 13.4.1. DARZALEX(R) (Janssen Pharmaceuticals)
- 13.5. Global Next Generation Immune Checkpoint Inhibitors and Stimulators Market: Distribution by Region
- 13.5.1. Next Generation Immune Checkpoint Inhibitors and Stimulators Market in US, Till 2030
- 13.5.2. Next Generation Immune Checkpoint Inhibitors and Stimulators Market in UK, Till 2030
- 13.5.3. Next Generation Immune Checkpoint Inhibitors and Stimulators Market in Germany, Till 2030
- 13.5.4. Next Generation Immune Checkpoint Inhibitors and Stimulators Market in France, Till 2030
- 13.5.5. Next Generation Immune Checkpoint Inhibitors and Stimulators Market in Italy Till 2030
- 13.5.6. Next Generation Immune Checkpoint Inhibitors and Stimulators Market in Spain, Till 2030
- 13.5.7. Next Generation Immune Checkpoint Inhibitors and Stimulators Market in Australia, Till 2030
- 13.5.8. Next Generation Immune Checkpoint Inhibitors and Stimulators Market in Japan, Till 2030
- 13.5.9. Next Generation Immune Checkpoint Inhibitors and Stimulators Market in India, Till 2030
- 13.6. Global Next Generation Immune Checkpoint Inhibitors and Stimulators Market: Distribution by Therapeutic Area
- 13.6.1. Global Next Generation Immune Checkpoint Inhibitors and Stimulators Market for Oncological Indications, Till 2030
- 13.6.2. Global Next Generation Immune Checkpoint Inhibitors and Stimulators Market for Non-oncological Indications, Till 2030
- 13.7. Global Next Generation Immune Checkpoint Inhibitors and Stimulators Market: Distribution by Target Disease Indication
- 13.7.1. Global Next Generation Immune Checkpoint Inhibitors and Stimulators Market for Atopic Dermatitis, Till 2030
- 13.7.2. Global Next Generation Immune Checkpoint Inhibitors and Stimulators Market for Breast Cancer, Till 2030
- 13.7.3. Global Next Generation Immune Checkpoint Inhibitors and Stimulators Market for Chronic Lymphocytic Leukemia, Till 2030
- 13.7.4. Global Next Generation Immune Checkpoint Inhibitors and Stimulators Market for Colorectal Cancer, Till 2030
- 13.7.5. Global Next Generation Immune Checkpoint Inhibitors and Stimulators Market for Head and Neck Cancer, Till 2030
- 13.7.6. Global Next Generation Immune Checkpoint Inhibitors and Stimulators Market for Lung Cancer, Till 2030
- 13.7.7. Global Next Generation Immune Checkpoint Inhibitors and Stimulators Market for Lupus Nephritis, Till 2030
- 13.7.8. Global Next Generation Immune Checkpoint Inhibitors and Stimulators Market for Melanoma, Till 2030
- 13.7.9. Global Next Generation Immune Checkpoint Inhibitors and Stimulators Market for Multiple Myeloma, Till 2030
- 13.7.10. Global Next Generation Immune Checkpoint Inhibitors and Stimulators Market for Neuroblastoma, Till 2030
- 13.7.11. Global Next Generation Immune Checkpoint Inhibitors and Stimulators Market for Primary Sjogren's Syndrome, Till 2030
- 13.7.12. Global Next Generation Immune Checkpoint Inhibitors and Stimulators Market for Ulcerative Colitis, Till 2030
- 13.7. Global Next Generation Immune Checkpoint Inhibitors and Stimulators Market: Distribution by Target Immune Checkpoint
- 13.8.1. Global Next Generation Immune Checkpoint Inhibitors and Stimulators Market for B7-H3 Targeting Therapies, Till 2030
- 13.8.2. Global Next Generation Immune Checkpoint Inhibitors and Stimulators Market for CD38 Targeting Therapies, Till 2030
- 13.8.3. Global Next Generation Immune Checkpoint Inhibitors and Stimulators Market for CD40 Targeting Therapies, Till 2030
- 13.8.4. Global Next Generation Immune Checkpoint Inhibitors and Stimulators Market for CD47 Targeting Therapies, Till 2030
- 13.8.5. Global Next Generation Immune Checkpoint Inhibitors and Stimulators Market for ICOS Targeting Therapies, Till 2030
- 13.8.6. Global Next Generation Immune Checkpoint Inhibitors and Stimulators Market for KIR Targeting Therapies, Till 2030
- 13.8.7. Global Next Generation Immune Checkpoint Inhibitors and Stimulators Market for LAG-3 Targeting Therapies, Till 2030
- 13.8.8. Global Next Generation Immune Checkpoint Inhibitors and Stimulators Market for OX40 Targeting Therapies, Till 2030
- 13.9. Global Next Generation Immune Checkpoint Inhibitors and Stimulators Market: Distribution by Mechanism of Action
- 13.9.1. Global Next Generation Immune Checkpoint Inhibitors and Stimulators Market for Inhibitory Therapies, Till 2030
- 13.9.2. Global Next Generation Immune Checkpoint Inhibitors and Stimulators Market for Stimulatory Therapies, Till 2030
- 13.10. Global Next Generation Immune Checkpoint Inhibitors and Stimulators Market: Distribution by Type of Therapeutic Modality
- 13.10.1. Global Next Generation Immune Checkpoint Inhibitors and Stimulators Market for Monoclonal Antibody, Till 2030
- 13.10.2. Global Next Generation Immune Checkpoint Inhibitors and Stimulators Market for Small Molecules, Till 2030
- 13.11. Global Next Generation Immune Checkpoint Inhibitors and Stimulators Market: Distribution by Type of Therapy
- 13.11.1. Global Next Generation Immune Checkpoint Inhibitors and Stimulators Market for Monotherapy, Till 2030
- 13.11.2. Global Next Generation Immune Checkpoint Inhibitors and Stimulators Market for Combination Therapy, Till 2030
- 13.11.3. Global Next Generation Immune Checkpoint Inhibitors and Stimulators Market for Both, Till 2030
- 13.12. Global Next Generation Immune Checkpoint Inhibitors and Stimulators Market: Distribution by Route of Administration
- 13.12.1. Global Next Generation Immune Checkpoint Inhibitors and Stimulators Market for Intracerebroventricular Therapies, Till 2030
- 13.12.2. Global Next Generation Immune Checkpoint Inhibitors and Stimulators Market for Intravenous Therapies, Till 2030
- 13.12.3. Global Next Generation Immune Checkpoint Inhibitors and Stimulators Market for Subcutaneous Therapies, Till 2030
14. CONCLUDING REMARKS
- 14.1. Chapter Overview
- 14.2. Key Takeaways
15. EXECUTIVE INSIGHTS
16. APPENDIX 1: TABULATED DATA
17. APPENDIX 2: LIST OF COMPANIES AND ORGANIZATIONS
List of Tables
- Table 3.1 Types of Immunotherapies and Associated Mechanisms of Action
- Table 3.2 First Generation Immune Checkpoint Therapies
- Table 4.1 Next Generation Immune Checkpoint Inhibitors and Stimulators: List of Target Immune Checkpoints
- Table 4.2 Next Generation Immune Checkpoint Inhibitors and Stimulators: Marketed and Development Pipeline
- Table 4.3 Next Generation Immune Checkpoint Inhibitors and Stimulators: List of Drug Developers
- Table 5.1 Immune Checkpoint Inhibitors for CD47: Development Pipeline
- Table 5.2 Immune Checkpoint Inhibitors for CD47: List of Therapy Developers
- Table 6.1 Immune Checkpoint Stimulators for 4-1BB: Development Pipeline
- Table 6.2 Immune Checkpoint Stimulators for 4-1BB: List of Therapy Developers
- Table 8.1 Next Generation Immune Checkpoint Inhibitors and Stimulators: List of Companies Profiled
- Table 8.2 Bristol- Myers Squibb: Company Snapshot
- Table 8.3 Drug Profile: BMS-986213
- Table 8.4 Drug Profile: BMS-986016
- Table 8.5 Drug Profile: BMS-986258
- Table 8.6 Drug Profile: BMS-986207
- Table 8.7 Drug Profile: BMS-986179
- Table 8.8 Drug Profile: BMS-663513
- Table 8.9 Drug Profile: BMS-986178
- Table 8.10 Drug Profile: BMS-936561
- Table 8.11 Bristol-Myers Squibb: Future Outlook
- Table 8.12 GlaxoSmithKline: Company Snapshot
- Table 8.13 Drug Profile: GSK3359609
- Table 8.14 Drug Profile: GSK2831781
- Table 8.15 Drug Profile: GSK3174998
- Table 8.16 Drug Profile: TSR-022
- Table 8.17 Drug Profile: TSR-033
- Table 8.18 Drug Profile: TSR-075
- Table 8.19 GlaxoSmithKline: Future Outlook
- Table 8.20 Incyte: Company Snapshot
- Table 8.21 Drug Profile: INCB024360
- Table 8.22 Drug Profile: INCB001158
- Table 8.23 Drug Profile: INCAGN01876
- Table 8.24 Drug Profile: INCAGN1876
- Table 8.25 Drug Profile: INCAGN1949
- Table 8.26 Drug Profile: MCLA-145
- Table 8.27 Drug Profile: INCAGN2385
- Table 8.28 Drug Profile: INCAGN2390
- Table 8.29 Incyte: Future Outlook
- Table 8.30 Novartis: Company Snapshot
- Table 8.31 Drug Profile: CFZ533
- Table 8.32 Drug Profile: MBG453
- Table 8.33 Drug Profile: LAG525
- Table 8.34 Drug Profile: GWN323
- Table 8.35 Drug Profile: NZV930
- Table 8.36 Novartis: Future Outlook
- Table 8.37 Trillium Therapeutics: Company Snapshot
- Table 8.38 Drug Profile: TTI-622-01
- Table 8.39 Drug Profile: TTI-622-01
- Table 8.40 Drug Profile: TTI-622
- Table 8.41 Drug Profile: CD200 Monoclonal Antibodies
- Table 8.42 Trillium Therapeutics: Future Outlook
- Table 10.1 Next Generation Immune Checkpoint Inhibitors and Stimulators: List of Partnerships and Collaborations
- Table 13.1 Next Generation Immune Checkpoint Inhibitors and Stimulators: List of Forecasted Drug Candidates
- Table 13.2 Darzalex: Target Patient Population (USD Million)
- Table 13.3 SAR650984: Target Patient Population (USD Million)
- Table 13.4 RRx-001: Target Patient Population (USD Million)
- Table 13.5 GSK3359609: Target Patient Population (USD Million)
- Table 13.6 Enoblituzumab: Target Patient Population (USD Million)
- Table 13.7 Omburtamab: Target Patient Population (USD Million)
- Table 13.8 APX005M: Target Patient Population (USD Million)
- Table 13.9 BI 655064: Target Patient Population (USD Million)
- Table 13.10 BMS-986015: Target Patient Population (USD Million)
- Table 13.11 CFZ533: Target Patient Population (USD Million)
- Table 13.12 GBR 830: Target Patient Population (USD Million)
- Table 13.13 KHK4083: Target Patient Population (USD Million)
- Table 13.13 LAG525: Target Patient Population (USD Million)
- Table 14.1 Next Generation Immune Checkpoint Inhibitors and Stimulators: Summary of the Competitive Insights
- Table 15.1 IGM Biosciences: Key Highlights
- Table 16.1 Next Generation Immune Checkpoint Inhibitors and Stimulators: Distribution by Phase of Development
- Table 16.2 Next Generation Immune Checkpoint Inhibitors and Stimulators: Distribution by Target Immune Checkpoint
- Table 16.3 Next Generation Target Immune Checkpoint Inhibitors and Stimulators: Distribution by Highest Phase of Development
- Table 16.4 Next Generation Immune Checkpoint Inhibitors and Stimulators: Distribution by Mechanism of Action
- Table 16.5 Next Generation Immune Checkpoint Inhibitors and Stimulators: Distribution by Therapeutic Modality
- Table 16.6 Next Generation Immune Checkpoint Inhibitors and Stimulators: Distribution by Route of Administration
- Table 16.7 Next Generation Immune Checkpoint Inhibitors and Stimulators: Distribution by Oncological Indications
- Table 16.8 Next Generation Immune Checkpoint Inhibitors and Stimulators: Distribution by Non-Oncological Indications
- Table 16.9 Next Generation Immune Checkpoint Inhibitors and Stimulators: Distribution by Therapeutic Area
- Table 16.10 Next Generation Immune Checkpoint Inhibitors and Stimulators Therapy Developers: Distribution by Year of Establishment
- Table 16.11 Next Generation Immune Checkpoint Inhibitors and Stimulators Therapy Developers: Distribution by Company Size and Location of Headquarters
- Table 16.12 Leading Developer Companies: Distribution by Number of Pipeline Therapies
- Table 16.13 Leading Targets: Distribution by Number of Developers
- Table 16.14 Word Map Representation: Distribution by Geography
- Table 16.15 Immune Checkpoint Stimulators for CD47: Distribution by Phase of Development
- Table 16.16 Immune Checkpoint Inhibitors for CD47: Distribution by Therapeutic Modality
- Table 16.17 Immune Checkpoint Inhibitors for CD47: Distribution by Target Disease Indication
- Table 16.18 Immune Checkpoint Inhibitors for CD47: Distribution by Route of Administration
- Table 16.19 Immune Checkpoint Inhibitors for CD47 Therapy Developers: Distribution by Year of Establishment
- Table 16.20 Immune Checkpoint Inhibitors for CD47 Therapy Developers: Distribution by Company Size
- Table 16.21 Immune Checkpoint Inhibitors for CD47 Therapy Developers: Distribution by Location
- Table 16.22 Immune Checkpoint Inhibitors for CD47 Therapy Developers: Distribution by Location
- Table 16.23 Leading Developers: Distribution by Number of Pipeline Therapies for CD47
- Table 16.24 Immune Checkpoint Stimulators for 4-1BB: Distribution by Phase of Development
- Table 16.25 Immune Checkpoint Stimulators for 4-1BB: Distribution by Therapeutic Modality
- Table 16.26 Immune Checkpoint Stimulators for 4-1BB: Distribution by Target Disease Indication
- Table 16.27 Immune Checkpoint Stimulators for 4-1BB: Distribution by Route of Administration
- Table 16.28 Immune Checkpoint Stimulators for 4-1BB Therapy Developers: Distribution by Year of Establishment
- Table 16.29 Immune Checkpoint Stimulators for 4-1BB Therapy Developers: Distribution by Location
- Table 16.30 Leading Developers: Distribution by Number of Pipeline Therapies for 4-1BB
- Table 16.31 Clinical Trial Analysis: Distribution by Trial Status
- Table 16.32 Clinical Trial Analysis: Cumulative Distribution of Trials by Registration Year, Since 2010
- Table 16.33 Clinical Trial Analysis: Distribution by Trial Phase and Number of Patient's Enrolled
- Table 16.34 Clinical Trial Analysis: Distribution by Trial Recruitment Status
- Table 16.35 Clinical Trial Analysis: Distribution by Trial Registration Year and Number of Patients Enrolled
- Table 16.36 Clinical Trial Analysis: Distribution by Study Design
- Table 16.37 Clinical Trial Analysis: Distribution by Type of Sponsor / Collaborator
- Table 16.38 Leading Players: Distribution by Number of Registered Trials
- Table 16.39 Clinical Trial Analysis: Distribution by Target Immune Checkpoint
- Table 16.40 Clinical Trial Analysis: Distribution by Therapeutic Area
- Table 16.41 Popular Indications: Distribution by Registered Trials
- Table 16.42 Clinical Trial Analysis: Phase-Wise Distribution of Most Popular Indications
- Table 16.43 Popular Interventions: Analysis by Number of Registered Trials
- Table 16.44 Clinical Trial Analysis: Geographical Distribution by Trial Recruitment Status
- Table 16.45 Clinical Trial Analysis: Geographical Distribution by Number of Patients Enrolled
- Table 16.46 Bristol-Myers Squibb: Annual Revenues, Since 2015 (USD Billion)
- Table 16.47 GlaxoSmithKline: Annual Revenues, Since 2015 (USD Billion)
- Table 16.48 Incyte: Annual Revenues, Since 2015 (USD Billion)
- Table 16.49 Novartis: Annual Revenues, Since 2015 (USD Billion)
- Table 16.50 Grant Analysis: Distribution by Year of Grant Award, Since 2016
- Table 16.51 Grant Analysis: Distribution by Amount Awarded (USD Million), Since 2016
- Table 16.52 Grant Analysis: Distribution by Administering Institute Center
- Table 16.53 Grant Analysis: Distribution by Funding Institute Center
- Table 16.54 Grant Analysis: Distribution by Support Period
- Table 16.55 Grant Analysis: Distribution by Type of Grant Application
- Table 16.56 Grant Analysis: Distribution by Purpose of Grant Award
- Table 16.57 Grant Analysis: Distribution by Grant Mechanism Popular Target Immune Checkpoints: Distribution by Number of Grants
- Table 16.58 Grant Analysis: Distribution of Grant Amount Awarded by Target Immune Checkpoints
- Table 16.59 Grant Analysis: Distribution by Study Section Involved
- Table 16.60 Grant Analysis: Distribution by Types of Recipient Organizations
- Table 16.61 Popular NIH Departments: Distribution by Number of Grants
- Table 16.62 Prominent Program Officers: Distribution by Number of Grants
- Table 16.63 Grant Analysis: Distribution by Recipient Organizations
- Table 16.64 Partnerships and Collaborations: Cumulative Year-wise Trend, Since 2017
- Table 16.65 Partnerships and Collaborations: Distribution by Type of Partnership
- Table 16.66 Partnerships and Collaborations: Year-wise Trend by Type of Partnership, Since2017
- Table 16.67 Partnerships and Collaborations: Distribution by Target Immune Checkpoint
- Table 16.68 Partnerships and Collaborations: Distribution by Year and Type of Partner
- Table 16.69 Partnerships and Collaborations: Analysis by Type of Partnership and Type of Partner
- Table 16.70 Most Active Players: Distribution by Number of Partnerships
- Table 16.71 Partnership and Collaborations: Regional Distribution
- Table 16.72 Partnerships and Collaborations: Intercontinental and Intracontinental Distribution
- Table 16.73 Big Pharma Players: Distribution by Number of Initiatives
- Table 16.74 Big Pharma Plyers: Analysis by Number of Unique Targets
- Table 16.75 Big Pharma Plyers: Analysis by Product Development Strategy
- Table 16.76 Big Pharma Players: Analysis by Product Development Strategy across Target Immune Checkpoint
- Table 16.77 Big Pharma Players: Analysis by Type of Intervention
- Table 16.78 Global Next Generation Immune Checkpoint Inhibitors and Stimulators Market, Till 2030: Conservative, Base and Optimistic Scenarios (USD Million)
- Table 16.79 DARZALEX: Sales Forecast, Till 2030: Conservative, Base and Optimistic Scenarios (USD Million)
- Table 16.80 SAR650984: Sales Forecast, Till 2030: Conservative, Base and Optimistic Scenarios (USD Million)
- Table 16.81 RRx-001: Sales Forecast, Till 2030: Conservative, Base and Optimistic Scenarios (USD Million)
- Table 16.82 GSK3359609: Sales Forecast, Till 2030: Conservative, Base and Optimistic Scenarios (USD Million)
- Table 16.83 Enoblituzumab: Sales Forecast, Till 2030: Conservative, Base and Optimistic Scenarios (USD Million)
- Table 16.84 Omburtamb: Sales Forecast, Till 2030: Conservative, Base and Optimistic Scenarios (USD Million)
- Table 16.85 APXOO5M: Sales Forecast, Till 2030: Conservative, Base and Optimistic Scenarios (USD Million)
- Table 16.86 BI 655064: Sales Forecast, Till 2030: Conservative, Base and Optimistic Scenarios (USD Million)
- Table 16.87 BMS-986015: Sales Forecast, Till 2030: Conservative, Base and Optimistic Scenarios (USD Million)
- Table 16.88 CFZ533: Sales Forecast, Till 2030: Conservative, Base and Optimistic Scenarios (USD Million)
- Table 16.89 GBR 830: Sales Forecast, Till 2030: Conservative, Base and Optimistic Scenarios (USD Million)
- Table 16.90 KHK4083: Sales Forecast, Till 2030: Conservative, Base and Optimistic Scenarios (USD Million)
- Table 16.91 LAG525: Sales Forecast, Till 2030: Conservative, Base and Optimistic Scenarios (USD Million)
- Table 16.92 Global Next Generation Immune Checkpoint Inhibitors and Stimulators Market: Distribution by Region (USD Million)
- Table 16.93 Next Generation Immune Checkpoint Inhibitors and Stimulators Market in North America, Till 2030: Conservative, Base and Optimistic Scenarios (USD Million)
- Table 16.94 Next Generation Immune Checkpoint Inhibitors and Stimulators Market in UK, Till 2030: Conservative, Base and Optimistic Scenarios (USD Million)
- Table 16.95 Next Generation Immune Checkpoint Inhibitors and Stimulators Market in EU4, Till 2030: Conservative, Base and Optimistic Scenarios (USD Million)
- Table 16.96 Next Generation Immune Checkpoint Inhibitors and Stimulators Market in Germany, Till 2030: Conservative, Base and Optimistic Scenarios (USD Million)
- Table 16.97 Next Generation Immune Checkpoint Inhibitors and Stimulators Market in France, Till 2030: Conservative, Base and Optimistic Scenarios (USD Million)
- Table 16.98 Next Generation Immune Checkpoint Inhibitors and Stimulators Market in Italy, Till 2030: Conservative, Base and Optimistic Scenarios (USD Million)
- Table 16.99 Next Generation Immune Checkpoint Inhibitors and Stimulators Market in Spain, Till 2030: Conservative, Base and Optimistic Scenarios (USD Million)
- Table 16.100 Next Generation Immune Checkpoint Inhibitors and Stimulators Market in Australia, Till 2030: Conservative, Base and Optimistic Scenarios (USD Million)
- Table 16.101 Next Generation Immune Checkpoint Inhibitors and Stimulators Market in Japan, Till 2030: Conservative, Base and Optimistic Scenarios (USD Million)
- Table 16.102 Next Generation Immune Checkpoint Inhibitors and Stimulators Market in India, Till 2030: Conservative, Base and Optimistic Scenarios (USD Million)
- Table 16.103 Global Next Generation Immune Checkpoint Inhibitors and Stimulators Market: Distribution by Therapeutic Area (USD Million)
- Table 16.104 Global Next Generation Immune Checkpoint Inhibitors and Stimulators Market for Oncological Disorders, Till 2030 (USD Million)
- Table 16.105 Global Next Generation Immune Checkpoint Inhibitors and Stimulators Market for Non-oncological Disorders, Till 2030: Conservative, Base and Optimistic Scenarios (USD Million)
- Table 16.106 Global Next Generation Immune Checkpoint Inhibitors and Stimulators Market for Atopic Dermatitis, Till 2030: Conservative, Base and Optimistic Scenarios (USD Million)
- Table 16.107 Global Next Generation Immune Checkpoint Inhibitors and Stimulators Market for Breast Cancer, Till 2030: Conservative, Base and Optimistic Scenarios (USD Million)
- Table 16.108 Global Next Generation Immune Checkpoint Inhibitors and Stimulators Market for Chronic Lymphocytic Leukemia, Till 2030: Conservative, Base and Optimistic Scenarios (USD Million)
- Table 16.109 Global Next Generation Immune Checkpoint Inhibitors and Stimulators Market for Colorectal Cancer, Till 2030: Conservative, Base and Optimistic Scenarios (USD Million)
- Table 16.110 Global Next Generation Immune Checkpoint Inhibitors and Stimulators Market for Head and Neck Cancer, Till 2030: Conservative, Base and Optimistic Scenarios (USD Million)
- Table 16.111 Global Next Generation Immune Checkpoint Inhibitors and Stimulators Market for Lung Cancer, Till 2030: Conservative, Base and Optimistic Scenarios (USD Million)
- Table 16.112 Global Next Generation Immune Checkpoint Inhibitors and Stimulators Market for Lupus Nephritis, Till 2030: Conservative, Base and Optimistic Scenarios (USD Million)
- Table 16.113 Global Next Generation Immune Checkpoint Inhibitors and Stimulators Market for Melanoma, Till 2030: Conservative, Base and Optimistic Scenarios (USD Million)
- Table 16.114 Global Next Generation Immune Checkpoint Inhibitors and Stimulators Market for Multiple Myeloma, Till 2030: Conservative, Base and Optimistic Scenarios (USD Million)
- Table 16.115 Global Next Generation Immune Checkpoint Inhibitors and Stimulators Market for Neuroblastoma, Till 2030: Conservative, Base and Optimistic Scenarios (USD Million)
- Table 16.116 Global Next Generation Immune Checkpoint Inhibitors and Stimulators Market for Primary Sjogren's Syndrome, Till 2030: Conservative, Base and Optimistic Scenarios (USD Million)
- Table 16.117 Global Next Generation Immune Checkpoint Inhibitors and Stimulators Market for Ulcerative Colitis, Till 2030: Conservative, Base and Optimistic Scenarios (USD Million)
- Table 16.118 Global Next Generation Immune Checkpoint Inhibitors and Stimulators Market: Distribution by Target Immune Checkpoint, 2027 and 2030 (USD Million)
- Table 16.119 Global Next Generation Immune Checkpoint Inhibitors and Stimulators Market for B7-H3 Targeting Therapies, Till 2030: Conservative, Base and Optimistic Scenarios (USD Million)
- Table 16.120 Global Next Generation Immune Checkpoint Inhibitors and Stimulators Market for CD38 Targeting Therapies, Till 2030: Conservative, Base and Optimistic Scenarios (USD Million)
- Table 16.121 Global Next Generation Immune Checkpoint Inhibitors and Stimulators Market for CD40 Targeting Therapies, Till 2030: Conservative, Base and Optimistic Scenarios (USD Million)
- Table 16.122 Global Next Generation Immune Checkpoint Inhibitors and Stimulators Market for CD47 Targeting Therapies, Till 2030: Conservative, Base and Optimistic Scenarios (USD Million)
- Table 16.123 Global Next Generation Immune Checkpoint Inhibitors and Stimulators Market for ICOS Targeting Therapies, Till 2030: Conservative, Base and Optimistic Scenarios (USD Million)
- Table 16.124 Global Next Generation Immune Checkpoint Inhibitors and Stimulators Market for KIR Targeting Therapies, Till 2030: Conservative, Base and Optimistic Scenarios (USD Million)
- Table 16.125 Global Next Generation Immune Checkpoint Inhibitors and Stimulators Market for LAG-3 Targeting Therapies, Till 2030: Conservative, Base and Optimistic Scenarios (USD Million)
- Table 16.126 Global Next Generation Immune Checkpoint Inhibitors and Stimulators Market for OX40 Targeting Therapies, Till 2030: Conservative, Base and Optimistic Scenarios (USD Million)
- Table 16.127 Global Next Generation Immune Checkpoint Inhibitors and Stimulators Market: Distribution by Mechanism of Action (USD Million)
- Table 16.128 Global Next Generation Immune Checkpoint Inhibitors and Stimulators Market for Inhibitory Therapies, Till 2030: Conservative, Base and Optimistic Scenarios (USD Million)
- Table 16.129 Global Next Generation Immune Checkpoint Inhibitors and Stimulators Market for Stimulatory Therapies, Till 2030: Conservative, Base and Optimistic Scenarios (USD Million)
- Table 16.130 Global Next Generation Immune Checkpoint Inhibitors and Stimulators Market: Distribution by Type of Therapeutic Modality, 2025 and 2030 (USD Million)
- Table 16.131 Global Next Generation Immune Checkpoint Inhibitors and Stimulators Market for Monoclonal Antibody, Till 2030: Conservative, Base and Optimistic Scenarios (USD Million)
- Table 16.132 Global Next Generation Immune Checkpoint Inhibitors and Stimulators Market for Small Molecules, Till 2030: Conservative, Base and Optimistic Scenarios (USD Million)
- Table 16.133 Global Next Generation Immune Checkpoint Inhibitors and Stimulators Market: Distribution by Type of Therapy, 2027 and 2030 (USD Million)
- Table 16.134 Global Next Generation Immune Checkpoint Inhibitors and Stimulators Market for Monotherapy, Till 2030: Conservative, Base and Optimistic Scenarios (USD Million)
- Table 16.135 Global Next Generation Immune Checkpoint Inhibitors and Stimulators Market for Combination Therapy, Till 2030: Conservative, Base and Optimistic Scenarios (USD Million)
- Table 16.136 Global Next Generation Immune Checkpoint Inhibitors and Stimulators Market for Both, Till 2030: Conservative, Base and Optimistic Scenarios (USD Million)
- Table 16.137 Global Next Generation Immune Checkpoint Inhibitors and Stimulators Market: Distribution by Route of Administration, 2027 and 2020 (USD Million)
- Table 16.138 Global Next Generation Immune Checkpoint Inhibitors and Stimulators Market for Intracerebroventricular Therapies, Till 2030: Conservative, Base and Optimistic Scenarios (USD Million)
- Table 16.139 Global Next Generation Immune Checkpoint Inhibitors and Stimulators Market for Intravenous Therapies, Till 2030: Conservative, Base and Optimistic Scenarios (USD Million)
- Table 16.140 Global Next Generation Immune Checkpoint Inhibitors and Stimulators Market for Subcutaneous Therapies, Till 2030: Conservative, Base and Optimistic Scenarios (USD Million)
List of Figures
- Figure 3.1 Global Age-Standardized Incidence Rates for Cancer, 2018 (per 100,000 Individuals)
- Figure 3.1 Mechanism of Immunotherapies
- Figure 3.3 Immune Checkpoint Targets
- Figure 4.1 Next Generation Immune Checkpoint Inhibitors and Stimulators: Distribution by Phase of Development
- Figure 4.2 Next Generation Immune Checkpoint Inhibitors and Stimulators: Distribution by Target Immune Checkpoint
- Figure 4.3 Next Generation Target Immune Checkpoint Inhibitors and Stimulators: Distribution by Highest Phase of Development
- Figure 4.4 Next Generation Immune Checkpoint Inhibitors and Stimulators: Distribution by Mechanism of Action
- Figure 4.5 Next Generation Immune Checkpoint Inhibitors and Stimulators: Distribution by Therapeutic Modality
- Figure 4.6 Next Generation Immune Checkpoint Inhibitors and Stimulators: Distribution by Route of Administration
- Figure 4.7 Next Generation Immune Checkpoint Inhibitors and Stimulators: Distribution by Oncological Indications
- Figure 4.8 Next Generation Immune Checkpoint Inhibitors and Stimulators: Distribution by Non-Oncological Indications
- Figure 4.9 Next Generation Immune Checkpoint Inhibitors and Stimulators: Distribution by Therapeutic Area
- Figure 4.10 Popular Oncological Indication(s): Distribution by Target Immune Checkpoints
- Figure 4.11 Popular Non-Oncological Indication(s): Distribution by Target Immune Checkpoints
- Figure 4.12 Popular Disease Indication(s): Distribution by Target Immune Checkpoint in Highest Phase of Development
- Figure 4.13 Next Generation Immune Checkpoint Inhibitors and Stimulators Therapy Developers: Distribution by Year of Establishment
- Figure 4.14 Next Generation Immune Checkpoint Inhibitors and Stimulators Therapy Developers: Distribution by Company Size and Geographical Location
- Figure 4.15 Leading Developer Companies: Distribution by Number of Pipeline Therapies
- Figure 4.16 Popular Targets: Distribution by Number of Developers
- Figure 4.17 World Map Representation: Analysis by Geography
- Figure 5.1 Immune Checkpoint Inhibitors for CD47: Distribution by Phase of Development
- Figure 5.2 Immune Checkpoint Inhibitors for CD47: Distribution by Therapeutic Modality
- Figure 5.3 Immune Checkpoint Inhibitors for CD47: Distribution by Route of Administration
- Figure 5.4 Immune Checkpoint Inhibitors for CD47: Distribution by Target Disease Indication
- Figure 5.5 Immune Checkpoint Inhibitors for CD47 Therapy Developers: Distribution by Year of Establishment
- Figure 5.6 Immune Checkpoint Inhibitors for CD47 Therapy Developers: Distribution by Company Size and Geographical Location
- Figure 5.7 Leading Developers: Distribution by Number of Pipeline Therapies for CD47
- Figure 5.8 World Map Representation: Distribution by Geography
- Figure 6.1 Immune Checkpoint Stimulators for 4-1BB: Distribution by Phase of Development
- Figure 6.2 Immune Checkpoint Stimulators for 4-1BB: Distribution by Therapeutic Modality
- Figure 6.3 Immune Checkpoint Stimulators for 4-1BB: Distribution by Route of Administration
- Figure 6.4 Immune Checkpoint Stimulators for 4-1BB: Distribution by Target Disease Indication
- Figure 6.5 Immune Checkpoint Stimulators for 4-1BB Therapy Developers: Distribution by Year of Establishment
- Figure 6.6 Immune Checkpoint Stimulators for 4-1BB Therapy Developers: Distribution by Company Size and Geographical Location
- Figure 6.7 Leading Developers: Distribution by Number of Therapies for 4-1BB
- Figure 6.8 World Map Representation: Distribution by Geography
- Figure 7.1 Clinical Trial Analysis: Scope and Methodology
- Figure 7.2 Clinical Trial Analysis: Distribution by Trial Status
- Figure 7.3 Clinical Trial Analysis: Cumulative Distribution of Trials by Registration Year, Since 2010
- Figure 7.4 Clinical Trial Analysis: Distribution by Trial Phase
- Figure 7.5 Clinical Trial Analysis: Cumulative Year-wise Trend by Trial Recruitment Status
- Figure 7.6 Clinical Trial Analysis: Distribution by Number of Patients Enrolled by Trial Registration Year
- Figure 7.7 Clinical Trial Analysis: Distribution by Study Design
- Figure 7.8 Clinical Trial Analysis: Distribution by Type of Sponsor / Collaborator
- Figure 7.9 Leading Players: Distribution by Number of Registered Trials
- Figure 7.10 Word Cloud Analysis: Distribution by Focus Areas
- Figure 7.11 Clinical Trial Analysis: Distribution by Target Immune Checkpoint
- Figure 7.12 Clinical Trial Analysis: Distribution by Target Immune Checkpoint and Trial Registration Year
- Figure 7.13 Clinical Trial Analysis: Distribution by Therapeutic Area
- Figure 7.14 Popular Indication(s): Analysis by Number of Registered Trials
- Figure 7.15 Clinical Trial Analysis: Phase-Wise Distribution of Most Popular Indications
- Figure 7.16 Popular Interventions: Analysis by Number of Number of Registered Trials
- Figure 7.17 Clinical Trial Analysis: Geographical Distribution by Number of Registered Trials
- Figure 7.18 Clinical Trial Analysis: Geographical Distribution by Number of Patients Enrolled
- Figure 8.1 Bristol-Myers Squibb: Annual Revenues, Since 2019 (USD Billion)
- Figure 8.2 GlaxoSmithKline: Annual Revenues, Since 2019 (USD Billion)
- Figure 8.3 Incyte: Annual Revenues, Since 2019 (USD Billion)
- Figure 8.4 Novartis: Annual Revenues, Since 2019 (USD Billion)
- Figure 9.1 Grant Analysis: Distribution by Year of Grant Award, Since 2016
- Figure 9.2 Grant Analysis: Distribution by Amount Awarded (USD Million), Since 2019
- Figure 9.3 Grant Analysis: Distribution by Administering Institute Center
- Figure 9.4 Grant Analysis: Distribution by Funding Institute Center
- Figure 9.5 Grant Analysis: Distribution by Support Period
- Figure 9.6 Grant Analysis: Distribution by Funding Institute Center and Support Period
- Figure 9.7 Grant Analysis: Distribution by Type of Grant Application
- Figure 9.8 Grant Analysis: Distribution by Purpose of Grant Award
- Figure 9.9 Grant Analysis: Distribution by Grant Mechanism
- Figure 9.10 Word Cloud: Emerging Focus Areas
- Figure 9.11 Popular Target Immune Checkpoints: Distribution by Number of Grants
- Figure 9.12 Grant Analysis: Distribution of Grant Amount Awarded by Target Immune Checkpoints (USD Million)
- Figure 9.13 Grant Analysis: Distribution by Study Section Involved
- Figure 9.14 Popular NIH Departments: Distribution by Number of Grants
- Figure 9.15 Grant Analysis: Distribution by Types of Recipient Organizations
- Figure 9.16 Prominent Program Officers: Distribution by Number of Grants
- Figure 9.17 Popular Recipient Organizations: Distribution by Number of Grants
- Figure 9.18 Grant Analysis: Distribution by Recipient Organizations
- Figure 10.1. Partnerships and Collaborations: Cumulative Year-wise Trend, Since 2017
- Figure 10.2. Partnerships and Collaborations: Distribution by Type of Partnership
- Figure 10.3. Partnerships and Collaborations: Year-wise Trend by Type of Partnership Since 2017
- Figure 10.4. Partnerships and Collaborations: Distribution by Number of Partnerships and Target Immune Checkpoint
- Figure 10.5. Partnerships and Collaborations: Distribution by Year of Partnership and Type of Partner
- Figure 10.6. Partnerships and Collaborations: Distribution Type of Partnership and Type of Partner
- Figure 10.7. Partnerships and Collaborations: Most Active Players
- Figure 10.8. Partnerships and Collaborations: Regional Distribution
- Figure 10.9. Partnerships and Collaborations: Intercontinental and Intracontinental Distribution
- Figure 11.1. Target Competitiveness Analysis: Four-Dimensional Bubble Analysis
- Figure 11.2. Target Competitiveness Analysis: Five-Dimensional Spider Web Analysis
- Figure 12.1. Big Pharma Players: Logo Landscape
- Figure 12.2. Big Pharma Players: Analysis by Number of Initiatives
- Figure 12.3. Big Pharma Players: Analysis by Number of Unique Targets
- Figure 12.4. Big Pharma Players: Analysis by Product Development Strategy
- Figure 12.5. Big Pharma Players: Heat Map Analysis by Target Immune Checkpoint
- Figure 12.6. Big Pharma Players: Analysis by Product Development Strategy across Target Immune Checkpoint
- Figure 12.7. Heat Map Representation: Distribution of Big Pharma Initiatives Across Target Immune Checkpoints and Highest Stage of Development
- Figure 12.8. Grid Representation: Analysis by Product Development and Target Immune Checkpoint
- Figure 12.9. Big Pharma Players: Analysis by Type of Intervention
- Figure 12.10. Heat Map Representation: Big Pharma Initiatives Focused on Oncological Indications
- Figure 12.11. Heat Map Representation: Big Pharma Initiatives Focused on Non-Oncological Indications
- Figure 12.12. Heat Map Representation: Distribution of Big Pharma Initiatives Across Target Immune Checkpoints and Indication
- Figure 13.1 Global Next Generation Immune Checkpoint Inhibitors and Stimulators Market, Till 2030 (USD Million)
- Figure 13.2 DARZALEX(R) Sales Forecast: Till 2030 (USD Million)
- Figure 13.3 SAR650984 Sales Forecast: Till 2030 (USD Million)
- Figure 13.4 RRx-001 Sales Forecast: Till 2030 (USD Million)
- Figure 13.5 GSK3359609 Sales Forecast: Till 2030 (USD Million)
- Figure 13.6 Enoblituzumab Sales Forecast: Till 2030 (USD Million)
- Figure 13.7 Omburtamab Sales Forecast:Till 2030 (USD Million)
- Figure 13.8 APX005M Sales Forecast: Till 2030 (USD Million)
- Figure 13.9 BI 655064 Sales Forecast: Till 2030 (USD Million)
- Figure 13.10 BMS-986015 Sales Forecast: Till 2030 (USD Million)
- Figure 13.11 CFZ533 Sales Forecast: Till 2030 (USD Million)
- Figure 13.12 GBR 830 Sales Forecast: 2024: 2030 (USD Million)
- Figure 13.13 KHK4083 Sales Forecast: Till 2030 (USD Million)
- Figure 13.14 LAG525 Sales Forecast: Till 2030 (USD Million)
- Figure 13.15 Global Next Generation Immune Checkpoint Inhibitors and Stimulators Market: Distribution by Region (USD Million)
- Figure 13.16 Next Generation Immune Checkpoint Inhibitors and Stimulators Market in North America, Till 2030 (USD Million)
- Figure 13.17 Next Generation Immune Checkpoint Inhibitors and Stimulators Market in UK, Till 2030 (USD Million)
- Figure 13.18 Next Generation Immune Checkpoint Inhibitors and Stimulators Market in Germany, Till 2030 (USD Million)
- Figure 13.19 Next Generation Immune Checkpoint Inhibitors and Stimulators Market in France, Till 2030 (USD Million)
- Figure 13.20 Next Generation Immune Checkpoint Inhibitors and Stimulators Market in Italy, Till 2030 (USD Million)
- Figure 13.21 Next Generation Immune Checkpoint Inhibitors and Stimulators Market in Spain, Till 2030 (USD Million)
- Figure 13.22 Next Generation Immune Checkpoint Inhibitors and Stimulators Market in Australia, Till 2030 (USD Million)
- Figure 13.23 Next Generation Immune Checkpoint Inhibitors and Stimulators Market in Japan, Till 2030 (USD Million)
- Figure 13.24 Next Generation Immune Checkpoint Inhibitors and Stimulators Market in India, Till 2030 (USD Million)
- Figure 13.25 Global Next Generation Immune Checkpoint Inhibitors and Stimulators Market: Distribution by Therapeutic Area (USD Million)
- Figure 13.26 Global Next Generation Immune Checkpoint Inhibitors and Stimulators Market for Oncological Indications, Till 2030 (USD Million)
- Figure 13.27 Global Next Generation Immune Checkpoint Inhibitors and Stimulators Market for Non-Oncological Indications, Till 2030 (USD Million)
- Figure 13.28 Global Next Generation Immune Checkpoint Inhibitors and Stimulators Market for Atopic Dermatitis, Till 2030 (USD Million)
- Figure 13.29 Global Next Generation Immune Checkpoint Inhibitors and Stimulators Market for Breast Cancer, Till 2030 (USD Million)
- Figure 13.30 Global Next Generation Immune Checkpoint Inhibitors and Stimulators Market for Chronic Lymphocytic Leukemia, Till 2030 (USD Million)
- Figure 13.31 Global Next Generation Immune Checkpoint Inhibitors and Stimulators Market for Colorectal Cancer, Till 2030 (USD Million)
- Figure 13.32 Global Next Generation Immune Checkpoint Inhibitors and Stimulators Market for Head and Neck Cancer, Till 2030 (USD Million)
- Figure 13.33 Global Next Generation Immune Checkpoint Inhibitors and Stimulators Market for Lung Cancer, Till 2030 (USD Million)
- Figure 13.34 Global Next Generation Immune Checkpoint Inhibitors and Stimulators Market for Lupus Nephritis, Till 2030 (USD Million)
- Figure 13.35 Global Next Generation Immune Checkpoint Inhibitors and Stimulators Market for Melanoma, Till 2030 (USD Million)
- Figure 13.36 Global Next Generation Immune Checkpoint Inhibitors and Stimulators Market for Multiple Myeloma, Till 2030 (USD Million)
- Figure 13.37 Global Next Generation Immune Checkpoint Inhibitors and Stimulators Market for Neuroblastoma, Till 2030 (USD Million)
- Figure 13.38 Global Next Generation Immune Checkpoint Inhibitors and Stimulators Market for Primary Sjogren's Syndrome, Till 2030 (USD Million)
- Figure 13.39 Global Next Generation Immune Checkpoint Inhibitors and Stimulators Market for Ulcerative colitis, Till 2030 (USD Million)
- Figure 13.40 Global Next Generation Immune Checkpoint Inhibitors and Stimulators Market: Distribution by Target Immune Checkpoint, 2027 and 2030
- Figure 13.41 Global Next Generation Immune Checkpoint Inhibitors and Stimulators Market for B7-H3 Targeting Therapies, Till 2030 (USD Million)
- Figure 13.42 Global Next Generation Immune Checkpoint Inhibitors and Stimulators Market for CD38 Targeting Therapies, Till 2030 (USD Million)
- Figure 13.43 Global Next Generation Immune Checkpoint Inhibitors and Stimulators Market for CD40 Targeting Therapies, Till 2030 (USD Million)
- Figure 13.44 Global Next Generation Immune Checkpoint Inhibitors and Stimulators Market for CD47 Targeting Therapies, Till 2030 (USD Million)
- Figure 13.45 Global Next Generation Immune Checkpoint Inhibitors and Stimulators Market for ICOS Targeting Therapies, Till 2030 (USD Million)
- Figure 13.46 Global Next Generation Immune Checkpoint Inhibitors and Stimulators Market for KIR Targeting Therapies, Till 2030 (USD Million)
- Figure 13.47 Global Next Generation Immune Checkpoint Inhibitors and Stimulators Market for LAG-3 Targeting Therapies, Till 2030 (USD Million)
- Figure 13.48 Global Next Generation Immune Checkpoint Inhibitors and Stimulators Market for OX40 Targeting Therapies, Till 2030 (USD Million)
- Figure 13.49 Global Next Generation Immune Checkpoint Inhibitors and Stimulators Market: Distribution by Mechanism of Action, 2025 and 2030
- Figure 13.50 Global Next Generation Immune Checkpoint Inhibitors and Stimulators Market for Inhibitory Therapies, Till 2030 (USD Million)
- Figure 13.51 Global Next Generation Immune Checkpoint Inhibitors and Stimulators Market for Stimulatory Therapies, Till 2030 (USD Million)
- Figure 13.52 Global Next Generation Immune Checkpoint Inhibitors and Stimulators Market: Distribution by Type of Therapeutic Modality (USD Million)
- Figure 13.53 Global Next Generation Immune Checkpoint Inhibitors and Stimulators Market for Monoclonal Antibody, Till 2030 (USD Million)
- Figure 13.54 Global Next Generation Immune Checkpoint Inhibitors and Stimulators Market for Small Molecule Drugs, Till 2030 (USD Million)
- Figure 13.55 Global Next Generation Immune Checkpoint Inhibitors and Stimulators Market: Distribution by Type of Therapy, 2027 and 2030 (USD Million)
- Figure 13.56 Global Next Generation Immune Checkpoint Inhibitors and Stimulators Market for Monotherapy, Till 2030 (USD Million)
- Figure 13.57 Global Next Generation Immune Checkpoint Inhibitors and Stimulators Market for Combination Therapy, Till 2030 (USD Million)
- Figure 13.58 Global Next Generation Immune Checkpoint Inhibitors and Stimulators Market for Both, Till 2030 (USD Million)
- Figure 13.59 Global Next Generation Immune Checkpoint Inhibitors and Stimulators Market: Distribution by Route of Administration, Till 2030 (USD Million)
- Figure 13.60 Global Next Generation Immune Checkpoint Inhibitors and Stimulators Market for Intracerebroventricular Therapies, Till 2030 (USD Million)
- Figure 13.61 Global Next Generation Immune Checkpoint Inhibitors and Stimulators Market for Intravenous Therapies, Till 2030 (USD Million)
- Figure 13.62 Global Next Generation Immune Checkpoint Inhibitors and Stimulators Market for Subcutaneous Therapies, Till 2030 (USD Million)
 免疫查核点抑制剂市场:按适应症、作用机制、给药途径和最终用户分類的全球市场预测,2026-2032年PD-1/PD-L1查核点抑制剂市场按产品、治疗线、适应症、最终用户和分销管道划分,全球预测,2026-2032 年
 免疫查核点抑制剂市场:依药物类别、癌症类型、通路和地区划分
 免疫查核点抑制剂市场机会、成长要素、产业趋势分析及2026年至2035年预测。
 免疫查核点抑制剂市场规模、份额和成长分析(按类型、应用、分销管道和地区划分)-2026-2033年产业预测
 内源性干细胞动员、全身组织再生和器官间修復途径-技术趋势、研发管线和市场展望(2025-2045)
 免疫查核点抑制剂市场分析及预测(至 2034 年):类型、产品、应用、最终用户、技术、服务、成分、製程、设备
 免疫检查点抑制剂市场,按类型、按给药途径、按分布、按应用、按最终用户、按国家和地区 - 2025 年至 2032 年全球行业分析、市场规模、市场份额和预测