


 |
市场调查报告书
商品编码
1891245
智慧标籤市场:产业趋势及全球预测(至 2035 年)-依技术类型、包装类型、初级包装类型、次要包装类型和地区划分Smart Labels Market: Industry Trends and Global Forecasts, till 2035 - Distribution by Type of Technology, Type of Packaging, Type of Primary Packaging, Type of Secondary Packaging and Geographical Regions |
||||||
全球智慧标籤市场概览
全球智慧标籤市场预计将从目前的 540 万美元成长到 2035 年的 2,400 万美元,预测期内(至 2035 年)复合年增长率 (CAGR) 为 16%。
市场规模和机会分析基于以下参数进行细分:
技术型别
- RFID
- NFC
- 其他
包装类型
- 初级包装
- 二级包装
初级包装类型
- 小瓶
- 注射器
- 药筒
- 安瓿瓶
- 瓶装
- 泡罩包装
二级包装类型
- 盒装
- 纸盒
- 袋装
地理区域
- 北美
- 欧洲
- 亚太地区
- 中东和北非
- 拉丁美洲
全球智慧标籤市场:成长与趋势
传统上,药品透过印刷文字和图像传递重要讯息。近年来,智慧标籤的引入使开发商能够向消费者传递更多产品讯息,而无需占用额外的包装空间。重要的是,智慧标籤包含应答器代码,可被无线射频识别(RFID)智慧标籤和近场通讯(NFC)标籤晶片等先进设备侦测到。虽然大多数智慧型手机可以读取NFC和RFID标籤,但读取智慧标籤需要专用接收器。此外,智慧标籤在製药生产中至关重要。智慧标籤透过提高生产效率和准确性、管理库存以及确保产品品质来支援製药生产流程。
为了最大限度地减少假药的影响,并减少因标籤不当和包装模糊不清而导致的药物滥用,製药和生物技术公司已开始逐步将智慧标籤纳入其包装需求。事实上,过去十年中,医疗保健产业的智慧标籤和系统市场经历了显着成长。这主要是由于产品级药品标籤和用于员工、患者和资产的即时定位系统(RTLS)的采用,旨在提高生产效率、安全性和可用性,并减少行业损失。
医药和奢侈品等行业对诈欺问题的日益关注,推动了NFC和RFID技术在监管合规和认证方面的应用,包括欧盟的 "假药指令" 。此外,在技术创新方面,与人工智慧、区块链和感测器的无缝集成,能够透过预测分析、状态监测和扩增实境(AR)标籤,改善消费者互动。同时,对永续和可回收标籤的需求,也与食品和零售业环保包装的趋势相契合,旨在减少浪费。在药品需求不断增长和追踪系统日益精密的推动下,预计未来几年该市场前景和扩张将显着增长。
全球智慧标籤市场:关键洞察
本报告深入分析了全球智慧标籤市场的现状,并指出了该行业的潜在成长机会。主要发现包括:
- 在当前市场格局下,全球已有超过90家公司进入智慧医药标籤领域。
- 超过 80 家公司正在应用基于无线射频识别 (RFID) 设备的尖端技术,为各种应用开发尖端标籤。物联网标籤也日益受到关注。
- 目前,31% 的服务供应商声称能够为两个或多个应用领域提供智慧标籤。
- 与智慧医药标籤相关的 400 多项专利已获授权或正在申请中,主要由北美地区的产业参与者推动。
- 该领域的专利活动正以41%的复合年增长率成长,值得注意的是,大多数专利申请都来自产业参与者。
- 近年来,涉及国际和国内利益相关者的合作关係日益增多,证明了人们对该领域的兴趣日益浓厚。
- 无论是老牌公司还是新进者,都已在该领域建立了策略联盟,其中超过40%的交易是在过去两年内完成的。
- 收购已成为新进业者采用的最主要的合作模式;事实上,40%的收购案都发生在过去12个月内。
- 我们根据先锋、移民和定居者分类图,将智慧标籤供应商分为不同类别。我们预计,部分先锋企业将在长期内提供市场领先的价值主张。
- 预计未来十年,市场成长率将超过 16%。这一机会很可能广泛分布于各种技术类型和地理区域。
- 从长远来看,为药品初级包装提供智慧标籤以防止药品造假的公司预计将占大部分收入占有率。
全球智慧标籤市场:主要细分市场
RFID细分市场占智慧标籤市场最大占有率
依技术类型划分,市场可分为RFID、NFC和其他技术。目前,RFID细分市场占全球智慧标籤市场最大占有率(约75%),这主要归功于其能够快速且有效率地撷取资料。
依包装类型划分,初级包装细分市场是全球智慧标籤市场中成长最快的细分市场。
依包装类型划分,市场可分为初级包装和二级包装。目前,初级包装细分市场占智慧标籤市场最大占有率(95%)。这是因为初级包装比二级药品包装更为重要,因为它与产品直接接触,对于维持产品的品质、安全性和外观至关重要。此外,预计该细分市场将以相对较高的复合年增长率 (CAGR) 成长。
注射器细分市场在智慧标籤市场中占最大占有率。
依初级包装类型划分,市场可分为小瓶、注射器、药筒、安瓿、瓶子和泡罩包装。目前,注射器细分市场在智慧标籤市场中占最大占有率 (40%)。此外,预计该细分市场在预测期内将以相对较高的复合年增长率 (CAGR) 成长。
依二级包装类型划分,预计纸盒细分市场在预测期内将成为智慧标籤市场中成长最快的细分市场。
依二级包装类型划分,市场可分为盒子、纸盒和软袋。目前,纸盒细分市场在智慧标籤市场中占最大占有率 (50%)。值得注意的是,纸盒智慧标籤市场预计将以相对较高的复合年增长率成长。
欧洲占最大的市场占有率。
依主要地区划分,市场分为北美、欧洲、亚太、拉丁美洲以及中东和北非。目前,欧洲(35%)在智慧标籤市场中处于领先地位,占最大的收入占有率。此外,拉丁美洲市场预计将以更高的复合年增长率成长。
全球智慧标籤市场代表性公司
- CCL Industries
- Schreiner MediPharm
- Datalogic
- Tadbik
- SATO Asia Pacific
- Invengo(已被ASSA ABLOY收购)
- Intellhydro Technology
- RFiD Discovery(已被Paragon ID收购)
- ID Tech Solutions(已被Eruditus Group收购)
全球智慧标籤市场:研究范围
- 市场规模和机会分析:本报告对全球智慧标籤市场进行了详细分析,重点关注以下关键市场细分:[A] 技术类型,[B] 包装类型,[C] 初级包装类型,[D] 二级包装类型,以及 [E] 地理区域。
- 市场概览:对提供智慧医药标籤的公司进行全面评估,考虑[A]技术类型、[B]RFID频段和[C]应用领域等各种参数。
- 公司竞争力分析:对开发智慧医药标籤的公司进行深入的竞争分析,考察[A]供应商优势、[B]服务优势和[C]产品组合优势等因素。
- 公司简介:详细介绍专注于提供智慧医药标籤的公司,重点关注[A]公司概况、[B]产品组合和[C]近期发展及未来前景。
- 专利分析:基于以下相关参数,对迄今为止已提交和已授权的与智能医药和医疗标籤相关的专利进行详细分析:[A] 专利类型,[B] 公开年份,[C] 地理位置/专利管辖区,[D] 法律状态,[E] CPC 分类号,[F] 行业类型,[G] 专利
- 合作与伙伴关係:本报告基于多个参数,深入分析了该领域利益相关者签署的协议,包括:[A] 合作年份,[B] 合作类型,[C] 最活跃的参与者,以及 [D] 合作活动的地域分布。
- SWOT 分析:本报告运用 SWOT 分析框架,深入探讨了可能影响产业发展的相关趋势、关键市场驱动因素和挑战。此外,Harvey Ball 分析还阐明了每个 SWOT 参数对整个智慧医学和医疗保健标籤市场的相对影响。
目录
第一章:引言
第二章:摘要
第三章:导论
- 章节概述
- 智慧标籤在医疗保健中的作用
- 智慧标籤实施的障碍与挑战
- 智慧标籤在医疗保健领域的应用
- 未来展望
第四章:市场概况
- 章节概述
- 智慧医药与医疗保健标籤供应商:市场概况
第五章:竞争分析
第六章:公司简介
- 章节概述
- CCL Industries
- Schreiner
- Datalogic
- Tadbik
- SATO Asia Pacific
- Invengo
- Intellhydro Technology
- RFiD Discovery
- ID Tech解决方案
第七章 专利分析
- 章节概述
- 研究范围与方法
- 智慧医药与医疗保健标籤:专利分析
- 智慧医药与医疗保健标籤:专利基准分析
- 智慧医药与医疗保健标籤:专利估值分析
第八章:合作与伙伴关係
- 章节概述
- 合作模式
- 智慧医药与医疗照护标籤:近期合作与伙伴关係
第九章:蓝海战略
第十章 市场规模评估与机会分析
- 章节概述
- 关键假设与研究方法
- 全球智慧医药与医疗保健标章市场2035
- 智慧医药与医疗保健标章市场:依技术类型分析(至2035年)
- 智慧医药与医疗保健标籤市场:依包装类型分析(至2035年)
- 智慧医药和医疗保健标籤市场:依地区分析(至2035年)
第十一章:SWOT分析
第十二章:结论
第十三章:附录一:表格资料
第十四章:附录二:公司与组织清单
Global Smart Labels Market: Overview
As per Roots Analysis, the global smart labels market is estimated to grow from USD 5.4 million in the current year to USD 24.0 million by 2035, at a CAGR of 16% during the forecast period, till 2035.
The market sizing and opportunity analysis has been segmented across the following parameters:
Type of Technology
- RFID
- NFC
- Other Technologies
Type of Packaging
- Primary Packaging
- Secondary Packaging
Type of Primary Packaging
- Vials
- Syringes
- Cartridges
- Ampoules
- Bottles
- Blister Packs
Type of Secondary Packaging
- Boxes
- Cartons
- Pouches
Geographical Regions
- North America
- Europe
- Asia-Pacific
- Middle East and North Africa
- Latin America
Global Smart Labels Market: Growth and Trends
Historically, important information was communicated through text and images printed on pharmaceutical products. In recent times, the adoption of smart labels has enabled developers to communicate more information about the product to consumers, eliminating the necessity for extra packaging space. It is important to mention that smart labels have a transponder code that can be detected by advanced devices, such as radio frequency identification device (RFID Smart Labels) tags and near-field communication (NFC Tags) chips. Although the majority of smartphones can read NFC and RFID tags, smart labels require specialized receivers for reading. Additionally, intelligent labels are essential in the production of medications. Smart labels can assist the pharmaceutical production process by improving productivity and precision, overseeing inventory, and ensuring product quality.
To minimize the effects of counterfeit medications and decrease medication errors arising from inadequate labeling and ambiguous packaging, pharmaceutical and biotech drug manufacturers have progressively started using smart labels for their packaging needs. Indeed, the healthcare industry has seen a significant rise in the market for smart tags and systems over the last ten years. This is mainly attributed to the implementation of product-level medicine tagging and real time locating systems (RTLS) for staff, patients, and assets, aimed at enhancing productivity, safety, and availability, while reducing the losses experienced by the sector.
Rising worries regarding fraud in sectors like pharmaceuticals and luxury goods are driving the adoption of NFC and RFID for authentication and compliance with regulations, including the EU's Falsified Medicines Directive. Further, in terms of technological innovation, smooth connectivity with AI, blockchain, and sensors enables predictive analytics, condition monitoring and improved consumer interaction through AR-enabled labels. Moreover, the need for sustainable, recyclable labels corresponds with eco-friendly packaging trends, minimizing waste in the food and retail industries. Fueled by the increasing need for pharmaceutical drugs and enhanced tracking systems, future prospects and expansion within this market are expected to experience significant growth in the coming years.
Global Smart Labels Market: Key Insights
The report delves into the current state of global smart labels market and identifies potential growth opportunities within industry. Some key findings from the report include:
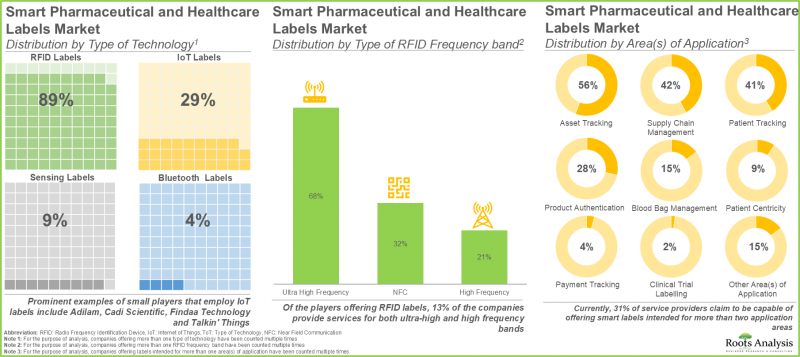
- The current market landscape features the presence of over 90 players engaged in the smart pharmaceutical and healthcare labels domain, worldwide.
- Over 80 players employ radio frequency identification device-based technology in order to develop cutting-edge labels for a wide range of applications; IoT labels are also gaining traction.
- Currently, 31% of service providers claim to be capable of offering smart labels intended for more than two application areas.
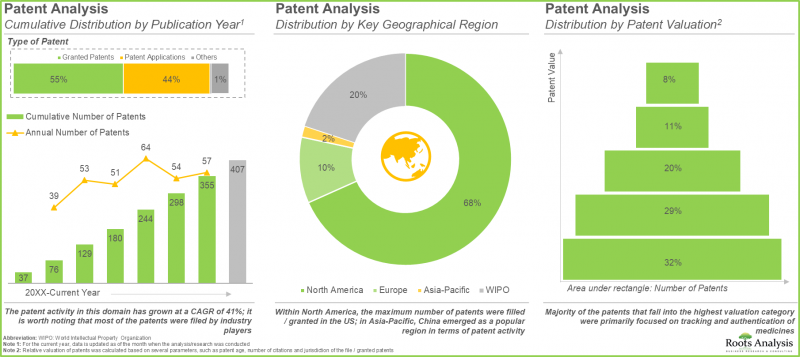
- More than 400 patents have been granted / filed for smart pharmaceutical and healthcare labels, primarily led by industry players based in North America.
- The patent activity in this domain has grown at a CAGR of 41%; it is worth noting that most of the patents were filed by industry players.
- A rise in partnerships, in the recent past, involving both international and indigenous stakeholders, validate the growing interest in this domain.
- Both well-established and new entrants have forged strategic partnerships in this domain; over 40% of the deals were inked in the last two years.
- Acquisitions emerged as the most prominent partnership model adopted by players; in fact, 40% of the acquisition instances were reported in the past 12 months.
- Based on the pioneer-migrator-settler map, we have classified the smart label providers into different categories; a selection of pioneers is expected to provide valuable offerings to lead the market in the longer term.
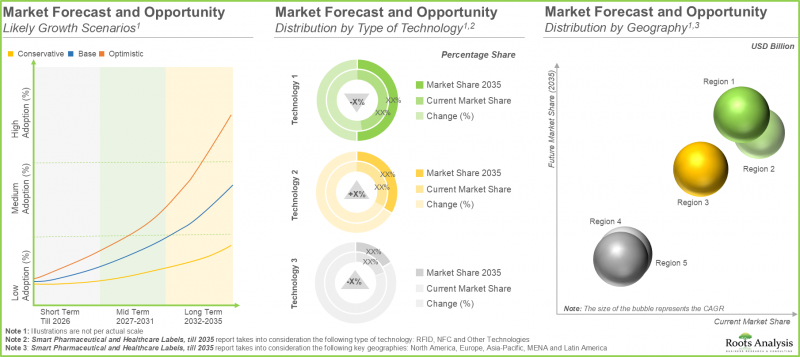
- The market is expected to witness a growth of over 16% in the coming decade; the opportunity is likely to be well distributed across various types of technology and different geographical regions.
- In long term, the majority share of revenues is likely to be driven by players offering smart labels for primary packaging to prevent counterfeiting of drugs.
Global Smart Labels Market: Key Segments
RFID Segment Occupies the Largest Share of the Smart Labels Market
In terms of the type of technology, the market is segmented into RFID, NFC and other technologies. At present, RFID segment holds the maximum (~75%) share of the global smart labels market owing to their ability to allow quick and efficient data capture.
By Type of Packaging, Primary Packaging Segment is the Fastest Growing Segment of the Global Smart Labels Market
In terms of type of packaging, the market is segmented into primary packaging and secondary packaging. Currently, primary packaging segment captures the highest proportion (95%) of the smart labels market. This can be attributed to the fact that primary packaging plays a more critical role than pharmaceutical secondary packaging, since it directly engages with the product and is crucial for maintaining its quality, safety, and appearance. Additionally, this segment is expected to expand at a comparatively higher CAGR.
Syringes Segment Occupies the Largest Share of the Smart Labels Market
In terms of the type of primary packaging, the market is segmented into vials, syringes, cartridges, ampoules, bottles and blister packs. At present, the syringes segment holds the maximum share (40%) of the smart labels market. In addition, this segment is likely to grow at a relatively higher CAGR during the forecast period.
By Secondary Packaging, the Cartons Segment is the Fastest Growing Segment of the Smart Labels Market During the Forecast Period
In terms of secondary packaging, the market is segmented into boxes, cartons and pouches. Currently, the cartons segment captures the highest proportion (50%) of the smart labels market. Further, it is worth highlighting that the smart labels market for cartons segment is likely to grow at a relatively higher CAGR.
Europe Accounts for the Largest Share of the Market
In terms of key geographical regions, the market is segmented into North America, Europe, Asia-Pacific, Latin America, and Middle East and North Africa. Currently, Europe (35%) dominates the smart labels market and accounts for the largest revenue share. Further, the market in Latin America is expected to grow at a higher CAGR.
Example Players in the Global Smart Labels Market
- CCL Industries
- Schreiner MediPharm
- Datalogic
- Tadbik
- SATO Asia Pacific
- Invengo (acquired by ASSA ABLOY)
- Intellhydro Technology
- RFiD Discovery (acquired by Paragon ID)
- ID Tech Solutions (acquired by Eruditus Group)
Global Smart Labels Market: Research Coverage
- Market Sizing and Opportunity Analysis: The report features an in-depth analysis of the global smart labels market, focusing on key market segments, including [A] type of technology, [B] type of packaging, [C] type of primary packaging, [D] type of secondary packaging and [E] geographical regions.
- Market Landscape: A comprehensive evaluation of players engaged in the smart pharmaceutical and healthcare label providers domain, considering various parameters, such as [A] type of technology, [B] RFID frequency band and [C] area(s) of application.
- Company Competitiveness Analysis: An insightful competitive analysis of companies engaged in the development of smart pharmaceutical and healthcare labels, examining factors, such as [A] supplier strength, [B] service strength and [C] portfolio strength.
- Company Profiles: In-depth profiles of companies that claim to specialize in offering smart pharmaceutical and healthcare labels, focusing on [A] company overview, [B] product portfolio and [C] recent developments and an informed future outlook.
- Patent Analysis: A detailed analysis of patents related to smart pharmaceutical and healthcare labels that have been filed / granted till date, based on several relevant parameters, such as [A] type of patent, [B] publication year, [C] geographical location / patent jurisdiction, [D] legal status, [E] CPC symbols, [F] type of industry, [G] type of applicant, [H] leading players and [I] patent valuation analysis.
- Partnerships and Collaborations: An insightful analysis of the deals inked by stakeholders in this domain, based on several parameters, such as [A] year of partnership, [B] type of partnership, [C] most active player and [D] geographical distribution of partnership activity.
- SWOT Analysis: A detailed discussion on affiliated trends, key drivers and challenges, under a SWOT framework, which are likely to impact the industry's evolution, along with a Harvey ball analysis, highlighting the relative effect of each SWOT parameter on the overall smart pharmaceutical and healthcare labels market.
Key Questions Answered in this Report
- How many companies are currently engaged in this market?
- Which are the leading companies in this market?
- What factors are likely to influence the evolution of this market?
- What is the current and future market size?
- What is the CAGR of this market?
- How is the current and future market opportunity likely to be distributed across key market segments?
Reasons to Buy this Report
- The report provides a comprehensive market analysis, offering detailed revenue projections of the overall market and its specific sub-segments. This information is valuable to both established market leaders and emerging entrants.
- Stakeholders can leverage the report to gain a deeper understanding of the competitive dynamics within the market. By analyzing the competitive landscape, businesses can make informed decisions to optimize their market positioning and develop effective go-to-market strategies.
- The report offers stakeholders a comprehensive overview of the market, including key drivers, barriers, opportunities, and challenges. This information empowers stakeholders to stay abreast of market trends and make data-driven decisions to capitalize on growth prospects.
Additional Benefits
- Complimentary PPT Insights Packs
- Complimentary Excel Data Packs for all Analytical Modules in the Report
- 15% Free Content Customization
- Detailed Report Walkthrough Session with Research Team
- Free Updated report if the report is 6-12 months old or older
TABLE OF CONTENTS
1. PREFACE
- 1.1. Scope of the Report
- 1.2. Research Methodology
- 1.2.1. Research Assumptions
- 1.2.2. Project Methodology
- 1.2.3. Forecast Methodology
- 1.2.4. Robust Quality Control
- 1.2.5. Key Considerations
- 1.2.5.1. Demographics
- 1.2.5.2. Economic Factors
- 1.2.5.3. Government Regulations
- 1.2.5.4. Supply Chain
- 1.2.5.5. COVID Impact / Related Factors
- 1.2.5.6. Market Access
- 1.2.5.7. Healthcare Policies
- 1.2.5.8. Industry Consolidation
- 1.3 Key Questions Answered
- 1.4. Chapter Outlines
2. EXECUTIVE SUMMARY
3. INTRODUCTION
- 3.1. Chapter Overview
- 3.2. Role of Smart Labels in the Healthcare Sector
- 3.2.1. Types of Smart Labels
- 3.2.1.1. Radio Frequency Identification Device (RFID)
- 3.2.1.2. Near-Field Communication (NFC)
- 3.2.1.3. Internet of Things (IoT)
- 3.2.2. Need for Smart Labels in the Healthcare Sector
- 3.2.3. Advantages of Using Smart Labels in Healthcare Sector
- 3.2.1. Types of Smart Labels
- 3.3. Roadblocks and Challenges Associated with the Adoption of Smart Labels
- 3.4. Adoption of Smart Labels in the Healthcare Sector
- 3.4.1. Key Drivers for Adoption of Smart Labels
- 3.5. Future Outlook
4. MARKET LANDSCAPE
- 4.1. Chapter Overview
- 4.2. Smart Pharmaceutical and Healthcare Label Providers: Overall Market Landscape
- 4.2.1. Analysis by Year of Establishment
- 4.2.2. Analysis by Company Size
- 4.2.3. Analysis by Location of Headquarters
- 4.2.4. Analysis by Company Size and Location of Headquarters
- 4.2.5. Analysis by Type of Technology
- 4.2.6. Analysis by Company Size and Type of Technology
- 4.2.7. Analysis by Type of RFID Frequency Band
- 4.2.8. Analysis by Area(s) of Application
- 4.2.9. Analysis by Company Size and Area(s) of Application
- 4.2.10. Analysis by Type of Technology and Area(s) of Application
5. COMPANY COMPETITIVENESS ANALYSIS
- 5.1. Chapter Overview
- 5.2. Assumptions / Key parameter
- 5.3. Methodology
- 5.3.1. Smart Pharmaceutical and Healthcare Label Providers based in North America
- 5.3.2. Smart Pharmaceutical and Healthcare Label Providers based in Europe
- 5.3.3. Smart Pharmaceutical and Healthcare Label Providers based in Asia-Pacific
- 5.4. Company Competitiveness Analysis: Benchmarking the Capabilities of Leading Players
6. COMPANY PROFILES
- 6.1. Chapter Overview
- 6.2. CCL Industries
- 6.2.1. Company Overview
- 6.2.2. Financial Information
- 6.2.3. Area(s) of Application
- 6.2.4. Recent Developments and Future Outlook
- 6.3. Schreiner
- 6.3.1. Company Overview
- 6.3.2. Area(s) of Application
- 6.3.3. Recent Developments and Future Outlook
- 6.4. Datalogic
- 6.4.1. Company Overview
- 6.4.2. Financial Information
- 6.4.3. Area(s) of Application
- 6.4.4. Recent Developments and Future Outlook
- 6.5. Tadbik
- 6.5.1. Company Overview
- 6.5.2. Area(s) of Application
- 6.5.3. Recent Developments and Future Outlook
- 6.6. SATO Asia Pacific
- 6.6.1. Company Overview
- 6.6.2. Financial Information
- 6.6.3. Area(s) of Application
- 6.6.4. Recent Developments and Future Outlook
- 6.7. Invengo
- 6.7.1. Company Overview
- 6.7.2. Area(s) of Application
- 6.7.3. Recent Developments and Future Outlook
- 6.8. Intellhydro Technology
- 6.8.1. Company Overview
- 6.8.2. Area(s) of Application
- 6.8.3. Recent Developments and Future Outlook
- 6.9. RFiD Discovery
- 6.9.1. Company Overview
- 6.9.2. Area(s) of Application
- 6.9.3. Recent Developments and Future Outlook
- 6.10. ID Tech Solutions
- 6.10.1. Company Overview
- 6.10.2. Area(s) of Application
- 6.10.3. Recent Developments and Future Outlook
7. PATENT ANALYSIS
- 7.1. Chapter Overview
- 7.2. Scope and Methodology
- 7.3. Smart Pharmaceutical and Healthcare Labels: Patent Analysis
- 7.3.1. Analysis by Publication Year
- 7.3.2. Analysis by Publication Year and Type of Patent
- 7.3.3. Analysis by CPC Code
- 7.3.4. Analysis by Type of Applicant
- 7.3.5. Analysis by Geography
- 7.3.6. Analysis by Emerging Focus Areas
- 7.3.7. Leading Industry Players: Analysis by Number of Patents
- 7.4. Smart Pharmaceutical and Healthcare Labels: Patent Benchmarking Analysis
- 7.4.1. Analysis by Patent Characteristics
- 7.5. Smart Pharmaceutical and Healthcare Labels: Patent Valuation Analysis
8. PARTNERSHIPS AND COLLABORATIONS
- 8.1. Chapter Overview
- 8.2. Partnership Models
- 8.3. Smart Pharmaceutical and Healthcare Labels: Recent Partnerships and Collaborations
- 8.3.1. Analysis by Year of Partnership
- 8.3.2. Analysis by Type of Partnership
- 8.3.3. Most Active Players: Analysis by Number of Partnerships
- 8.3.4. Regional Analysis
- 8.3.4.1. Local and International Agreements
- 8.3.4.2. Intercontinental and Intracontinental Agreements
9. BLUE OCEAN STRATEGY
- 9.1. Chapter Overview
- 9.2. Overview of Blue Ocean Strategy
- 9.2.1. Red Ocean
- 9.2.2. Blue Ocean
- 9.2.3. Comparison of Red Ocean Strategy and Blue Ocean Strategy
- 9.2.4. Smart Pharmaceuticals and Healthcare Labels: Blue Ocean Strategy and Shift Tools
- 9.2.4.1. Value Innovation
- 9.2.4.2. Strategy Canvas
- 9.2.4.3. Four Action Framework
- 9.2.4.4. Eliminate-Raise-Reduce-Create (ERRC) Grid
- 9.2.4.5. Six Path Framework
- 9.2.4.6. Pioneer-Migrator-Settler (PMS) Map
- 9.2.4.7. Three Tiers of Noncustomers
- 9.2.4.8. Sequence of Blue Ocean Strategy
- 9.2.4.9. Buyer Utility Map
- 9.2.4.10. The Price Corridor of the Mass
- 9.2.4.11. Four Hurdles to Strategy Execution
- 9.2.4.12. Tipping Point Leadership
- 9.2.4.13. Fair Process
- 9.3. Concluding Remarks
10. MARKET SIZING AND OPPORTUNITY ANALYSIS
- 10.1. Chapter Overview
- 10.2. Key Assumptions and Methodology
- 10.3. Global Smart Pharmaceutical and Healthcare Labels Market, Till 2035
- 10.4. Smart Pharmaceutical and Healthcare Labels Market: Analysis by Type of Technology, Till 2035
- 10.4.1. Smart Pharmaceutical and Healthcare Labels Market for RFID, Till 2035
- 10.4.2. Smart Pharmaceutical and Healthcare Labels Market for NFC, Till 2035
- 10.4.3. Smart Pharmaceutical and Healthcare Labels Market for Other Technologies, Till 2035
- 10.5. Smart Pharmaceutical and Healthcare Labels Market: Analysis by Type of Packaging, Till 2035
- 10.5.1. Smart Pharmaceutical and Healthcare Labels Market: Analysis by Type of Primary Packaging, Till 2035
- 10.5.1.1. Smart Pharmaceutical and Healthcare Labels Market for Vials, Till 2035
- 10.5.1.2. Smart Pharmaceutical and Healthcare Labels Market for Syringes, Till 2035
- 10.5.1.3. Smart Pharmaceutical and Healthcare Labels Market for Cartridges, Till 2035
- 10.5.1.4. Smart Pharmaceutical and Healthcare Labels Market for Ampoules, Till 2035
- 10.5.1.5. Smart Pharmaceutical and Healthcare Labels Market for Bottles, Till 2035
- 10.5.1.6. Smart Pharmaceutical and Healthcare Labels Market for Blister Packs, Till 2035
- 10.5.2. Smart Pharmaceutical and Healthcare Labels Market: Analysis by Type of Secondary Packaging, Till 2035
- 10.5.2.1. Smart Pharmaceutical and Healthcare Labels Market for Boxes, Till 2035
- 10.5.2.2. Smart Pharmaceutical and Healthcare Labels Market for Cartons, Till 2035
- 10.5.2.3. Smart Pharmaceutical and Healthcare Labels Market for Pouches, Till 2035
- 10.5.1. Smart Pharmaceutical and Healthcare Labels Market: Analysis by Type of Primary Packaging, Till 2035
- 10.6. Smart Pharmaceutical and Healthcare Labels Market: Analysis by Geography, Till 2035
- 10.6.1. Smart Pharmaceutical and Healthcare Labels Market in North America, Till 2035
- 10.6.2. Smart Pharmaceutical and Healthcare Labels Market in Europe, Till 2035
- 10.6.3. Smart Pharmaceutical and Healthcare Labels Market in Asia-Pacific, Till 2035
- 10.6.4. Smart Pharmaceutical and Healthcare Labels Market in MENA, Till 2035
- 10.6.5. Smart Pharmaceutical and Healthcare Labels Market in Latin America, Till 2035
11. SWOT ANALYSIS
- 11.1. Chapter Overview
- 11.2. Strengths
- 11.3. Weaknesses
- 11.4. Opportunities
- 11.5. Threats
- 11.6. Comparison of SWOT Factors
12. CONCLUDING REMARKS
13. APPENDIX I: TABULATED DATA
14. APPENDIX II: LIST OF COMPANIES AND ORGANIZATIONS
List of Tables
- Table 4.1 Smart Pharmaceutical and Healthcare Label Providers: List of Companies
- Table 4.2 Smart Pharmaceutical and Healthcare Label Providers: Information on Type of RFID Frequency Band
- Table 4.3 Smart Pharmaceutical and Healthcare Label Providers: Information on Area(s) of Application
- Table 5.1 Company Competitiveness: Benchmarking the Capabilities of Leading Players
- Table 6.1 CCL Industries: Company Overview
- Table 6.2 CCL Industries: Recent Developments and Future Outlook
- Table 6.3 Schreiner: Company Overview
- Table 6.4 Schreiner: Recent Developments and Future Outlook
- Table 6.5 Datalogic: Company Overview
- Table 6.6 Datalogic: Recent Developments and Future Outlook
- Table 6.7 Tadbik: Company Overview
- Table 6.8 SATO: Company Overview
- Table 6.9 SATO: Recent Developments and Future Outlook
- Table 6.10 Invengo: Company Overview
- Table 6.11 Invengo: Recent Developments and Future Outlook
- Table 6.12 Intellhydro Technology: Company Overview
- Table 6.12 RFiD Discovery: Company Overview
- Table 6.13 RFiD Discovery: Recent Developments and Future Outlook
- Table 6.14 ID Tech Solutions: Company Overview
- Table 7.1 Patent Analysis: Top CPC Sections
- Table 7.2 Patent Analysis: Top CPC Symbols
- Table 7.3 Patent Analysis: Top CPC Codes
- Table 7.4 Patent Analysis: Summary of Benchmarking
- Table 7.5 Patent Analysis: List of Leading Patents (by Highest Relative Valuation)
- Table 8.1 Smart Pharmaceutical and Healthcare Labels: List of Partnerships and Collaborations
- Table 10.1 Average Prices of Primary Packaging Containers and Secondary Packaging Containers
- Table 13.1 Smart Pharmaceutical and Healthcare Label Providers: Distribution by Year of Establishment
- Table 13.2 Smart Pharmaceutical and Healthcare Label Providers: Distribution by Company Size
- Table 13.3 Smart Pharmaceutical and Healthcare Label Providers: Distribution by Location of Headquarters
- Table 13.4 Smart Pharmaceutical and Healthcare Label Providers: Distribution by Company Size and Location of Headquarters
- Table 13.5 Smart Pharmaceutical and Healthcare Label Providers: Distribution by Type of Technology
- Table 13.6 Smart Pharmaceutical and Healthcare Label Providers: Distribution by Company Size and Type of Technology
- Table 13.7 Smart Pharmaceutical and Healthcare Label Providers: Distribution by Type of RFID Frequency Band
- Table 13.8 Smart Pharmaceutical and Healthcare Label Providers: Distribution by Area(s) of Application
- Table 13.9 Smart Pharmaceutical and Healthcare Label Providers: Distribution Company Size and Area(s) of Application
- Table 13.10 Smart Pharmaceutical and Healthcare Label Providers: Distribution by Type of Technology and Area(s) of Application
- Table 13.11 CCL Industries: Annual Revenues, Since 2018 (CAD Billion)
- Table 13.12 Datalogic: Annual Revenues, Since 2018 (EUR Billion)
- Table 13.13 SATO: Annual Revenues, Since 2018 (JPY Billion)
- Table 13.14 Patent Analysis: Distribution by Type of Patent
- Table 13.15 Patent Analysis: Cumulative Distribution by Publication Year, Since 2015
- Table 13.16 Patent Analysis: Distribution by Type of Patent and Publication Year
- Table 13.17 Patent Analysis: Distribution by Type of Applicant
- Table 13.18 Patent Analysis: Distribution by Geography
- Table 13.19 Leading Industry Players: Distribution by Number of Patents
- Table 13.20 Patent Analysis: Distribution by Patent Age, Since 2015
- Table 13.21 Partnerships and Collaborations: Distribution by Cumulative Year-wise Trend of Partnerships, Since 2018
- Table 13.22 Partnerships and Collaborations: Distribution by Type of Partnership
- Table 13.23 Partnerships and Collaborations: Distribution by Year and Type of Partnership
- Table 13.24 Most Active Players: Distribution by Number of Partnership Instances
- Table 13.25 Partnerships and Collaborations: Distribution by Local and International Agreements
- Table 13.26 Partnerships and Collaborations: Distribution by Intercontinental and Intracontinental Agreements
- Table 13.27 Global Smart Pharmaceutical and Healthcare Labels Market, Conservative, Base and Optimistic Scenarios, Till 2035 (USD Billion)
- Table 13.28 Smart Pharmaceutical and Healthcare Labels Market: Distribution by Type of Technology (USD Million)
- Table 13.29 Smart Pharmaceutical and Healthcare Labels Market for RFID Labels, Conservative, Base and Optimistic Scenarios, Till 2035 (USD Million)
- Table 13.30 Smart Pharmaceutical and Healthcare Labels Market for NFC Labels, Conservative, Base and Optimistic Scenarios, Till 2035 (USD Million)
- Table 13.31 Smart Pharmaceutical and Healthcare Labels Market for Other Labels, Conservative, Base and Optimistic Scenarios, Till 2035 (USD Million)
- Table 13.32 Smart Pharmaceutical and Healthcare Labels Market: Distribution by Type of Packaging, Conservative, Base and Optimistic Scenarios, Till 2035 (USD Million)
- Table 13.33 Smart Pharmaceutical and Healthcare Labels Market: Distribution by Type of Primary Packaging (USD Million)
- Table 13.34 Smart Pharmaceutical and Healthcare Labels Market for Vials, Conservative, Base and Optimistic Scenarios, Till 2035 (USD Million)
- Table 13.35 Smart Pharmaceutical and Healthcare Labels Market for Syringes, Conservative, Base and Optimistic Scenarios, Till 2035 (USD Million)
- Table 13.36 Smart Pharmaceutical and Healthcare Labels Market for Cartridges, Conservative, Base and Optimistic Scenarios, Till 2035 (USD Million)
- Table 13.37 Smart Pharmaceutical and Healthcare Labels Market for Ampoules, Conservative, Base and Optimistic Scenarios, Till 2035 (USD Million)
- Table 13.38 Smart Pharmaceutical and Healthcare Labels Market for Bottles, Conservative, Base and Optimistic Scenarios, Till 2035 (USD Million)
- Table 13.39 Smart Pharmaceutical and Healthcare Labels Market for Blister Packs, Conservative, Base and Optimistic Scenarios, Till 2035 (USD Million)
- Table 13.40 Smart Pharmaceutical and Healthcare Labels Market: Distribution by Type of Secondary Packaging (USD Million)
- Table 13.41 Smart Pharmaceutical and Healthcare Labels Market for Boxes, Conservative, Base and Optimistic Scenarios, Till 2035 (USD Million)
- Table 13.42 Smart Pharmaceutical and Healthcare Labels Market for Cartons, Conservative, Base and Optimistic Scenarios, Till 2035 (USD Million)
- Table 13.43 Smart Pharmaceutical and Healthcare Labels Market for Pouches, Conservative, Base and Optimistic Scenarios, Till 2035 (USD Million)
- Table 13.44 Smart Pharmaceutical and Healthcare Labels Market in North America, Conservative, Base and Optimistic Scenarios, Till 2035 (USD Million)
- Table 13.45 Smart Pharmaceutical and Healthcare Labels Market in Europe, Conservative, Base and Optimistic Scenarios, Till 2035 (USD Million)
- Table 13.46 Smart Pharmaceutical and Healthcare Labels Market in Asia-Pacific, Conservative, Base and Optimistic Scenarios, Till 2035 (USD Million)
- Table 13.47 Smart Pharmaceutical and Healthcare Labels Market in MENA, Conservative, Base and Optimistic Scenarios, Till 2035 (USD Million)
- Table 13.48 Smart Pharmaceutical and Healthcare Labels Market in Latin America, Conservative, Base and Optimistic Scenarios, Till 2035 (USD Million)
List of Figures
- Figure 2.1 Executive Summary: Market Landscape
- Figure 2.2 Executive Summary: Partnerships and Collaborations
- Figure 2.3 Executive Summary: Patent Analysis
- Figure 2.4 Executive Summary: Market Sizing and Opportunity Analysis
- Figure 3.1 Comparison of Radio Frequency Identification Device (RFID) and Near-Field Communication (NFC)
- Figure 3.2 Advantages Offered by Smart Labels to Healthcare Industry
- Figure 4.1 Smart Pharmaceutical and Healthcare Label Providers: Distribution by Year of Establishment
- Figure 4.2 Smart Pharmaceutical and Healthcare Label Providers: Distribution by Company Size
- Figure 4.3 Smart Pharmaceutical and Healthcare Label Providers: Distribution by Location of Headquarters
- Figure 4.4 Smart Pharmaceutical and Healthcare Label Providers: Distribution by Company Size and Location of Headquarters
- Figure 4.5 Smart Pharmaceutical and Healthcare Label Providers: Distribution by Type of Technology
- Figure 4.6 Smart Pharmaceutical and Healthcare Label Providers: Distribution by Company Size and Type of Technology
- Figure 4.7 Smart Pharmaceutical and Healthcare Label Providers: Distribution by Type of RFID Frequency Band
- Figure 4.8 Smart Pharmaceutical and Healthcare Label Providers: Distribution by Area(s) of Application
- Figure 4.9 Smart Pharmaceutical and Healthcare Label Providers: Distribution by Company Size and Area(s) of Application
- Figure 4.10 Smart Pharmaceutical and Healthcare Label Providers: Distribution by Type of Technology and Area(s) of Application
- Figure 5.1 Company Competitiveness Analysis: Smart Pharmaceutical and Healthcare Label Providers based in North America
- Figure 5.2 Company Competitiveness Analysis: Smart Pharmaceutical and Healthcare Label Providers based in Europe
- Figure 5.3 Company Competitiveness Analysis: Smart Pharmaceutical and Healthcare Label Providers based in Asia-Pacific & RoW
- Figure 6.1 CCL Industries: Annual Revenues, Since 2018 (CAD Billion)
- Figure 6.2 CCL Industries: Area(s) of Application
- Figure 6.3 Schreiner: Area(s) of Application
- Figure 6.4 Datalogic: Annual Revenues, Since 2018 (EUR Billion)
- Figure 6.5 Datalogic: Area(s) of Application
- Figure 6.6 Tadbik: Area(s) of Application
- Figure 6.7 SATO: Annual Revenues, Since 2018 (JPY Billion)
- Figure 6.8 SATO: Area(s) of Application
- Figure 6.9 Invengo: Area(s) of Application
- Figure 6.10 Intellhydro Technology: Area(s) of Application
- Figure 6.11 RFiD Discovery: Area(s) of Application
- Figure 6.12 ID Tech Solutions: Area(s) of Application
- Figure 7.1 Patent Analysis: Distribution by Type of Patent
- Figure 7.2 Patent Analysis: Cumulative Distribution by Publication Year, Since 2015
- Figure 7.3 Patent Analysis: Distribution by Type of Patent and Publication Year
- Figure 7.4 Patent Analysis: Distribution by CPC Symbols
- Figure 7.5 Patent Analysis: Distribution by Type of Applicant
- Figure 7.6 Patent Analysis: Distribution by Geography
- Figure 7.7 Patent Analysis: Distribution by Emerging Focus Areas
- Figure 7.8 Leading Industry Players: Distribution by Number of Patents
- Figure 7.9 Patent Benchmarking: Distribution of Leading Industry Players by Patent Characteristics (CPC Symbols)
- Figure 7.10 Patent Analysis: Distribution by Patent Age, Since 2015
- Figure 7.11 Patent Analysis: Categorizations based on Weighted Valuation Scores
- Figure 7.12 Patent Analysis: Distribution by Patent Valuation
- Figure 8.1 Partnerships and Collaborations: Cumulative Year-wise Trend of Partnerships, Since 2018
- Figure 8.2 Partnerships and Collaborations: Distribution by Type of Partnership
- Figure 8.3 Partnerships and Collaborations: Distribution by Year and Type of Partnership
- Figure 8.4 Most Active Players: Distribution by Number of Partnership Instances
- Figure 8.5 Partnerships and Collaborations: Distribution by Local and International Agreements
- Figure 8.6 Partnerships and Collaborations: Distribution by Intercontinental and Intracontinental Agreements
- Figure 9.1 Red Ocean Strategy versus Blue Ocean Strategy
- Figure 9.2 Blue Ocean Strategy: Strategy Canvas
- Figure 9.3 Blue Ocean Strategy: Eliminate-Raise-Reduce-Create (ERRC) Grid
- Figure 9.4 Blue Ocean Strategy: Pioneer-Migrator-Settler (PMS) Map
- Figure 9.5 Blue Ocean Strategy: Three Tiers of Noncustomers
- Figure 9.6 Blue Ocean Strategy: Sequence of Blue Ocean Strategy
- Figure 9.7 Blue Ocean Strategy: Buyer Utility Map
- Figure 9.8 Blue Ocean Strategy: The Price Corridor of the Mass
- Figure 10.1 Global Smart Pharmaceutical and Healthcare Labels Market, Till 2035 (USD Billion)
- Figure 10.2 Smart Pharmaceutical and Healthcare Labels Market: Distribution by Type of Technology, Till 2035 (USD Million)
- Figure 10.3 Smart Pharmaceutical and Healthcare Labels Market for RFID Labels, Till 2035 (USD Million)
- Figure 10.4 Smart Pharmaceutical and Healthcare Labels Market for NFC Labels, Till 2035 (USD Million)
- Figure 10.5 Smart Pharmaceutical and Healthcare Labels Market for Other Technologies, Till 2035 (USD Million)
- Figure 10.6 Smart Pharmaceutical and Healthcare Labels Market: Distribution by Type of Packaging, Till 2035 (USD Million)
- Figure 10.7 Smart Pharmaceutical and Healthcare Labels Market: Distribution by Type of Primary Packaging, Till 2035 (USD Million)
- Figure 10.8 Smart Pharmaceutical and Healthcare Labels Market for Vials, Till 2035 (USD Million)
- Figure 10.9 Smart Pharmaceutical and Healthcare Labels Market for Syringes, Till 2035 (USD Million)
- Figure 10.10 Smart Pharmaceutical and Healthcare Labels Market for Cartridges, Till 2035 (USD Million)
- Figure 10.11 Smart Pharmaceutical and Healthcare Labels Market for Ampoules, Till 2035 (USD Million)
- Figure 10.12 Smart Pharmaceutical and Healthcare Labels Market for Bottles, Till 2035 (USD Million)
- Figure 10.13 Smart Pharmaceutical and Healthcare Labels Market for Blister Packs, Till 2035 (USD Million)
- Figure 10.14 Smart Pharmaceutical and Healthcare Labels Market: Distribution by Type of Secondary Packaging, Till 2035 (USD Million)
- Figure 10.15 Smart Pharmaceutical and Healthcare Labels Market for Boxes, Till 2035 (USD Million)
- Figure 10.16 Smart Pharmaceutical and Healthcare Labels Market for Cartons, Till 2035 (USD Million)
- Figure 10.17 Smart Pharmaceutical and Healthcare Labels Market for Pouches, Till 2035 (USD Million)
- Figure 10.18 Smart Pharmaceutical and Healthcare Labels Market: Distribution by Geography, Till 2035 (USD Million)
- Figure 10.19 Smart Pharmaceutical and Healthcare Labels Market in North America, Till 2035 (USD Million)
- Figure 10.20 Smart Pharmaceutical and Healthcare Labels Market in Europe, Till 2035 (USD Million)
- Figure 10.21 Smart Pharmaceutical and Healthcare Labels Market in Asia-Pacific, Till 2035 (USD Million)
- Figure 10.22 Smart Pharmaceutical and Healthcare Labels Market in MENA, Till 2035 (USD Million)
- Figure 10.23 Smart Pharmaceutical and Healthcare Labels Market in Latin America, Till 2035 (USD Million)
- Figure 11.1 SWOT Analysis: Harvey Ball Analysis
- Figure 11.2 Comparison of SWOT Factors: Harvey Ball Analysis
- Figure 12.1 Concluding Remarks: Market Landscape
- Figure 12.2 Concluding Remarks: Patent Analysis
- Figure 12.3 Concluding Remarks: Partnerships and Collaborations
- Figure 12.4 Concluding Remarks: Market Sizing and Opportunity Analysis (1/2)
- Figure 12.5 Concluding Remarks: Market Sizing and Opportunity Analysis (2/2)
 2026年全球智慧食品标籤市场报告
 物流智慧标籤—第二版
 智慧标籤市场分析及预测(至2035年):依类型、产品类型、服务、技术、组件、应用、材质、功能、安装类型及解决方案划分
 智慧标籤:市场占有率分析、产业趋势与统计、成长预测(2026-2031)
 全球智慧标籤市场规模、份额、趋势和成长分析报告(2026-2034年)
 日本智慧标籤市场规模、份额、趋势和预测:按技术、组件、最终用户和地区划分,2026-2034年
 NFC标籤市场:按标籤类型、晶片类型、材料类型、应用和最终用户划分,全球预测,2026-2032年智慧标籤市场规模、占有率、成长及全球产业分析:按技术、终端用户和地区划分的洞察与预测(2026-2034)
 智慧标籤市场规模、份额及成长分析(按技术、组件、应用、最终用户和地区划分)-2026-2033年产业预测
 RFID·智慧标记的全球市场(2025年)