


 |
市场调查报告书
商品编码
1891248
生物製剂合约研究组织 (CRO) 市场:产业趋势及全球预测(至 2035 年)-按生物製剂类型、业务规模、治疗领域和地区划分Biologics Contract Research Organization Market: Industry Trends and Global Forecasts, Till 2035 - Distribution by Type of Biologic, Scale of Operation, Therapeutic Area, and Geography |
||||||
生物製剂合约研究组织 (CRO) 市场概况
预计今年全球生物製剂合约研究组织 (CRO) 市场规模将达到 360 亿美元,并在预测期内以 13% 的复合年增长率 (CAGR) 高速增长,到 2035 年将达到 1260 亿美元。
市场规模和机会分析基于以下参数进行细分:
生物製品类型
- 疫苗
- 细胞疗法
- 基因疗法
- 抗体
- 重组蛋白/胜肽
- 其他
业务规模
- 临床运营
- 临床前研究运营
治疗领域
- 肿瘤学
- 心血管疾病
- 发炎性疾病
- 神经系统疾病
- 其他
区域
- 北美
- 欧洲
- 亚太地区
- 拉丁美洲
- 中东和北非
- 世界其他地区
生物製剂合约研究与开发组织 (CRO) 市场 - 成长与趋势
生物製剂是製药业成长最快的领域之一。
这得益于该领域的快速发展,而这种发展又受到对高效、个人化药物解决方案的需求的驱动。 生物製剂(包括单株抗体、基因疗法和细胞疗法)的需求不断增长,这主要得益于它们在治疗癌症、自体免疫疾病和神经系统疾病等慢性复杂疾病方面的成功应用。不断扩充的生物製剂研发管线和日益提高的核准率进一步强化了这项需求。然而,生物製剂的开发和临床评估是一个高度复杂且成本高昂的过程,需要专业知识和尖端的生物製程技术。因此,许多生物製剂公司选择将药物发现和临床研究活动外包。
目前,生物製剂公司正在采用一种商业模式,即自行负责生物製剂的研发,同时将开发流程外包给外部服务提供者。生物製剂合约研究组织 (CRO) 产业正经历着成长,这主要得益于对创新药物和疾病研究的不断深入。生物製剂的研发是劳力密集的,要求製药公司具备先进的技术知识和专业技能,从而增加了药品的整体成本。此外,严格的监管标准和审批流程可能会延迟药物审批,并导致市场供应短缺。
为了简化这些复杂的流程并应对相关挑战,大型製药公司正逐步将其生物製剂的研发业务外包给专业的合约研究组织 (CRO)。这种策略性外包方式使他们能够利用外部专业知识,加速药物发现和临床试验,并最终有效地将创新生物製剂推向市场。此外,人工智慧的整合有望加速药物发现,简化临床试验(例如,患者招募),并提高生产良率。生物加工自动化和分散式/虚拟临床试验的引入存在许多机遇,这将有助于降低成本并提高数据品质。因此,生物製剂 CRO 市场预计将稳定成长,以满足生物製剂申办者日益增长的研发需求。
生物製剂 CRO 市场 - 主要洞察
本报告深入分析了生物製剂 CRO 市场的现状,并指出了该行业的潜在成长机会。 主要发现包括:
- 目前,有160家公司声称具备为各类生物製品提供合约研究服务和临床试验支援的必要能力。
- 约50%的业者仅提供临床服务,而12%的CRO提供与生物製品临床研究相关的所有服务。
- 当前市场格局高度分散,既有成熟的公司,也有专业的服务供应商,它们提供广泛的服务组合,以支持临床前和临床研究。
- 据估计,大型製药公司目前将其约45%的内部研发工作外包给CRO。
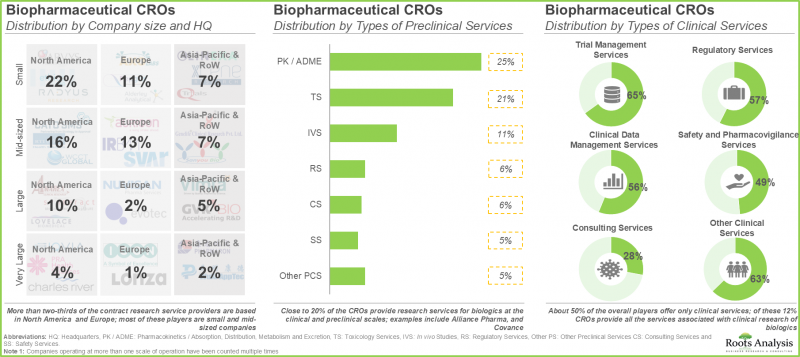
- 超过三分之二的合约研究服务提供者位于北美和欧洲,其中大多数是中小企业。
- 为了获得竞争优势,各公司正积极拓展现有能力,以进一步提升服务品质并适应不断变化的行业标准。
- 目前,生物製剂开发公司正在评估和开发超过8000种候选产品,这为生物製剂CRO市场创造了机会。
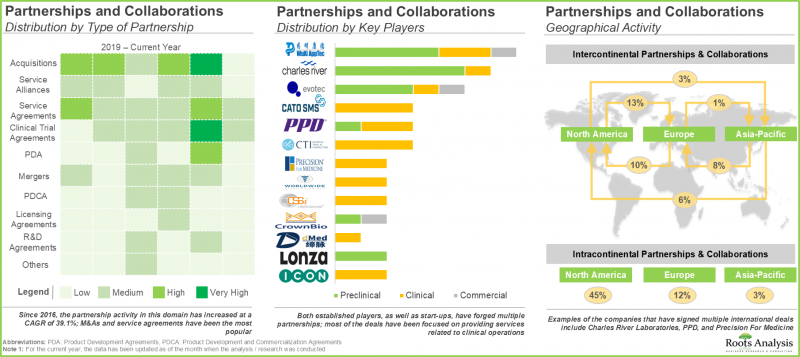
- 利害关係人对该领域的关注也反映在近期合作活动的增加。自2016年以来,业内人士已与申办方和其他CRO签署了多项协议。
- 约 20% 的 CRO 提供临床和临床前生物製剂研究服务。
- 为了因应日益增长的一站式服务需求,产业利害关係人正积极整合其生物製剂研究能力,主要透过併购和内部扩张的方式。
- 预计未来十年,该市场将以约 13% 的复合年增长率成长。这一成长机会很可能均匀分布在各个治疗领域、业务规模、生物製剂类型、最终用户和地理区域。
生物製剂合约研究组织 (CRO) 市场 - 主要细分市场
预计临床领域将占生物製剂 CRO 市场最大的占有率。
依业务规模划分,全球生物製剂 CRO 市场分为三个部分:药物发现、临床前和临床。目前,临床规模的业务占了大部分市场占有率,其次是临床前和药物发现领域。
预计北美将占生物製剂 CRO 市场最大的占有率。
依地区划分,市场分为北美、欧洲和亚太地区。预计北美将占大部分市场占有率 (50%),其次是欧洲 (32%) 和亚太地区 (16%)。
生物製剂CRO市场代表性公司
- 百康 (Biocon)
- 科文斯 (Covance)
- ICON
- 美德佩斯 (Medpace)
- 药明康德 (Pharmaron)
- PPD
- PRA Health Sciences
- Syneos Health
- Vimta Labs
- 药明康德 (WuXi AppTec)
生物製剂CRO市场 - 研究范围
- 市场规模和机会分析:本报告对全球生物製剂合约研究与开发组织 (CRO) 市场进行了详细分析,重点关注以下关键市场细分:[A] 生物製剂类型,[B] 业务规模,[C] 治疗领域,以及 [D] 地区。
- 市场概况:本报告基于以下相关参数对生物製剂服务市场进行全面评估:[A] 成立年份,[B] 公司规模,[C] 总部所在地,[D] 生产的生物製剂类型,[E] 业务规模,以及 [F] 提供的服务类型(包括临床和非临床服务)。
- 公司简介:提供生物製剂相关服务的合约研究组织 (CRO) 的详细简介,重点关注:[A] 公司概况,[B] 财务资讯(如有),[C] 服务组合,以及 [D] 近期发展和未来展望。
- 基准分析:基于以下因素,对参与生物製剂合约研究与开发组织市场的公司进行全面的基准分析:[A] 公司在其同行群体中的能力,以获得竞争优势。
- 合作伙伴关係与合作:基于多项参数,深入分析生物製剂CRO市场利益相关者签署的合约协议,例如[A] 合作年份、[B] 合作类型、[C] 最活跃参与者(按签署协议数量排名)、[D] 企业规模和[E] 地区。
- 併购:基于相关参数,详细分析该产业的併购活动:[A] 收购年份、[B] 合作类型、[C] 地区、[D] 最活跃的收购者、[E] 所有权变更矩阵、[F] 关键价值驱动因素和[G] 收购交易倍数。
- 吸引力/竞争力矩阵:对收购目标进行全面分析,考虑自2016年以来已收购其他公司的企业的历史活动,为其他行业参与者识别潜在收购目标提供参考。
- SWOT 分析:分析可能影响生物製剂 CRO 市场发展的产业相关趋势、机会与挑战。包括哈维鲍尔分析,以评估每个 SWOT 参数对产业动态的相对影响。
目录
第一章:前言
第二章:摘要整理
第三章:导论
第三章:导论
- 章节概述
- 生物製剂概述
- CRO概述
- CRO的发展历程
- CRO的分类
- CRO提供的服务
- 外包给CRO的优势
- 外包给CRO的风险
第四章 外包指南
- 章节概述
- 生物製剂研究外包
- 外包模式
- 选择合适的外包方式模型
- 选择CRO合作伙伴
- CRO在药物研发过程中的作用
- 结论
第五章:市场概况
- 章节概述
- 生物製剂CRO:市场概况
- 临床前生物製剂CRO
- 临床生物製剂CRO
第六章:公司简介
- 章节概述
- 百康
- 科文斯
- ICON
- Medpace
- Pharmaron
- PPD
- PRA Health Sciences
- Syneos 健康
- Vimta Labs
- WuXi AppTec
第七章:基准分析
- 章节概述
- 研究方法
- 基准分析:同业群体
第八章:合作与伙伴关係
- 章节概述
- 合作模式
- 生物製剂CRO:近期合作与伙伴关係
第九章:併购与收购
第十章:吸引力与竞争力矩阵
- 章节概述
- AC矩阵:概述
- 分析与研究方法
- AC矩阵:北美合约生产场景
- AC矩阵:欧洲合约生产场景
- AC矩阵:亚太及中东合约生产场景
第十一章:市场预测
- 章节概述
- 预测、研究方法及关键假设
- 全球生物製剂CRO市场
- 北美生物製剂CRO市场
- 欧洲生物製剂CRO服务市场
- 亚太地区生物製剂CRO服务市场
- 拉丁美洲生物製剂CRO服务市场
- 北美生物製剂CRO 服务市场
第十二章:SWOT 分析
第十三章:结论
第十四章:研究笔记
第十五章,附录一:表格资料
第十六章,附录二:公司与机构列表
Biologics Contract Research Organization Market: Overview
As per Roots Analysis, the global biologics contract research organization market valued at USD 36 billion in the current year and is anticipated to reach USD 126 billion by 2035, growing at a lucrative CAGR of 13% during the forecast period.
The market sizing and opportunity analysis has been segmented across the following parameters:
Type of Biologic
- Vaccines
- Cell Therapy
- Gene Therapy
- Antibodies
- Recombinant Proteins / Peptides
- Others
Scale of Operation
- Clinical Operations
- Preclinical Operations
Therapeutic Area
- Oncological Disorders
- Cardiovascular Disorders
- Inflammatory Disorders
- Neurological Disorders
- Other Therapeutic Areas
Geography
- North America
- Europe
- Asia-Pacific
- Latin America
- Middle East and North Africa
- Rest of the World
Biologics Contract Research Organization Market: Growth and Trends
Biologics are among the fastest expanding sectors within the pharmaceutical industry. This
can be linked to the swift advancement in this area, fueled by the demand for efficient and tailored pharmacological solutions. The increased need for biologics including monoclonal antibodies, gene therapies, and cell therapies is driven by their success in addressing chronic and complex ailments such as cancer, autoimmune diseases, and neurological disorders. This need is intensified by an expanding biologics pipeline and elevated approval rates. Nonetheless, the development and clinical evaluation of biologics is a very intricate and expensive procedure that requires specialized knowledge and cutting-edge bioprocessing technologies. Consequently, numerous biopharmaceutical firms are opting to delegate their drug discovery and clinical research activities.
At present, biopharmaceutical firms are adopting a business model wherein development processes are contracted to external service providers, while the firm itself oversees the R&D of these biologics. The biologics contract research organization sector is experiencing growth fueled by the rising research on innovative medications and illnesses. R&D of biologics is labor-intensive and pharmaceutical companies need significant technological knowledge and specialized expertise, which increases the overall expense of drugs. Moreover, strict regulatory standards and the approval process can delay the approval of drugs, resulting in a drug supply shortfall in the market.
To simplify these intricate processes and address related challenges, leading pharmaceutical companies are progressively delegating their biologics research and development efforts to specialized contract research organizations (CROs). This strategic outsourcing enables them to utilize external knowledge, speed up drug discovery and clinical trials, and ultimately launch innovative biologics to market more effectively. In addition, the integration of AI can speed up drug discovery, enhance clinical trials (such as patient recruitment), and boost manufacturing yields. The domain presents numerous opportunities in implementing automation for bioprocessing and decentralized / virtual clinical trials, which lower expenses and improve data quality. As a result, the biologics contract research organization market is expected to grow steadily to meet the increasing R&D needs of biopharmaceutical sponsors.
Biologics Contract Research Organization Market: Key Insights
The report delves into the current state of the biologics contract research organization market and identifies potential growth opportunities within industry. Some key findings from the report include:
- Presently, 160 players claim to have the necessary capabilities to offer contract research services and clinical trial support for different types of biopharmaceutical products.
- About 50% of all the players offer only clinical services; of these, 12% CROs provide all the services associated with clinical research of biologics.
- The current market landscape is fragmented, featuring a mix of well-established players and specialty service providers, having extensive portfolios to support preclinical and clinical research.
- It is estimated that big pharma players presently outsource close to 45% of their internal R&D operations to CROs.
- More than two-thirds of the contract research service providers are based in North America and Europe; most of these players are small and mid-sized companies.
- In order to gain a competitive edge, companies are actively expanding their existing capabilities in order to further augment their respective offerings and also comply with evolving industry benchmarks.
- Over 8,000 product candidates are currently being evaluated / under development biologic drug developers, presenting opportunities in the biologics contract research organization market.
- The growing interest of stakeholders in this field is also reflected in the increase in partnership activity in the recent past; since 2016, industry players have signed multiple deals with sponsor and / or other CROs.
- Close to 20% of the CROs provide research services for biologics at the clinical and preclinical scales.
- With the rising demand for one-stop shops, industry stakeholders are actively consolidating their capabilities related to biopharmaceutical research, mostly through mergers and acquisitions, and internal expansions.
- The market is expected to grow at a CAGR of ~13% in the coming decade; the opportunity is likely to be well distributed across therapeutic areas, scales of operation, types of biologics, end users and geographical regions.
Biologics Contract Research Organization Market: Key Segments
Clinical Segment is Likely to Hold the Highest Share in the Biologics Contract Research Organization Market
In terms of the scale of operation, the global market for biologics contract research organization market is segmented into discovery, preclinical and clinical. Currently, majority share of the share is captured by clinical scale of operation, followed by preclinical and discovery segments.
North America is Anticipated to Capture the Maximum Biologics Contract Research Organization Market Share
In terms of geographical regions, the global market is segmented into North America, Europe and Asia-Pacific. Amongst these, North America is likely to capture majority (50%) of the market share, followed by Europe (32%) and Asia-Pacific (16%).
Example Players in the Biologics Contract Research Organization Market
- Biocon
- Covance
- ICON
- Medpace
- Pharmaron
- PPD
- PRA Health Sciences
- Syneos Health
- Vimta Labs
- WuXi AppTec
Biologics Contract Research Organization Market: Research Coverage
- Market Sizing and Opportunity Analysis: The report features an in-depth analysis of the global biologics contract research organization market, focusing on key market segments, including [A] type of biologic, [B] scale of operation, [C] therapeutic area and [D] geography.
- Market Landscape: A comprehensive evaluation of the biopharmaceutical services market, based on several relevant parameters, such as [A] year of establishment, [B] company size, [C] location of headquarters, [D] types of biologics manufactured, [E] scale of operation and [F] types of services offered (including clinical services and preclinical services).
- Company Profiles: In-depth profiles of CROs engaged in offering biopharmaceutical related services, focusing on [A] overview of the company, [B] financial information (if available), [C] service portfolio and [D] recent developments and an informed future outlook.
- Benchmarking Analysis: A comprehensive benchmark analysis of players engaged in biologics contract research organization market based on the [A] capabilities of companies within a peer group with an aim to gain a competitive edge.
- Partnerships and Collaborations: An insightful analysis of the deals inked by stakeholders in the biologics contract research organization market, based on several parameters, such as [A] year of partnership, [B] type of partnership, [C] most active players (in terms of number of partnerships signed), [D] scale of operation and [E] geography.
- Mergers and Acquisitions: An in-depth analysis of the mergers and acquisitions undertaken in this domain, based on relevant parameters, such as [A] year of acquisition, [B] type of collaboration, [C] geography, [D] most active acquirers, [E] ownership change matrix, [F] key value drivers and [G] acquisition deal multiples.
- Attractiveness Competitiveness Matrix: A comprehensive acquisition target analysis, considering the historical trend of the activity of companies that have acquired other firms since 2016, and providing a means for other industry players to identify potential acquisition targets.
- SWOT Analysis: An analysis of industry affiliated trends, opportunities and challenges, which are likely to impact the evolution of biologics contract research organization market; it includes a Harvey ball analysis, assessing the relative impact of each SWOT parameter on industry dynamics.
Key Questions Answered in this Report
- How many companies are currently engaged in this market?
- Which are the leading companies in this market?
- What factors are likely to influence the evolution of this market?
- What is the current and future market size?
- What is the CAGR of this market?
- How is the current and future market opportunity likely to be distributed across key market segments?
Reasons to Buy this Report
- The report provides a comprehensive market analysis, offering detailed revenue projections of the overall market and its specific sub-segments. This information is valuable to both established market leaders and emerging entrants.
- Stakeholders can leverage the report to gain a deeper understanding of the competitive dynamics within the market. By analyzing the competitive landscape, businesses can make informed decisions to optimize their market positioning and develop effective go-to-market strategies.
- The report offers stakeholders a comprehensive overview of the market, including key drivers, barriers, opportunities, and challenges. This information empowers stakeholders to stay abreast of market trends and make data-driven decisions to capitalize on growth prospects.
Additional Benefits
- Complimentary PPT Insights Packs
- Complimentary Excel Data Packs for all Analytical Modules in the Report
- 15% Free Content Customization
- Detailed Report Walkthrough Session with Research Team
- Free Updated report if the report is 6-12 months old or older
TABLE OF CONTENTS
1. PREFACE
- 1.1. Scope of the Report
- 1.2. Research Methodology
- 1.2.1. Research Assumptions
- 1.2.2. Project Methodology
- 1.2.3. Forecast Methodology
- 1.2.4. Robust Quality Control
- 1.2.5. Key Considerations
- 1.2.5.1. Demographics
- 1.2.5.2. Economic Factors
- 1.2.5.3. Government Regulations
- 1.2.5.4. Supply Chain
- 1.2.5.5. COVID Impact / Related Factors
- 1.2.5.6. Market Access
- 1.2.5.7. Healthcare Policies
- 1.2.5.8. Industry Consolidation
- 1.3 Key Questions Answered
- 1.4. Chapter Outlines
2. EXECUTIVE SUMMARY
3. INTRODUCTION
3 Introduction
- 3.1. Chapter Overview
- 3.2. Overview of Biologics
- 3.2.1. Types of Biologics
- 3.3. Overview of Contract Research Organizations (CROs)
- 3.4. Evolution of CROs
- 3.5. Classification of CROs
- 3.6. Services Offered by CROs
- 3.7. Advantages of Outsourcing Operations to CROs
- 3.8. Risks Associated with Outsourcing Operations to CROs
4. GUIDE TO OUTSOURCING
- 4.1. Chapter Overview
- 4.2. Outsourcing Biologics Research
- 4.3. Models of Outsourcing
- 4.3.1. Transactional Outsourcing Model
- 4.3.2. Performance / Outcome-based Business Model
- 4.3.3. Staff Augmentation Model
- 4.3.4. Phase-Dependent Outsourcing Model
- 4.4. Selecting an Appropriate Outsourcing Model
- 4.4.1. Hybrid Approach
- 4.5. Selecting a CRO Partner
- 4.5.1. Key Considerations for Outsourcing Biologics-related Operations
- 4.6. Role of CROs in the Drug Development Process
- 4.6.1. Discovery and Preclinical Research
- 4.6.2. Early Clinical Research
- 4.6.3. Clinical Research and Laboratory Services
- 4.7. Conclusion
5. MARKET LANDSCAPE
- 5.1. Chapter Overview
- 5.2. Biopharmaceutical CROs: Overall Market Landscape
- 5.2.1. Analysis by Year of Establishment, Company Size and Location of Headquarters
- 5.2.2. Analysis by Scale of Operation
- 5.3. Preclinical Biopharmaceutical CROs
- 5.3.1. Analysis by Year of Establishment
- 5.3.2. Analysis by Company Size
- 5.3.3. Analysis by Location of Headquarters
- 5.3.4. Analysis by Type of Biologic
- 5.3.5. Analysis by Type of Services Offered
- 5.4. Clinical Biopharmaceutical CROs
- 5.4.1. Analysis by Year of Establishment
- 5.4.2. Analysis by Company Size
- 5.4.3. Analysis by Location of Headquarters
- 5.4.4. Analysis by Type of Biologics
- 5.4.5. Analysis by Type of Services Offered
6. COMPANY PROFILES
- 6.1. Chapter Overview
- 6.2. Biocon
- 6.2.1. Company Overview
- 6.2.2. Financial Information
- 6.2.3. Services Portfolio
- 6.2.4. Future Outlook
- 6.3. Covance
- 6.3.1. Company Overview
- 6.3.2. Service Portfolio
- 6.3.3. Financial Information
- 6.3.4. Future Outlook
- 6.4. ICON
- 6.4.1. Company Overview
- 6.4.2. Financial Information
- 6.4.3. Service Portfolio
- 6.4.4. Future Outlook
- 6.5. Medpace
- 6.5.1. Company Overview
- 6.5.2. Financial Information
- 6.5.3. Service Portfolio
- 6.5.4. Future Outlook
- 6.6. Pharmaron
- 6.6.1. Company Overview
- 6.6.2. Services Portfolio
- 6.6.3. Future Outlook
- 6.7. PPD
- 6.7.1. Company Overview
- 6.7.2. Service Portfolio
- 6.7.3. Financial Information
- 6.7.4. Future Outlook
- 6.8. PRA Health Sciences
- 6.8.1. Company Overview
- 6.8.2. Financial Information
- 6.8.3. Service Portfolio
- 6.8.4. Future Outlook
- 6.9. Syneos Health
- 6.9.1. Company Overview
- 6.9.2. Financial Information
- 6.9.3. Services Portfolio
- 6.9.4. Future Outlook
- 6.10. Vimta Labs
- 6.10.1. Company Overview
- 6.10.2. Services Portfolio
- 6.10.3. Financial Information
- 6.10.4. Future Outlook
- 6.11. WuXi AppTec
- 6.11.1. Company Overview
- 6.11.2. Financial Information
- 6.11.3. Service Portfolio
- 6.11.4. Future Outlook
7. BENCHMARK ANALYSIS
- 7.1. Chapter Overview
- 7.2. Methodology
- 7.3. Benchmark Analysis: Peer Groups
- 7.3.1. Peer Group I
- 7.3.2. Peer Group II
- 7.3.3. Peer Group III
- 7.3.4. Peer Group IV
- 7.3.5. Peer Group V
- 7.3.6. Peer Group VI
- 7.3.7. Peer Group VII
- 7.3.8. Peer Group VIII
8. PARTNERSHIPS AND COLLABORATIONS
- 8.1. Chapter Overview
- 8.2. Partnership Models
- 8.3. Biopharmaceutical CROs: Recent Partnerships and Collaborations
- 8.3.1. Analysis by Year of Partnership
- 8.3.2. Analysis by Type of Partnership Model
- 8.3.2.1. Analysis by Year of Partnership and Type of Partnership Model
- 8.3.3. Most Active Players: Analysis by Number of Partnerships
- 8.3.4. Analysis by Scale of Operation
- 8.3.5. Analysis by Geography
- 8.3.5.1. Country-wise Analysis
- 8.3.5.2. Intercontinental and Intracontinental Agreements
9. MERGERS AND ACQUISITIONS
- 9.1. Chapter Overview
- 9.2. Merger and Acquisition Models
- 9.3. Biopharmaceutical CROs: Mergers and Acquisitions
- 9.3.1. Analysis by Year of Acquisition
- 9.3.2. Analysis by Type of Collaboration
- 9.3.3. Analysis by Geography
- 9.3.3.1. Continent-wise Distribution
- 9.3.3.2. Country-wise Distribution
- 9.3.4. Ownership Change Matrix
- 9.3.5. Most Active Acquirers: Analysis by Number of Acquisitions
- 9.4. Distribution by Key Value Drivers
- 9.4.1. Analysis by Key Value Drivers
- 9.4.2. Analysis by Key Value Drivers and Year of Acquisitions
- 9.5. Valuation Analysis: Acquisition Deal Multiples
10. ATTRACTIVENESS COMPETATIVENESS MATRIX
- 10.1. Chapter Overview
- 10.2. AC Matrix: Overview
- 10.2.1. Strong Business Segment
- 10.2.2. Average Business Segment
- 10.2.3. Weak Business Segment
- 10.3. Analytical Methodology
- 10.4. AC Matrix: Contract Manufacturing Scenario in North America
- 10.5. AC Matrix: Contract Manufacturing Scenario in Europe
- 10.6. AC Matrix: Contract Manufacturing Scenario in Asia Pacific and Middle East
11. MARKET FORECAST
- 11.1. Chapter Overview
- 11.2. Forecast Methodology and Key Assumptions
- 11.3. Global Biopharmaceutical CROs Market
- 11.3.1. Global Biopharmaceutical CROs Market: Distribution by Types of Biologics
- 11.3.2. Global Biopharmaceutical CROs Market: Distribution by Therapeutic Area
- 11.3.3. Global Biopharmaceutical CROs Market: Distribution by Scale of Operation
- 11.3.4. Global Biopharmaceutical CROs Market: Distribution by Geography
- 11.4. Biopharmaceutical CROs Market in North America
- 11.4.1. Biopharmaceutical CROs Market in North America: Distribution by Therapeutic Area
- 11.4.1.1. Biopharmaceutical CROs Market for Oncological Disorders in North America, Till 2035
- 11.4.1.2. Biopharmaceutical CROs Market for Cardiovascular Disorders in North America, Till 2035
- 11.4.1.3. Biopharmaceutical CROs Market for Inflammatory Disorders in North America, Till 2035
- 11.4.1.4. Biopharmaceutical CROs Market for Neurological Disorders in North America, Till 2035
- 11.4.1.5. Biopharmaceutical CROs Market for Other Therapeutic Areas in North America, Till 2035
- 11.4.2. Biopharmaceutical CROs Market in North America: Distribution by Scale of Operation
- 11.4.2.1. Biopharmaceutical CROs Market for Preclinical Operations in North America, Till 2035
- 11.4.2.2. Biopharmaceutical CROs Market for Clinical Operations in North America, Till 2035
- 11.4.1. Biopharmaceutical CROs Market in North America: Distribution by Therapeutic Area
- 11.5. Biopharmaceutical CRO Services Market in Europe
- 11.5.1. Biopharmaceutical CRO Services Market: Distribution by Therapeutic Area in Europe
- 11.5.1.1. Biopharmaceutical CRO Services Market for Oncological Disorders in Europe, Till 2035
- 11.5.1.2. Biopharmaceutical CRO Services Market for Cardiovascular Disorders in Europe, Till 2035
- 11.5.1.3. Biopharmaceutical CRO Services Market for Inflammatory Disorders in Europe, Till 2035
- 11.5.1.4. Biopharmaceutical CRO Services Market for Neurological Disorders in Europe, Till 2035
- 11.5.1.5. Biopharmaceutical CRO Services Market for Other Therapeutic Areas in Europe, Till 2035
- 11.5.2. Biopharmaceutical CRO Services Market: Distribution by Scale of Operation in Europe
- 11.5.2.1. Biopharmaceutical CRO Services Market for Preclinical Operations in Europe, Till 2035
- 11.5.2.2. Biopharmaceutical CRO Services Market for Clinical Operations in Europe, Till 2035
- 11.5.1. Biopharmaceutical CRO Services Market: Distribution by Therapeutic Area in Europe
- 11.6. Biopharmaceutical CRO Services Market in Asia-Pacific
- 11.6.1. Biopharmaceutical CRO Services Market: Distribution by Therapeutic Area in Asia-Pacific
- 11.6.1.1. Biopharmaceutical CRO Services Market for Oncological Disorders in Asia-Pacific, Till 2035
- 11.6.1.2. Biopharmaceutical CRO Services Market for Cardiovascular Disorders in Asia-Pacific, Till 2035
- 11.6.1.3. Biopharmaceutical CRO Services Market for Inflammatory Disorders in Asia-Pacific, Till 2035
- 11.6.1.4. Biopharmaceutical CRO Services Market for Neurological Disorders in Asia-Pacific, Till 2035
- 11.6.1.5. Biopharmaceutical CRO Services Market for Other Therapeutic Areas in Asia-Pacific, Till 2035
- 11.6.2. Biopharmaceutical CRO Services Market: Distribution by Scale of Operation in Asia-Pacific
- 11.6.2.1. Biopharmaceutical CRO Services Market for Preclinical Operations in Asia-Pacific, Till 2035
- 11.6.2.2. Biopharmaceutical CRO Services Market for Clinical Operations in Asia-Pacific, Till 2035
- 11.6.1. Biopharmaceutical CRO Services Market: Distribution by Therapeutic Area in Asia-Pacific
- 11.7. Biopharmaceutical CRO Services Market in Latin America
- 11.8. Biopharmaceutical CRO Services Market in Middle East North America
12. SWOT ANALYSIS
- 12.1. Chapter Overview
- 12.2. Strengths
- 12.3. Weaknesses
- 12.4. Opportunities
- 12.5. Threats
- 12.6. Comparison of SWOT Factors
13. CONCLUDING REMARKS
- 13.1. Chapter Overview
14. SURVEY TRANSCRIPTS
15. APPENDIX I: TABULATED DATA
16. APPENDIX II: LIST OF COMPANIES AND ORGANIZATIONS
List of Tables
- Table 4.1 Attributes of Transactional Outsourcing Based Business Model
- Table 4.2 Comparison of Key Factors Considered by Biologic Developers for Selecting a CRO Partner: Harvey Ball Analysis
- Table 5.1 Biopharmaceutical CROs: Information on Year of Establishment, Location of Headquarters, Company Size and Types of Biologics
- Table 5.2 Biopharmaceutical Preclinical CROs: Information on Types of Services Offered
- Table 5.3 Biopharmaceutical Clinical CROs: Information on Types of Services Offered
- Table 6.1 Biocon: Company Overview
- Table 6.2 Biocon: Future Outlook
- Table 6.3 Covance: Company Overview
- Table 6.4 Covance: Future Outlook
- Table 6.5 ICON: Company Overview
- Table 6.6 ICON: Future Outlook
- Table 6.7 Medpace: Company Overview
- Table 6.8 Medpace: Future Outlook
- Table 6.9 Pharmaron: Company Overview
- Table 6.10 Pharmaron: Future Outlook
- Table 6.11 PPD: Company Overview
- Table 6.12 PPD: Future Outlook
- Table 6.13 PRA Health Sciences: Company Overview
- Table 6.14 PRA Health Sciences: Future Outlook
- Table 6.15 Syneos Health: Company Overview
- Table 6.16 Syneos Health: Future Outlook
- Table 6.17 VIMTA Labs: Company Overview
- Table 6.18 WuXi App-Tec: Company Overview
- Table 6.19 WuXi App Tec: Future Outlook
- Table 7.1 Benchmark Analysis: Peer Groups
- Table 8.1 Partnerships and Collaborations: List of Agreements, Since 2016
- Table 9.1 Mergers and Acquisitions: List of Mergers / Acquisitions, Since 2016
- Table 9.2 Mergers and Acquisitions: Information on Key Value Drivers, Since 2016
- Table 9.3 Mergers and Acquisitions: Deal Multiples, Since 2016
- Table 15.1 Biopharmaceutical CROs: Distribution by Year of Establishment, Company Size and Location of Headquarters
- Table 15.2 Biopharmaceutical CROs: Distribution by Scale of Operation
- Table 15.3 Biopharmaceutical Preclinical CROs: Distribution by Year of Establishment
- Table 15.4 Biopharmaceutical Preclinical CROs: Distribution by Company Size
- Table 15.5 Biopharmaceutical Preclinical CROs Distribution by Location of Headquarters
- Table 15.6 Biopharmaceutical Preclinical CROs: Distribution by Types of Biologics
- Table 15.8 Biopharmaceutical Preclinical CROs: Distribution by Types of Services Offered
- Table 15.9 Biopharmaceutical Preclinical CROs: Distribution by Number of Services Offered
- Table 15.10 Biopharmaceutical Preclinical CROs: Distribution by Types of Biologics and Types Services Offered
- Table 15.11 Biopharmaceutical Clinical CROs: Distribution by Year of Establishment
- Table 15.12 Biopharmaceutical Clinical CROs: Distribution by Company Size
- Table 15.13 Biopharmaceutical Clinical CROs: Distribution by Location of Headquarters
- Table 15.14 Biopharmaceutical Clinical CROs: Distribution by Types of Biologics
- Table 15.15 Biopharmaceutical Clinical CROs: Distribution by Types of Services Offered
- Table 15.16 Biopharmaceutical Clinical CROs: Distribution by Number of Services Offered
- Table 15.17 Biopharmaceutical Clinical CROs: Distribution by Types of Biologics and Types of Services Offered
- Table 15.18 Biocon: Annual Service Revenues, Since 2016 (INR Billion)
- Table 15.19 Covance: Annual Service Revenues, Since 2016 (USD Billion)
- Table 15.20 ICON: Annual Revenues, Since 2016 (USD Billion)
- Table 15.21 Medpace: Annual Service Revenues, Since 2016 (USD Billion)
- Table 15.22 PPD: Annual Service Revenues, Since 2016 (USD Billion)
- Table 15.23 PRA Health Sciences: Annual Revenues, Since 2016 (USD Billion)
- Table 15.24 Syneos: Annual Service Revenues, Since 2016 (USD Billion)
- Table 15.25 Vimta Labs: Annual Service Revenues, Since 2016 (INR Billion)
- Table 15.26 WuXi AppTec: Annual Service Revenues, Since 2016 (USD Billion)
- Table 15.27 Partnerships and Collaborations: Distribution by Year of Partnership
- Table 15.28 Partnerships and Collaborations: Distribution by Type of Partnership Model
- Table 15.29 Partnerships and Collaborations: Distribution by Year of Partnership and Type of Partnership Model
- Table 15.30 Most Active Players: Distribution by Number of Partnerships
- Table 15.31 Partnerships and Collaborations: Distribution by Scale of Operation
- Table 15.32 Partnerships and Collaborations: Distribution by Geography
- Table 15.33 Partnerships and Collaborations: Country-Wise Distribution
- Table 15.34 Partnerships and Collaborations: Intercontinental and Intracontinental Agreements
- Table 15.35 Mergers and Acquisitions: Distribution by Year of Merger / Acquisition (Since 2016)
- Table 15.36 Mergers and Acquisitions: Distribution by Type of Merger / Acquisition
- Table 15.37 Mergers and Acquisitions: Distribution by Year and Type of Agreement
- Table 15.38 Mergers and Acquisitions: Continent-wise Distribution
- Table 15.39 Mergers and Acquisitions: Continent-wise Distribution
- Table 15.40 Mergers and Acquisitions: Country-wise Distribution
- Table 15.41 Mergers and Acquisitions: Ownership Change Matrix
- Table 15.42 Mergers and Acquisitions: Key Value Drivers
- Table 15.43 Mergers and Acquisitions: Distribution by Year of Acquisition and Key Value Drivers
- Table 15.44 Mergers and Acquisitions: Deal Multiples Based on Revenue
- Table 15.45 Mergers and Acquisitions: Deal Multiples Based on Year of Experience
- Table 15.46 Global Biopharmaceutical CROs Market: Distribution by Types of Biologics
- Table 15.47 Global Biopharmaceutical CROs Market: Distribution by Therapeutic Area
- Table 15.48 Global Biopharmaceutical CROs Market: Distribution by Scale of Operation
- Table 15.49 Global Biopharmaceutical CROs Market: Distribution by Geography
- Table 15.50 Biopharmaceutical CROs Market in North America, Conservative, Base and Optimistic Scenarios, Till 2035 (USD Million)
- Table 15.51 Biopharmaceutical CROs Market for Oncological Disorders in North America, Conservative, Base and Optimistic Scenarios, Till 2035 (USD Million)
- Table 15.52 Biopharmaceutical CROs Market for Cardiovascular Disorders in North America, Conservative, Base and Optimistic Scenarios, Till 2035 (USD Million)
- Table 15.53 Biopharmaceutical CROs Market for Inflammatory Disorders in North America, Conservative, Base and Optimistic Scenarios, Till 2035 (USD Million)
- Table 15.54 Biopharmaceutical CROs Market for Neurological Disorders in North America, Conservative, Base and Optimistic Scenarios, Till 2035 (USD Million)
- Table 15.55 Biopharmaceutical CROs Market for Other Therapeutic Areas in North America, Conservative, Base and Optimistic Scenarios, Till 2035 (USD Million)
- Table 15.56 Biopharmaceutical CROs Market for Preclinical Operations in North America, Conservative, Base and Optimistic Scenarios, Till 2035 (USD Million)
- Table 15.57 Biopharmaceutical CROs Market for Clinical Operations in North America, Conservative, Base and Optimistic Scenarios, Till 2035 (USD Million)
- Table 15.58 Biopharmaceutical CROs Market in Europe, Till 2035 (USD Million)
- Table 15.59 Biopharmaceutical CROs Market for Oncological Disorders in Europe, Conservative, Base and Optimistic Scenarios, Till 2035 (USD Million)
- Table 15.60 Biopharmaceutical CROs Market for Cardiovascular Disorders in Europe, Till 2035 (USD Million)
- Table 15.61 Biopharmaceutical CROs Market for Inflammatory Disorders in Europe, Conservative, Base and Optimistic Scenarios, Till 2035 (USD Million)
- Table 15.62 Biopharmaceutical CROs Market for Neurological Disorders in Europe, Conservative, Base and Optimistic Scenarios, Till 2035 (USD Million)
- Table 15.63 Biopharmaceutical CROs Market for Other Therapeutic Areas in Europe, Conservative, Base and Optimistic Scenarios, Till 2035 (USD Million)
- Table 15.64 Biopharmaceutical CROs Market for Preclinical Operations in Europe, Conservative, Base and Optimistic Scenarios, Till 2035 (USD Million)
- Table 15.65 Biopharmaceutical CROs Market for Clinical Operations in Europe, Conservative, Base and Optimistic Scenarios, Till 2035 (USD Million)
- Table 15.66 Biopharmaceutical CROs Market in Asia-Pacific, Conservative, Base and Optimistic Scenarios, Till 2035 (USD Million)
- Table 15.67 Biopharmaceutical CROs Market for Oncological Disorders in Asia-Pacific, Conservative, Base and Optimistic Scenarios, Till 2035 (USD Million)
- Table 15.68 Biopharmaceutical CROs Market for Cardiovascular Disorders in Asia-Pacific, Conservative, Base and Optimistic Scenarios, Till 2035 (USD Million)
- Table 15.69 Biopharmaceutical CROs Market for Inflammatory Disorders in Asia-Pacific, Conservative, Base and Optimistic Scenarios, Till 2035 (USD Million)
- Table 15.70 Biopharmaceutical CROs Market for Neurological Disorders in Asia-Pacific, Conservative, Base and Optimistic Scenarios, Till 2035 (USD Million)
- Table 15.71 Biopharmaceutical CROs Market for Other Therapeutic Areas in Asia-Pacific, Conservative, Base and Optimistic Scenarios, Till 2035 (USD Million)
- Table 15.72 Biopharmaceutical CROs Market for Preclinical Operations in Asia-Pacific, Conservative, Base and Optimistic Scenarios, Till 2035 (USD Million)
- Table 15.73 Biopharmaceutical CROs Market for Clinical Operations in Asia-Pacific, Conservative, Base and Optimistic Scenarios, Till 2035 (USD Million)
- Table 15.74 Biopharmaceutical CROs Market for Preclinical Operations in Latin America, Conservative, Base and Optimistic Scenarios, Till 2035 (USD Million)
- Table 15.75 Biopharmaceutical CROs Market for Preclinical Operations in Middle East North Africa, Conservative, Base and Optimistic Scenarios, Till 2035 (USD Million)
- Table 15.76 Biopharmaceutical CROs Market: Conservative, Base and Optimistic Scenarios (USD Million)
List of Figures
- Figure 3.1 Types of Biologics
- Figure 3.2 Stages of the Drug Development Process
- Figure 3.3 Commonly Offered Services by CROs
- Figure 3.4 Advantages of Outsourcing Operations to CROs
- Figure 3.5 Risks Associated with Outsourcing Operations to CROs
- Figure 4.1 Guiding Models for Outsourcing
- Figure 4.2 Key Characteristics of Transactional Outsourcing Model
- Figure 4.3 Key Characteristics of Performance / Outcome based Business Model
- Figure 4.4 Steps to Consider before Outsourcing
- Figure 4.5 Key Considerations while Selecting a CRO Partner
- Figure 4.6 Role of CROs in the Drug Development Process
- Figure 5.1 Biopharmaceutical CROs: Distribution by Year of Establishment, Company Size and Location of Headquarters
- Figure 5.2 Biopharmaceutical CROs: Distribution by Scale of Operation
- Figure 5.3 Biopharmaceutical Preclinical CROs: Distribution by Year of Establishment
- Figure 5.4 Biopharmaceutical Preclinical CROs: Distribution by Company Size
- Figure 5.5 Biopharmaceutical Preclinical CROs Distribution by Location of Headquarters
- Figure 5.6 Biopharmaceutical Preclinical CROs: Distribution by Types of Biologics
- Figure 5.7 Biopharmaceutical Preclinical CROs: Distribution by Types of Services Offered
- Figure 5.8 Biopharmaceutical Preclinical CROs: Distribution by Number of Services Offered
- Figure 5.9 Biopharmaceutical Preclinical CROs: Distribution by Types of Biologics and Types of Services Offered
- Figure 5.10 Biopharmaceutical Clinical CROs: Distribution by Year of Establishment
- Figure 5.11 Biopharmaceutical Clinical CROs: Distribution by Company Size
- Figure 5.12 Biopharmaceutical Clinical CROs: Distribution by Location of Headquarters
- Figure 5.13 Biopharmaceutical Clinical CROs: Distribution by Types of Biologics
- Figure 5.14 Biopharmaceutical Clinical CROs: Distribution by Types of Services Offered
- Figure 5.15 Biopharmaceutical Clinical CROs: Distribution by Number of Services Offered
- Figure 5.16 Biopharmaceutical Clinical CROs: Distribution by Types of Biologics and Types of Services Offered
- Figure 6.1 Biocon: Annual Services Revenues, Since 2016 (INR Billion)
- Figure 6.2 Biocon: Service Portfolio
- Figure 6.3 Covance: Annual Services Revenues, Since 2016 (USD Billion)
- Figure 6.4 Covance: Service Portfolio
- Figure 6.5 ICON: Annual Revenues, Since 2016 (USD Billion)
- Figure 6.6 ICON: Service Portfolio
- Figure 6.7 Medpace: Annual Services Revenues, Since 2016 (USD Billion)
- Figure 6.8 Medpace: Service Portfolio
- Figure 6.9 Medpace: Regulatory Affair Capabilities
- Figure 6.10 Pharmaron: Service Portfolio
- Figure 6.11 PPD: Annual Services Revenues, Since 2016 (USD Billion)
- Figure 6.12 PPD: Service Portfolio
- Figure 6.13 PRA Health Sciences: Annual Revenues, Since 2016 (USD Billion)
- Figure 6.14 PRA Health Sciences: Service Portfolio
- Figure 6.15 Syneos Health: Annual Services Revenues, Since 2016 (USD Billion)
- Figure 6.16 Syneos Health: Service Portfolio
- Figure 6.17 Vimta Labs: Annual Service Revenues, Since 2016 (INR Billion)
- Figure 6.18 Vimta Labs: Service Portfolio
- Figure 6.19 WuXi App Tec: Annual Services Revenues, Since 2016 (USD Billion)
- Figure 6.20 WuXi App Tec: Service Portfolio
- Figure 7.1 Benchmark Analysis: Distribution by Company Size and Location of Headquarters
- Figure 7.2 Benchmark Analysis: Peer Group I
- Figure 7.3 Benchmark Analysis: Peer Group II
- Figure 7.4 Benchmark Analysis: Peer Group III
- Figure 7.5 Benchmark Analysis: Peer Group IV
- Figure 7.6 Benchmark Analysis: Peer Group V
- Figure 7.7 Benchmark Analysis: Peer Group VI
- Figure 7.8 Benchmark Analysis: Peer Group VII
- Figure 7.9 Benchmark Analysis: Peer Group VIII
- Figure 8.1 Partnerships and Collaborations: Distribution by Year of Partnership
- Figure 8.2 Partnerships and Collaborations: Distribution by Type of Partnership Model
- Figure 8.3 Partnerships and Collaborations: Distribution by Year of Partnership and Type of Partnership Model
- Figure 8.4 Most Active Players: Distribution by Number of Partnerships
- Figure 8.5 Partnerships and Collaborations: Distribution by Scale of Operation
- Figure 8.6 Partnerships and Collaborations: Distribution by Geography
- Figure 8.7 Partnerships and Collaborations: Country-Wise Distribution
- Figure 8.8 Partnerships and Collaborations: Intercontinental and Intracontinental Agreements
- Figure 9.1 Mergers and Acquisitions: Distribution by Year of Merger / Acquisition (Since 2016)
- Figure 9.2 Mergers and Acquisitions: Distribution by Type of Merger / Acquisition
- Figure 9.3 Mergers and Acquisitions: Distribution by Year and Type of Merger / Acquisition
- Figure 9.4 Mergers and Acquisitions: Continent-wise Distribution
- Figure 9.5 Mergers and Acquisitions: Region-wise Distribution
- Figure 9.6 Mergers and Acquisitions: Country-wise Distribution
- Figure 9.7 Mergers and Acquisitions: Ownership Change Matrix
- Figure 9.8 Mergers and Acquisitions: Key Value Drivers
- Figure 9.9 Mergers and Acquisitions: Distribution by Year of Acquisition and Key Value Drivers
- Figure 9.10 Mergers and Acquisitions: Deal Multiples Based on Revenue
- Figure 9.11 Mergers and Acquisitions: Deal Multiples Based on Year of Experience
- Figure 10.1. AC Matrix: Pictorial Representation
- Figure 10.2. AC Matrix: Positioning of Different Biologics in North America
- Figure 10.3. AC Matrix: Positioning of Different Biologics in Europe
- Figure 10.4. AC Matrix: Positioning of Different Biologics in Asia Pacific
- Figure 11.1 Biopharmaceutical CROs: Market Forecast Methodology
- Figure 11.2 Global Biopharmaceutical CROs Market, Till 2035
- Figure 11.3 Global Biopharmaceutical CROs Market: Distribution by Types of Biologics
- Figure 11.4 Global Biopharmaceutical CROs Market: Distribution by Therapeutic Area
- Figure 11.5 Global Biopharmaceutical CROs Market: Distribution by Scale of Operation
- Figure 11.6 Global Biopharmaceutical CROs Market: Distribution by Geography
- Figure 11.7 Biopharmaceutical CROs Market in North America, Till 2035 (USD Million)
- Figure 11.8 Biopharmaceutical CROs Market for Oncological Disorders in North America, Till 2035 (USD Million)
- Figure 11.9 Biopharmaceutical CROs Market for Cardiovascular Disorders in North America, Till 2035 (USD Million)
- Figure 11.10 Biopharmaceutical CROs Market for Inflammatory Disorders in North America, Till 2035 (USD Million)
- Figure 11.11 Biopharmaceutical CROs Market for Neurological Disorders in North America, Till 2035 (USD Million)
- Figure 11.12 Biopharmaceutical CROs Market for Other Therapeutic Areas in North America, Till 2035 (USD Million)
- Figure 11.13 Biopharmaceutical CROs Market for Preclinical Operations in North America, Till 2035 (USD Million)
- Figure 11.14 Biopharmaceutical CROs Market for Clinical Operations in North America, Till 2035 (USD Million
- Figure 11.15 Biopharmaceutical CROs Market in Europe, Till 2035 (USD Million)
- Figure 11.16 Biopharmaceutical CROs Market for Oncological Disorders in Europe, Till 2035 (USD Million)
- Figure 11.17 Biopharmaceutical CROs Market for Cardiovascular Disorders in Europe, Till 2035 (USD Million)
- Figure 11.18 Biopharmaceutical CROs Market for Inflammatory Disorders in Europe, Till 2035 (USD Million)
- Figure 11.19 Biopharmaceutical CROs Market for Neurological Disorders in Europe, Till 2035 (USD Million)
- Figure 11.20 Biopharmaceutical CROs Market for Other Therapeutic Areas in Europe, Till 2035 (USD Million)
- Figure 11.21 Biopharmaceutical CROs Market for Preclinical Operations in Europe, Till 2035 (USD Million)
- Figure 11.22 Biopharmaceutical CROs Market for Clinical Operations in Europe, Till 2035 (USD Million)
- Figure 11.23 Biopharmaceutical CROs Market in Asia-Pacific, Till 2035 (USD Million)
- Figure 11.24 Biopharmaceutical CROs Market for Oncological Disorders in Asia-Pacific, Till 2035 (USD Million)
- Figure 11.25 Biopharmaceutical CROs Market for Cardiovascular Disorders in Asia-Pacific, Till 2035 (USD Million)
- Figure 11.26 Biopharmaceutical CROs Market for Inflammatory Disorders in Asia-Pacific, Till 2035 (USD Million)
- Figure 11.27 Biopharmaceutical CROs Market for Neurological Disorders in Asia-Pacific, Till 2035 (USD Million)
- Figure 11.28 Biopharmaceutical CROs Market for Other Therapeutic Areas in Asia-Pacific, Till 2035 (USD Million)
- Figure 11.29 Biopharmaceutical CROs Market for Preclinical Operations in Asia-Pacific, Till 2035 (USD Million)
- Figure 11.30 Biopharmaceutical CROs Market for Clinical Operations in Asia-Pacific, Till 2035 (USD Million)
- Figure 11.31 Biopharmaceutical CROs Market in Latin America, Till 2035 (USD Million)
- Figure 11.32 Biopharmaceutical CROs Market in Middle East North Africa, Till 2035 (USD Million)
- Figure 11.33 Biopharmaceutical CROs Market: Conservative, Base and Optimistic Scenarios (USD Million)
- Figure 12.1 Biopharmaceutical CROs SWOT Analysis: Overview
- Figure 12.2 Comparison of SWOT Factors: Harvey Ball Analysis
- Figure 13.1 Concluding Remarks: Current Market Landscape for Preclinical Biopharmaceutical CROs
- Figure 13.2 Concluding Remarks: Current Market Landscape for Clinical Biopharmaceutical CROs
- Figure 13.3 Concluding Remarks: Recent Partnerships
- Figure 13.4 Concluding Remarks: Mergers and Acquisitions
- Figure 13.5 Concluding Remarks: Clinical Trial Analysis
- Figure 13.6 Concluding Remarks: Market Sizing and Opportunity Analysis
 沿海和海洋生物化学解决方案市场预测至2034年—按产品类型、应用、最终用户和地区分類的全球分析
 生物製品受託研究机构(CRO) 市场分析及至 2035 年预测:按类型、产品类型、服务、技术、应用、最终用户、流程和实施类型划分
 iPS细胞衍生血小板市场报告:趋势、预测与竞争分析(至2031年)NK细胞无血清培养基试剂盒市场报告:趋势、预测与竞争分析(至2031年)
 全球生技药品CRO市场:市场规模、份额和趋势分析(按类型、产品、服务、治疗领域、最终用途和地区划分),细分市场预测(2025-2033年)生物製药受託研究机构(CRO) 市场规模、份额和趋势分析报告:按类型、产品类型、服务、治疗领域、最终用途、地区和细分市场预测 (2025-2033)标靶人源化小鼠市场报告:2031 年趋势、预测与竞争分析
 全球衣藻粉市场(按类型、纯度等级、应用、最终用户和地区):趋势分析、竞争格局和未来预测(2019-2031)低温储存设备市场分析及预测(至2034年):类型、产品、服务、技术、组件、应用、材料类型、最终用户、流程
 衣藻的全球市场(2024年)