


 |
市场调查报告书
商品编码
1920858
数位公用事业市场(至 2035 年):按组件、部署类型、网路类型、应用领域、技术类型、最终用户类型、公司规模和主要地区划分的行业趋势和全球市场预测Digital Utility Market Till 2035: Distribution by Type of Component, Type of Deployment, Type of Network, Areas of Application, Type of Technology, Type of End-User, Company Size, and Key Geographical Regions: Industry Trends and Global Forecasts |
||||||
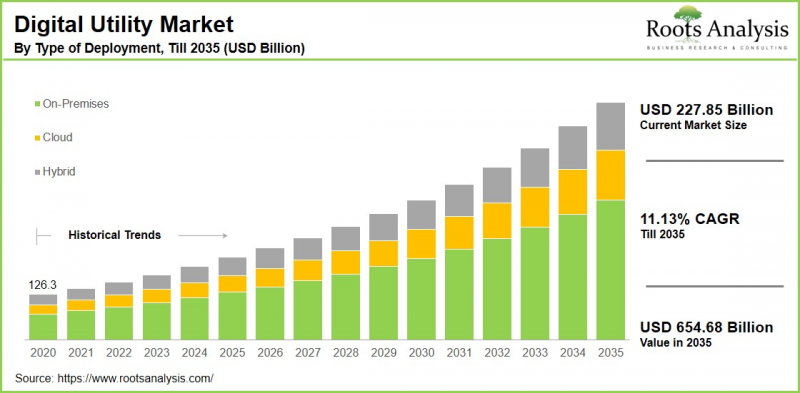
根据 Roots Analysis 的一项研究,全球数位公用事业市场预计将从目前的 2,278.5 亿美元增长到 2035 年的 6,546.8 亿美元,预测期内复合年增长率 (CAGR) 为 11.13%。
数位公用事业市场机会:分类
元件
- 硬体
- 服务
- 软体
部署类型
- 云端部署
- 混合部署
- 本地部署
网路类型
- 储能
- 能源交易
- 发电
- 零售
- 输配电
应用
- 资产管理
- 智慧电网
- 智慧计量
技术型别
- 人工智慧
- 大数据分析
- 物联网
最终使用者类型
- 商业
- 住宅
- 零售
公司规模
- 大型企业
- 中小企业
地区
- 北美洲
- 美国
- 加拿大
- 墨西哥
- 其他北美洲国家
- 欧洲
- 奥地利
- 比利时
- 丹麦
- 法国
- 德国
- 爱尔兰
- 义大利
- 荷兰
- 挪威
- 俄罗斯
- 西班牙
- 瑞典
- 瑞士
- 英国
- 其他欧洲国家国家/地区
- 亚洲
- 中国
- 印度
- 日本
- 新加坡
- 韩国
- 其他亚洲国家
- 拉丁美洲
- 巴西
- 智利
- 哥伦比亚
- 委内瑞拉
- 其他拉丁美洲国家
- 中东和北非
- 埃及
- 伊朗
- 伊拉克
- 以色列
- 科威特
- 沙乌地阿拉伯
- 阿拉伯联合大公国
- 其他中东和北非国家
- 世界其他地区
- 澳大利亚
- 纽西兰
- 其他国家/地区
数位公用事业市场:成长与趋势
数位公用事业是指将尖端技术、数据分析和通讯系统整合到传统公用事业框架中,以提高效率。可靠性和可持续性。在电力、水务和燃气领域,数位化公用事业解决方案利用智慧电錶、感测器和物联网设备收集有关使用趋势和电网运行的即时数据。这些丰富的数据使公用事业公司能够改善资源管理、快速检测问题并更好地应对需求波动。
公用事业产业正逐步采用区块链、人工智慧和机器学习等创新数位技术,以增强业务营运、客户互动和供应链内部协作。这些数位化方法能够更有效地管理能源生产和分配,提供预测性维护能力,提高安全性和效率,最终提升客户满意度。推动该行业发展的因素包括再生能源计划的成长和以能源效率为重点的政策。此外,对绿色能源的迫切需求和技术的快速进步也推动了这一发展势头。
本报告研究了全球数位化公用事业市场,并提供了市场概览、背景、市场影响因素分析、市场规模趋势和预测、按细分市场和地区划分的详细分析、竞争格局以及主要公司的简介。
目录
第一部分:报告概述
第一章:引言
第二章:研究方法
第三章:市场动态
第四章:宏观经济指标
第二部分:质性分析
第五章:摘要整理
第六章:引言
第七章:监理环境
第三部分:市场概览
第八章:关键指标综合资料库
第九章:竞争格局
第十章:市场空白分析
第十一章:竞争分析
第十二章:数位公用事业市场的新创企业生态系
第四部分:公司简介
第十三章:公司简介
- 章节概述
- ABB
- 埃森哲公司
- 凯捷公司
- 思科系统公司
- 高知特科技解决方案
- 伊顿公司
- 概述电动
- 霍尼韦尔
- IBM
- 伊创
- 微软
- 甲骨文
- SAP SE
- 施耐德电机
- 西门子
- 东芝
第五部分:市场趋势
第 14 章:大趋势分析
第 15 章:未满足的需求分析
第 16 章:专利分析
第 17 章:最新进展
第六部分:市场机会分析
第 18 章:全球数位实用程式市场
第19章:按组件划分的市场机会
第20章:按部署类型划分的市场机会
第21章:依网路类型划分的市场机会
第22章:依应用领域划分的市场机会
第23章:依技术类型划分的市场机会
第24章:依最终使用者类型划分的市场机会
第25章:依公司规模划分的市场机会
第26章:北美数位公用事业的市场机会
第27章:欧洲数位公用事业的市场机会
第28章:亚洲数位公用事业市场机会
第29章:中东及北非数位公用事业市场机会
第30章:拉丁美洲数位公用事业市场机会
第31章:世界其他地区数位公用事业市场机会
第32章:市场集中度分析:主要公司分布
第33章:邻近市场分析
第七部分:策略工具
第34章:关键制胜策略
第35章:波特五力模型分析
第36章:SWOT分析
第37章:价值链分析
第38章:ROOTS策略建议
第八部分:其他独家见解
第39章:来自一手研究的见解
第40章:报告结论
第九部分:附录
第41章:表格资料
第42章:公司与组织清单
第43章:客製化机会
第44章:ROOTS订阅服务
第四十五章:作者详情
Digital Utility Market Overview
As per Roots Analysis, the global digital utility market size is estimated to grow from USD 227.85 billion in the current year USD 654.68 billion by 2035, at a CAGR of 11.13% during the forecast period, till 2035.
The opportunity for digital utility market has been distributed across the following segments:
Type of Component
- Hardware
- Services
- Software
Type of Deployment
- Cloud
- Hybrid
- On-Premises
Type of Network
- Energy Storage
- Energy Trading
- Power Generation
- Retail
- Transmission & Distribution
Areas of Application
- Asset Management
- Smart Grid
- Smart Metering
Type of Technology
- Artificial Intelligence (AI)
- Big Data Analytics
- Internet of Things (IoT)
Type of End-User
- Commercial
- Residential
- Retail
Company Size
- Large Enterprises
- Small and Medium Enterprises
Geographical Regions
- North America
- US
- Canada
- Mexico
- Other North American countries
- Europe
- Austria
- Belgium
- Denmark
- France
- Germany
- Ireland
- Italy
- Netherlands
- Norway
- Russia
- Spain
- Sweden
- Switzerland
- UK
- Other European countries
- Asia
- China
- India
- Japan
- Singapore
- South Korea
- Other Asian countries
- Latin America
- Brazil
- Chile
- Colombia
- Venezuela
- Other Latin American countries
- Middle East and North Africa
- Egypt
- Iran
- Iraq
- Israel
- Kuwait
- Saudi Arabia
- UAE
- Other MENA countries
- Rest of the World
- Australia
- New Zealand
- Other countries
Digital Utility Market: Growth and Trends
Digital utility refers to the incorporation of cutting-edge technologies, data analytics, and communication systems into conventional utility frameworks to enhance efficiency, dependability, and sustainability. Within the sectors of electricity, water, and gas, digital utility solutions employ smart meters, sensors, and Internet of Things (IoT) devices to gather real-time data on usage trends and grid operations. This wealth of data enables utilities to improve resource management, swiftly detect issues, and respond more adeptly to variations in demand.
The utility industry is progressively adopting innovative digital technologies, such as blockchain, artificial intelligence (AI), and machine learning, to improve their operations, customer interactions, and partnerships within the supply chain. These digital approaches allow users to manage energy production and distribution more efficiently, providing capabilities like predictive maintenance along with increased safety and efficiency, which ultimately enhances customer satisfaction. The expansion of this sector is fueled by factors including the growth of renewable energy initiatives and mandates focused on energy efficiency. Furthermore, the pressing need for green energy and swift advancements are driving this momentum.
Digital Utility Market: Key Segments
Market Share by Type of Component
Based on type of component, the global digital utility market is segmented into hardware, services and software. According to our estimates, currently, the hardware segment captures the majority of the market share. This can be attributed to the widespread adoption of smart meters, transformers, and other advanced equipment that are crucial for digital utility solutions.
However, the services segment is expected to grow at a higher CAGR during the forecast period. This increase is driven by improvements in data extraction and analytics for better customer management, as well as a rising consumer preference for renewable energy options and sustainable practices from utility providers.
Market Share by Type of Deployment
Based on type of deployment, the global digital utility market is segmented into cloud, hybrid and on-premises. According to our estimates, currently, the on-premises segment captures the majority of the market share. This can be attributed to its established infrastructure and the control it provides utilities over their operations and data security. However, the cloud deployment segment is expected to grow at a higher CAGR during the forecast period. This increase is due to the widespread adoption of cloud deployment for its scalability, flexibility, and cost-effectiveness in managing digital utility functions.
Market Share by Type of Network
Based on type of network, the global digital utility market is segmented into energy storage, energy trading, power generation, retail, transmission & distribution. According to our estimates, currently, the transmission & distribution segment captures the majority of the market share. This growth is largely due to the substantial investments necessary to upgrade outdated infrastructure and enhance the efficiency of electricity delivery systems.
However, the retail segment is expected to grow at a higher CAGR during the forecast period. This increase is driven by heightened consumer awareness regarding environmental issues and an increasing demand for renewable energy alternatives.
Market Share by Area of Application
Based on area of application, the global digital utility market is segmented into asset management, smart grid and smart meeting. According to our estimates, currently, the smart grid segment captures the majority of the market share. This increase can be attributed to the essential function the smart grid sector serves in upgrading energy infrastructure and enhancing both the efficiency and reliability of electricity distribution. However, the smart metering sector is expected to grow at a higher CAGR during the forecast period. This growth is linked to the increasing demand for precise billing, improved customer engagement, and more effective energy management solutions.
Market Share by Type of Technology
Based on type of technology, the global digital utility market is segmented into artificial intelligence (AI), big data analytics, and the internet of things (IoT). According to our estimates, currently, the artificial intelligence (AI) segment captures the majority of the market share. This growth can be attributed to its capacity to boost operational efficiency, enhance predictive maintenance, and support data-driven decision-making among utility providers.
However, the internet of things (IoT) segment is expected to grow at a higher CAGR during the forecast period. This increase is linked to the rising number of connected devices and sensors that enable real-time monitoring and management of energy resources.
Market Share by Type of End User
Based on type of end user, the global digital utility market is segmented into commercial, residential and retail. According to our estimates, currently, the commercial segment captures the majority of the market share. This increase can be attributed to the rising adoption of digital utility solutions by businesses aiming to boost operational efficiency and lower energy expenses.
However, the retail segment is expected to grow at a higher CAGR during the forecast period. This increase is linked to the increasing dependence on data analytics to gain deeper insights into customer behaviors and preferences. By employing digital utility solutions, retailers can enhance their energy management strategies, resulting in reduced costs and improved customer satisfaction.
Market Share by Company Size
Based on company size, the global digital utility market is segmented into large and small and medium enterprise. According to our estimates, currently, the large enterprise segment captures the majority of the market share. Meanwhile, the small and medium enterprise segments is expected to grow at a higher CAGR during the forecast period. This growth can be attributed to their adaptability, innovation, focus on specialized markets, and capacity to respond to evolving customer needs and market dynamics.
Market Share by Geographical Regions
Based on geographical regions, the digital utility market is segmented into North America, Europe, Asia, Latin America, Middle East and North Africa, and the rest of the world. According to our estimates, currently North America captures the majority share of the market, owing to the region's advanced technological infrastructure, early integration of smart grid solutions, and strong initiatives toward grid modernization.
Example Players in Digital Utility Market
- ABB
- Accenture PLC
- Capgemini SA
- Cisco Systems
- Cognizant Technology Solutions
- Eaton
- General Electric
- Honeywell
- IBM
- Itron
- Microsoft
- Oracle
- SAP SE
- Schneider Electric
- Siemens
- Toshiba
Digital Utility Market: Research Coverage
The report on the digital utility market features insights on various sections, including:
- Market Sizing and Opportunity Analysis: An in-depth analysis of the digital utility market, focusing on key market segments, including [A] type of component, [B] type of deployment, [C] type of network, [D] areas of application, [E] type of technology, [F] type of end-user, [G] company size, and [H] key geographical regions.
- Competitive Landscape: A comprehensive analysis of the companies engaged in the digital utility market, based on several relevant parameters, such as [A] year of establishment, [B] company size, [C] location of headquarters and [D] ownership structure.
- Company Profiles: Elaborate profiles of prominent players engaged in the digital utility market, providing details on [A] location of headquarters, [B] company size, [C] company mission, [D] company footprint, [E] management team, [F] contact details, [G] financial information, [H] operating business segments, [I] portfolio, [J] moat analysis, [K] recent developments, and an informed future outlook.
- Megatrends: An evaluation of ongoing megatrends in the digital utility industry.
- Patent Analysis: An insightful analysis of patents filed / granted in the digital utility domain, based on relevant parameters, including [A] type of patent, [B] patent publication year, [C] patent age and [D] leading players.
- Recent Developments: An overview of the recent developments made in the digital utility market, along with analysis based on relevant parameters, including [A] year of initiative, [B] type of initiative, [C] geographical distribution and [D] most active players.
- Porter's Five Forces Analysis: An analysis of five competitive forces prevailing in the digital utility market, including threats of new entrants, bargaining power of buyers, bargaining power of suppliers, threats of substitute products and rivalry among existing competitors.
- SWOT Analysis: An insightful SWOT framework, highlighting the strengths, weaknesses, opportunities and threats in the domain. Additionally, it provides Harvey ball analysis, highlighting the relative impact of each SWOT parameter.
- Value Chain Analysis: A comprehensive analysis of the value chain, providing information on the different phases and stakeholders involved in the digital utility market.
Key Questions Answered in this Report
- How many companies are currently engaged in digital utility market?
- Which are the leading companies in this market?
- What factors are likely to influence the evolution of this market?
- What is the current and future market size?
- What is the CAGR of this market?
- How is the current and future market opportunity likely to be distributed across key market segments?
Reasons to Buy this Report
- The report provides a comprehensive market analysis, offering detailed revenue projections of the overall market and its specific sub-segments. This information is valuable to both established market leaders and emerging entrants.
- Stakeholders can leverage the report to gain a deeper understanding of the competitive dynamics within the market. By analyzing the competitive landscape, businesses can make informed decisions to optimize their market positioning and develop effective go-to-market strategies.
- The report offers stakeholders a comprehensive overview of the market, including key drivers, barriers, opportunities, and challenges. This information empowers stakeholders to stay abreast of market trends and make data-driven decisions to capitalize on growth prospects.
Additional Benefits
- Complimentary Excel Data Packs for all Analytical Modules in the Report
- 15% Free Content Customization
- Detailed Report Walkthrough Session with Research Team
- Free Updated report if the report is 6-12 months old or older
TABLE OF CONTENTS
SECTION I: REPORT OVERVIEW
1. PREFACE
- 1.1. Introduction
- 1.2. Market Share Insights
- 1.3. Key Market Insights
- 1.4. Report Coverage
- 1.5. Key Questions Answered
- 1.6. Chapter Outlines
2. RESEARCH METHODOLOGY
- 2.1. Chapter Overview
- 2.2. Research Assumptions
- 2.3. Database Building
- 2.3.1. Data Collection
- 2.3.2. Data Validation
- 2.3.3. Data Analysis
- 2.4. Project Methodology
- 2.4.1. Secondary Research
- 2.4.1.1. Annual Reports
- 2.4.1.2. Academic Research Papers
- 2.4.1.3. Company Websites
- 2.4.1.4. Investor Presentations
- 2.4.1.5. Regulatory Filings
- 2.4.1.6. White Papers
- 2.4.1.7. Industry Publications
- 2.4.1.8. Conferences and Seminars
- 2.4.1.9. Government Portals
- 2.4.1.10. Media and Press Releases
- 2.4.1.11. Newsletters
- 2.4.1.12. Industry Databases
- 2.4.1.13. Roots Proprietary Databases
- 2.4.1.14. Paid Databases and Sources
- 2.4.1.15. Social Media Portals
- 2.4.1.16. Other Secondary Sources
- 2.4.2. Primary Research
- 2.4.2.1. Introduction
- 2.4.2.2. Types
- 2.4.2.2.1. Qualitative
- 2.4.2.2.2. Quantitative
- 2.4.2.3. Advantages
- 2.4.2.4. Techniques
- 2.4.2.4.1. Interviews
- 2.4.2.4.2. Surveys
- 2.4.2.4.3. Focus Groups
- 2.4.2.4.4. Observational Research
- 2.4.2.4.5. Social Media Interactions
- 2.4.2.5. Stakeholders
- 2.4.2.5.1. Company Executives (CXOs)
- 2.4.2.5.2. Board of Directors
- 2.4.2.5.3. Company Presidents and Vice Presidents
- 2.4.2.5.4. Key Opinion Leaders
- 2.4.2.5.5. Research and Development Heads
- 2.4.2.5.6. Technical Experts
- 2.4.2.5.7. Subject Matter Experts
- 2.4.2.5.8. Scientists
- 2.4.2.5.9. Doctors and Other Healthcare Providers
- 2.4.2.6. Ethics and Integrity
- 2.4.2.6.1. Research Ethics
- 2.4.2.6.2. Data Integrity
- 2.4.3. Analytical Tools and Databases
- 2.4.1. Secondary Research
3. MARKET DYNAMICS
- 3.1. Forecast Methodology
- 3.1.1. Top-Down Approach
- 3.1.2. Bottom-Up Approach
- 3.1.3. Hybrid Approach
- 3.2. Market Assessment Framework
- 3.2.1. Total Addressable Market (TAM)
- 3.2.2. Serviceable Addressable Market (SAM)
- 3.2.3. Serviceable Obtainable Market (SOM)
- 3.2.4. Currently Acquired Market (CAM)
- 3.3. Forecasting Tools and Techniques
- 3.3.1. Qualitative Forecasting
- 3.3.2. Correlation
- 3.3.3. Regression
- 3.3.4. Time Series Analysis
- 3.3.5. Extrapolation
- 3.3.6. Convergence
- 3.3.7. Forecast Error Analysis
- 3.3.8. Data Visualization
- 3.3.9. Scenario Planning
- 3.3.10. Sensitivity Analysis
- 3.4. Key Considerations
- 3.4.1. Demographics
- 3.4.2. Market Access
- 3.4.3. Reimbursement Scenarios
- 3.4.4. Industry Consolidation
- 3.5. Robust Quality Control
- 3.6. Key Market Segmentations
- 3.7. Limitations
4. MACRO-ECONOMIC INDICATORS
- 4.1. Chapter Overview
- 4.2. Market Dynamics
- 4.2.1. Time Period
- 4.2.1.1. Historical Trends
- 4.2.1.2. Current and Forecasted Estimates
- 4.2.2. Currency Coverage
- 4.2.2.1. Overview of Major Currencies Affecting the Market
- 4.2.2.2. Impact of Currency Fluctuations on the Industry
- 4.2.3. Foreign Exchange Impact
- 4.2.3.1. Evaluation of Foreign Exchange Rates and Their Impact on Market
- 4.2.3.2. Strategies for Mitigating Foreign Exchange Risk
- 4.2.4. Recession
- 4.2.4.1. Historical Analysis of Past Recessions and Lessons Learnt
- 4.2.4.2. Assessment of Current Economic Conditions and Potential Impact on the Market
- 4.2.5. Inflation
- 4.2.5.1. Measurement and Analysis of Inflationary Pressures in the Economy
- 4.2.5.2. Potential Impact of Inflation on the Market Evolution
- 4.2.6. Interest Rates
- 4.2.6.1. Overview of Interest Rates and Their Impact on the Market
- 4.2.6.2. Strategies for Managing Interest Rate Risk
- 4.2.7. Commodity Flow Analysis
- 4.2.7.1. Type of Commodity
- 4.2.7.2. Origins and Destinations
- 4.2.7.3. Values and Weights
- 4.2.7.4. Modes of Transportation
- 4.2.8. Global Trade Dynamics
- 4.2.8.1. Import Scenario
- 4.2.8.2. Export Scenario
- 4.2.9. War Impact Analysis
- 4.2.9.1. Russian-Ukraine War
- 4.2.9.2. Israel-Hamas War
- 4.2.10. COVID Impact / Related Factors
- 4.2.10.1. Global Economic Impact
- 4.2.10.2. Industry-specific Impact
- 4.2.10.3. Government Response and Stimulus Measures
- 4.2.10.4. Future Outlook and Adaptation Strategies
- 4.2.11. Other Indicators
- 4.2.11.1. Fiscal Policy
- 4.2.11.2. Consumer Spending
- 4.2.11.3. Gross Domestic Product (GDP)
- 4.2.11.4. Employment
- 4.2.11.5. Taxes
- 4.2.11.6. R&D Innovation
- 4.2.11.7. Stock Market Performance
- 4.2.11.8. Supply Chain
- 4.2.11.9. Cross-Border Dynamics
- 4.2.1. Time Period
SECTION II: QUALITATIVE INSIGHTS
5. EXECUTIVE SUMMARY
6. INTRODUCTION
- 6.1. Chapter Overview
- 6.2. Overview of Digital Utility Market
- 6.2.1. Type of Components
- 6.2.2. Types of Deployment
- 6.2.3. Types of Networks
- 6.2.4. Areas of Application
- 6.2.5. Type of Technology
- 6.2.6. Type of End-Users
- 6.3. Future Perspective
7. REGULATORY SCENARIO
SECTION III: MARKET OVERVIEW
8. COMPREHENSIVE DATABASE OF LEADING PLAYERS
9. COMPETITIVE LANDSCAPE
- 9.1. Chapter Overview
- 9.2. Digital Utility Market: Overall Market Landscape
- 9.2.1. Analysis by Year of Establishment
- 9.2.2. Analysis by Company Size
- 9.2.3. Analysis by Location of Headquarters
- 9.2.4. Analysis by Ownership Structure
10. WHITE SPACE ANALYSIS
11. COMPANY COMPETITIVENESS ANALYSIS
12. STARTUP ECOSYSTEM IN THE DIGITAL UTILITY MARKET
- 12.1. Digital Utility Market: Market Landscape of Startups
- 12.1.1. Analysis by Year of Establishment
- 12.1.2. Analysis by Company Size
- 12.1.3. Analysis by Company Size and Year of Establishment
- 12.1.4. Analysis by Location of Headquarters
- 12.1.5. Analysis by Company Size and Location of Headquarters
- 12.1.6. Analysis by Ownership Structure
- 12.2. Key Findings
SECTION IV: COMPANY PROFILES
13. COMPANY PROFILES
- 13.1. Chapter Overview
- 13.2. ABB*
- 13.2.1. Company Overview
- 13.2.2. Company Mission
- 13.2.3. Company Footprint
- 13.2.4. Management Team
- 13.2.5. Contact Details
- 13.2.6. Financial Performance
- 13.2.7. Operating Business Segments
- 13.2.8. Service / Product Portfolio (project specific)
- 13.2.9. MOAT Analysis
- 13.2.10. Recent Developments and Future Outlook
- 13.3. Accenture PLC
- 13.4. Capgemini SA
- 13.5. Cisco Systems
- 13.6. Cognizant Technology Solutions
- 13.7. Eaton
- 13.8. General Electric
- 13.9. Honeywell
- 13.10. IBM
- 13.11. Itron
- 13.12. Microsoft
- 13.13. Oracle
- 13.14. SAP SE
- 13.15. Schneider Electric
- 13.16. Siemens
- 13.17. Toshiba
SECTION V: MARKET TRENDS
14. MEGA TRENDS ANALYSIS
15. UNMET NEED ANALYSIS
16. PATENT ANALYSIS
17. RECENT DEVELOPMENTS
- 17.1. Chapter Overview
- 17.2. Recent Funding
- 17.3. Recent Partnerships
- 17.4. Other Recent Initiatives
SECTION VI: MARKET OPPORTUNITY ANALYSIS
18. GLOBAL DIGITAL UTILITY MARKET
- 18.1. Chapter Overview
- 18.2. Key Assumptions and Methodology
- 18.3. Trends Disruption Impacting Market
- 18.4. Demand Side Trends
- 18.5. Supply Side Trends
- 18.6. Global Digital Utility Market, Historical Trends (Since 2020) and Forecasted Estimates (Till 2035)
- 18.7. Multivariate Scenario Analysis
- 18.7.1. Conservative Scenario
- 18.7.2. Optimistic Scenario
- 18.8. Investment Feasibility Index
- 18.9. Key Market Segmentations
19. MARKET OPPORTUNITIES BASED ON TYPE OF COMPONENT
- 19.1. Chapter Overview
- 19.2. Key Assumptions and Methodology
- 19.3. Revenue Shift Analysis
- 19.4. Market Movement Analysis
- 19.5. Penetration-Growth (P-G) Matrix
- 19.6. Digital Utility Market for Hardware: Historical Trends (Since 2020) and Forecasted Estimates (Till 2035)
- 19.7. Digital Utility Market for Services: Historical Trends (Since 2020) and Forecasted Estimates (Till 2035)
- 19.8. Digital Utility Market for Software: Historical Trends (Since 2020) and Forecasted Estimates (Till 2035)
- 19.9. Data Triangulation and Validation
- 19.9.1. Secondary Sources
- 19.9.2. Primary Sources
- 19.9.3. Statistical Modeling
20. MARKET OPPORTUNITIES BASED ON TYPE OF DEPLOYMENT
- 20.1. Chapter Overview
- 20.2. Key Assumptions and Methodology
- 20.3. Revenue Shift Analysis
- 20.4. Market Movement Analysis
- 20.5. Penetration-Growth (P-G) Matrix
- 20.6. Digital Utility Market for Cloud: Historical Trends (Since 2020) and Forecasted Estimates (Till 2035)
- 20.7. Digital Utility Market for Hybrid: Historical Trends (Since 2020) and Forecasted Estimates (Till 2035)
- 20.8. Digital Utility Market for On-Premises: Historical Trends (Since 2020) and Forecasted Estimates (Till 2035)
- 20.9. Data Triangulation and Validation
- 20.9.1. Secondary Sources
- 20.9.2. Primary Sources
- 20.9.3. Statistical Modeling
21. MARKET OPPORTUNITIES BASED ON TYPE OF NETWORK
- 21.1. Chapter Overview
- 21.2. Key Assumptions and Methodology
- 21.3. Revenue Shift Analysis
- 21.4. Market Movement Analysis
- 21.5. Penetration-Growth (P-G) Matrix
- 21.6. Digital Utility Market for Energy Storage: Historical Trends (Since 2020) and Forecasted Estimates (Till 2035)
- 21.7. Digital Utility Market for Energy Trading: Historical Trends (Since 2020) and Forecasted Estimates (Till 2035)
- 21.8. Digital Utility Market for Power Generation: Historical Trends (Since 2020) and Forecasted Estimates (Till 2035)
- 21.9. Digital Utility Market for Retail: Historical Trends (Since 2020) and Forecasted Estimates (Till 2035)
- 21.10. Digital Utility Market for Transmission & Distribution: Historical Trends (Since 2020) and Forecasted Estimates (Till 2035)
- 21.11. Data Triangulation and Validation
- 21.11.1. Secondary Sources
- 21.11.2. Primary Sources
- 21.11.3. Statistical Modeling
22. MARKET OPPORTUNITIES BASED ON AREAS OF APPLICATION
- 22.1. Chapter Overview
- 22.2. Key Assumptions and Methodology
- 22.3. Revenue Shift Analysis
- 22.4. Market Movement Analysis
- 22.5. Penetration-Growth (P-G) Matrix
- 22.6. Digital Utility Market for Asset Management: Historical Trends (Since 2020) and Forecasted Estimates (Till 2035)
- 22.7. Digital Utility Market for Smart Grid: Historical Trends (Since 2020) and Forecasted Estimates (Till 2035)
- 22.8. Digital Utility Market for Smart Metering: Historical Trends (Since 2020) and Forecasted Estimates (Till 2035)
- 22.9. Data Triangulation and Validation
- 22.9.1. Secondary Sources
- 22.9.2. Primary Sources
- 22.9.3. Statistical Modeling
23. MARKET OPPORTUNITIES BASED ON TYPE OF TECHNOLOGY
- 23.1. Chapter Overview
- 23.2. Key Assumptions and Methodology
- 23.3. Revenue Shift Analysis
- 23.4. Market Movement Analysis
- 23.5. Penetration-Growth (P-G) Matrix
- 23.6. Digital Utility Market for Artificial Intelligence (AI): Historical Trends (Since 2020) and Forecasted Estimates (Till 2035)
- 23.7. Digital Utility Market for Big Data Analytics: Historical Trends (Since 2020) and Forecasted Estimates (Till 2035)
- 23.8. Digital Utility Market for Internet of Things (IoT): Historical Trends (Since 2020) and Forecasted Estimates (Till 2035)
- 23.9. Data Triangulation and Validation
- 23.9.1. Secondary Sources
- 23.9.2. Primary Sources
- 23.9.3. Statistical Modeling
24. MARKET OPPORTUNITIES BASED ON TYPE OF END-USER
- 24.1. Chapter Overview
- 24.2. Key Assumptions and Methodology
- 24.3. Revenue Shift Analysis
- 24.4. Market Movement Analysis
- 24.5. Penetration-Growth (P-G) Matrix
- 24.6. Digital Utility Market for Commercial: Historical Trends (Since 2020) and Forecasted Estimates (Till 2035)
- 24.7. Digital Utility Market for Residential: Historical Trends (Since 2020) and Forecasted Estimates (Till 2035)
- 24.8. Digital Utility Market for Retail: Historical Trends (Since 2020) and Forecasted Estimates (Till 2035)
- 24.9. Data Triangulation and Validation
- 24.9.1. Secondary Sources
- 24.9.2. Primary Sources
- 24.9.3. Statistical Modeling
25. MARKET OPPORTUNITIES BASED ON COMPANY SIZE
- 25.1. Chapter Overview
- 25.2. Key Assumptions and Methodology
- 25.3. Revenue Shift Analysis
- 25.4. Market Movement Analysis
- 25.5. Penetration-Growth (P-G) Matrix
- 25.6. Digital Utility Market for Large Enterprises: Historical Trends (Since 2020) and Forecasted Estimates (Till 2035)
- 25.7. Digital Utility Market for Small and Medium Enterprises: Historical Trends (Since 2020) and Forecasted Estimates (Till 2035)
- 25.8. Data Triangulation and Validation
- 25.8.1. Secondary Sources
- 25.8.2. Primary Sources
- 25.8.3. Statistical Modeling
26. MARKET OPPORTUNITIES FOR DIGITAL UTILITY IN NORTH AMERICA
- 26.1. Chapter Overview
- 26.2. Key Assumptions and Methodology
- 26.3. Revenue Shift Analysis
- 26.4. Market Movement Analysis
- 26.5. Penetration-Growth (P-G) Matrix
- 26.6. Digital Utility Market in North America: Historical Trends (Since 2020) and Forecasted Estimates (Till 2035)
- 26.6.1. Digital Utility Market in the US: Historical Trends (Since 2020) and Forecasted Estimates (Till 2035)
- 26.6.2. Digital Utility Market in Canada: Historical Trends (Since 2020) and Forecasted Estimates (Till 2035)
- 26.6.3. Digital Utility Market in Mexico: Historical Trends (Since 2020) and Forecasted Estimates (Till 2035)
- 26.6.4. Digital Utility Market in Other North American Countries: Historical Trends (Since 2020) and Forecasted Estimates (Till 2035)
- 26.7. Data Triangulation and Validation
27. MARKET OPPORTUNITIES FOR DIGITAL UTILITY IN EUROPE
- 27.1. Chapter Overview
- 27.2. Key Assumptions and Methodology
- 27.3. Revenue Shift Analysis
- 27.4. Market Movement Analysis
- 27.5. Penetration-Growth (P-G) Matrix
- 27.6. Digital Utility Market in Europe: Historical Trends (Since 2020) and Forecasted Estimates (Till 2035)
- 27.6.1. Digital Utility Market in Austria: Historical Trends (Since 2020) and Forecasted Estimates (Till 2035)
- 27.6.2. Digital Utility Market in Belgium: Historical Trends (Since 2020) and Forecasted Estimates (Till 2035)
- 27.6.3. Digital Utility Market in Denmark: Historical Trends (Since 2020) and Forecasted Estimates (Till 2035)
- 27.6.4. Digital Utility Market in France: Historical Trends (Since 2020) and Forecasted Estimates (Till 2035)
- 27.6.5. Digital Utility Market in Germany: Historical Trends (Since 2020) and Forecasted Estimates (Till 2035)
- 27.6.6. Digital Utility Market in Ireland: Historical Trends (Since 2020) and Forecasted Estimates (Till 2035)
- 27.6.7. Digital Utility Market in Italy: Historical Trends (Since 2020) and Forecasted Estimates (Till 2035)
- 27.6.8. Digital Utility Market in Netherlands: Historical Trends (Since 2020) and Forecasted Estimates (Till 2035)
- 27.6.9. Digital Utility Market in Norway: Historical Trends (Since 2020) and Forecasted Estimates (Till 2035)
- 27.6.10. Digital Utility Market in Russia: Historical Trends (Since 2020) and Forecasted Estimates (Till 2035)
- 27.6.11. Digital Utility Market in Spain: Historical Trends (Since 2020) and Forecasted Estimates (Till 2035)
- 27.6.12. Digital Utility Market in Sweden: Historical Trends (Since 2020) and Forecasted Estimates (Till 2035)
- 27.6.13. Digital Utility Market in Switzerland: Historical Trends (Since 2020) and Forecasted Estimates (Till 2035)
- 27.6.14. Digital Utility Market in the UK: Historical Trends (Since 2020) and Forecasted Estimates (Till 2035)
- 27.6.15. Digital Utility Market in Other European Countries: Historical Trends (Since 2020) and Forecasted Estimates (Till 2035)
- 27.7. Data Triangulation and Validation
28. MARKET OPPORTUNITIES FOR DIGITAL UTILITY IN ASIA
- 28.1. Chapter Overview
- 28.2. Key Assumptions and Methodology
- 28.3. Revenue Shift Analysis
- 28.4. Market Movement Analysis
- 28.5. Penetration-Growth (P-G) Matrix
- 28.6. Digital Utility Market in Asia: Historical Trends (Since 2020) and Forecasted Estimates (Till 2035)
- 28.6.1. Digital Utility Market in China: Historical Trends (Since 2020) and Forecasted Estimates (Till 2035)
- 28.6.2. Digital Utility Market in India: Historical Trends (Since 2020) and Forecasted Estimates (Till 2035)
- 28.6.3. Digital Utility Market in Japan: Historical Trends (Since 2020) and Forecasted Estimates (Till 2035)
- 28.6.4. Digital Utility Market in Singapore: Historical Trends (Since 2020) and Forecasted Estimates (Till 2035)
- 28.6.5. Digital Utility Market in South Korea: Historical Trends (Since 2020) and Forecasted Estimates (Till 2035)
- 28.6.6. Digital Utility Market in Other Asian Countries: Historical Trends (Since 2020) and Forecasted Estimates (Till 2035)
- 28.7. Data Triangulation and Validation
29. MARKET OPPORTUNITIES FOR DIGITAL UTILITY IN MIDDLE EAST AND NORTH AFRICA (MENA)
- 29.1. Chapter Overview
- 29.2. Key Assumptions and Methodology
- 29.3. Revenue Shift Analysis
- 29.4. Market Movement Analysis
- 29.5. Penetration-Growth (P-G) Matrix
- 29.6. Digital Utility Market in Middle East and North Africa (MENA): Historical Trends (Since 2020) and Forecasted Estimates (Till 2035)
- 29.6.1. Digital Utility Market in Egypt: Historical Trends (Since 2020) and Forecasted Estimates (Till 205)
- 29.6.2. Digital Utility Market in Iran: Historical Trends (Since 2020) and Forecasted Estimates (Till 2035)
- 29.6.3. Digital Utility Market in Iraq: Historical Trends (Since 2020) and Forecasted Estimates (Till 2035)
- 29.6.4. Digital Utility Market in Israel: Historical Trends (Since 2020) and Forecasted Estimates (Till 2035)
- 29.6.5. Digital Utility Market in Kuwait: Historical Trends (Since 2020) and Forecasted Estimates (Till 2035)
- 29.6.6. Digital Utility Market in Saudi Arabia: Historical Trends (Since 2020) and Forecasted Estimates (Till 2035)
- 29.6.7. Digital Utility Market in United Arab Emirates (UAE): Historical Trends (Since 2020) and Forecasted Estimates (Till 2035)
- 29.6.8. Digital Utility Market in Other MENA Countries: Historical Trends (Since 2020) and Forecasted Estimates (Till 2035)
- 29.7. Data Triangulation and Validation
30. MARKET OPPORTUNITIES FOR DIGITAL UTILITY IN LATIN AMERICA
- 30.1. Chapter Overview
- 30.2. Key Assumptions and Methodology
- 30.3. Revenue Shift Analysis
- 30.4. Market Movement Analysis
- 30.5. Penetration-Growth (P-G) Matrix
- 30.6. Digital Utility Market in Latin America: Historical Trends (Since 2020) and Forecasted Estimates (Till 2035)
- 30.6.1. Digital Utility Market in Argentina: Historical Trends (Since 2020) and Forecasted Estimates (Till 2035)
- 30.6.2. Digital Utility Market in Brazil: Historical Trends (Since 2020) and Forecasted Estimates (Till 2035)
- 30.6.3. Digital Utility Market in Chile: Historical Trends (Since 2020) and Forecasted Estimates (Till 2035)
- 30.6.4. Digital Utility Market in Colombia Historical Trends (Since 2020) and Forecasted Estimates (Till 2035)
- 30.6.5. Digital Utility Market in Venezuela: Historical Trends (Since 2020) and Forecasted Estimates (Till 2035)
- 30.6.6. Digital Utility Market in Other Latin American Countries: Historical Trends (Since 2020) and Forecasted Estimates (Till 2035)
- 30.7. Data Triangulation and Validation
31. MARKET OPPORTUNITIES FOR DIGITAL UTILITY IN REST OF THE WORLD
- 31.1. Chapter Overview
- 31.2. Key Assumptions and Methodology
- 31.3. Revenue Shift Analysis
- 31.4. Market Movement Analysis
- 31.5. Penetration-Growth (P-G) Matrix
- 31.6. Digital Utility Market in Rest of the World: Historical Trends (Since 2020) and Forecasted Estimates (Till 2035)
- 31.6.1. Digital Utility Market in Australia: Historical Trends (Since 2020) and Forecasted Estimates (Till 2035)
- 31.6.2. Digital Utility Market in New Zealand: Historical Trends (Since 2020) and Forecasted Estimates (Till 2035)
- 31.6.3. Digital Utility Market in Other Countries
- 31.7. Data Triangulation and Validation
32. MARKET CONCENTRATION ANALYSIS: DISTRIBUTION BY LEADING PLAYERS
- 32.1. Leading Player 1
- 32.2. Leading Player 2
- 32.3. Leading Player 3
- 32.4. Leading Player 4
- 32.5. Leading Player 5
- 32.6. Leading Player 6
- 32.7. Leading Player 7
- 32.8. Leading Player 8
33. ADJACENT MARKET ANALYSIS
SECTION VII: STRATEGIC TOOLS
34. KEY WINNING STRATEGIES
35. PORTER'S FIVE FORCES ANALYSIS
36. SWOT ANALYSIS
37. VALUE CHAIN ANALYSIS
38. ROOTS STRATEGIC RECOMMENDATIONS
- 38.1. Chapter Overview
- 38.2. Key Business-related Strategies
- 38.2.1. Research & Development
- 38.2.2. Product Manufacturing
- 38.2.3. Commercialization / Go-to-Market
- 38.2.4. Sales and Marketing
- 38.3. Key Operations-related Strategies
- 38.3.1. Risk Management
- 38.3.2. Workforce
- 38.3.3. Finance
- 38.3.4. Others


