


 |
市场调查报告书
商品编码
1993593
澳洲药物输送设备市场:产业趋势与预测(至 2035 年)-依产品类型、应用领域和最终用户划分Australia Drug Delivery Devices Market: Industry Trends and Global Forecasts, till 2035 - Distribution by Type of Product, Application Area and End-user |
||||||
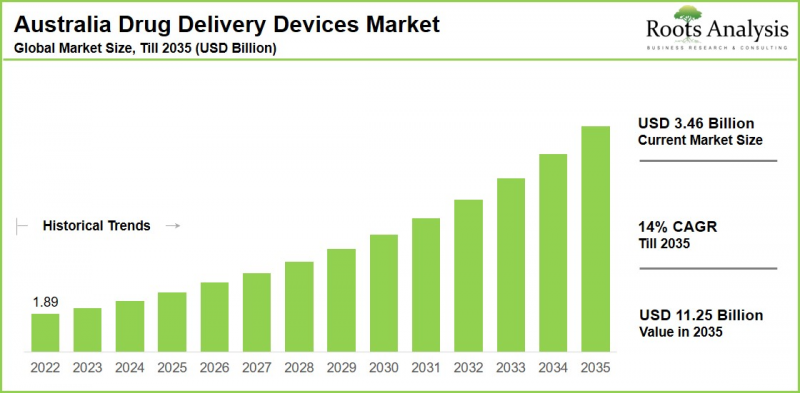
澳洲药物输送设备市场预计将从目前的 34.6 亿美元增长至 2035 年的 112.5 亿美元,预计在 2035 年之前的预测期内,复合年增长率 (CAGR) 为 14%。
澳洲药物传输设备市场:成长与趋势
药物传输设备用于治疗多种疾病,包括气喘、慢性阻塞性肺病 (COPD)、糖尿病、癌症、心血管疾病和慢性疼痛。 这些设备能够实现精准给药。药物传递技术旨在提高疗效和患者依从性,同时减少副作用。近年来,药物输送装置的研发重点集中在智慧连接、奈米技术和标靶释放等方面,从而提高了患者的依从性并实现了精准给药。 由于糖尿病等慢性疾病的盛行率不断上升,以及人口老化导致心血管疾病和自体免疫疾病的增加,澳洲药物输送装置市场呈现稳定成长的态势。这些因素推动了对精准易用装置的需求,例如注射器、吸入器、缓释植入剂和自动注射器。此外,互联智能自动注射器、可实现无痛透皮给药的微针贴片、可生物降解的植入剂、用于实时给药的人工智能可穿戴泵以及无针给药系统等技术进步,在提高药物依从性和疗效的同时,也为澳大利亚的数位健康战略和居家护理项目提供了支持,所有这些都在推动澳大利亚药物输送装置市场的增长。
成长驱动因素:市场扩张的策略推动力
澳洲药物输送设备市场由多个相互关联的成长驱动因素所驱动,反映了广泛的人口结构、技术和政策变化。此外,慢性病、癌症和心血管疾病的日益普遍,推动了对高效、标靶给药系统(例如自动注射器和缓释植入物)的需求激增,这些系统能够改善患者预后并降低住院率。智慧互联吸入器、用于增强透皮吸收的微针贴片、用于最大限度减少错误的预充式註射器以及用于即时监测的整合人工智慧的可穿戴泵等技术进步,正在与澳洲的数位健康生态系统相协调,从而提高患者的用药依从性和疗效。政府透过各项措施、对医疗基础设施的投资以及促进远距医疗的政策,进一步加速了该地区药物输送设备的普及应用。
市场挑战:阻碍发展的重大障碍
儘管市场条件有利,仍面临许多阻碍扩张和市场准入的重大挑战。澳洲药品管理局 (TGA) 的严格监管导致审批流程漫长且成本高昂。对于 III 类医疗器械,审批费用通常超过 95,000 澳元,而分阶段实施合规措施直至 2026 年,这给创新者设置了障碍,延缓了产品上市。开发和取得先进技术的高昂成本限制了产品的可负担性和可近性,尤其是在农村地区。此外,诸如药品福利计划 (PBS) 等方案下的报销障碍也使新医疗器材的市场渗透变得更加复杂。来自贝克顿·迪金森和诺华等主要企业的激烈竞争,以及医护人员和患者对减少不必要的穿刺事故等益处的认知不足,都导致了市场普及率缓慢。此外,供应链的脆弱性,例如Ozempic等GLP-1製剂持续短缺(预计持续到2025年),以及对专业化生产流程的需求,都增加了这个资本密集产业的风险。本报告分析了澳洲药物输送装置市场,提供了市场规模估算、机会分析、竞争格局和公司概况等资讯。
目录
第一章:引言
第二章:研究方法
第三章:市场动态
第四章:宏观经济指标
第五章:摘要整理
第六章:引言
第七章:市场概览
第8章 企业简介:澳洲的药物输送设备市场
- 章概要
- Becton Dickinson and Company
- SiBiono GeneTech
- Bayer
- Novartis
- GlaxoSmithKline
- Teva Pharmaceutical Industries
- AbbVie
- Novo Nordisk
- Johnson & Johnson
- Sanofi
- Viatris
- Pfizer
第 9 章:合作伙伴与联盟
第 10 章:市场影响分析
第 11 章:澳洲给药设备市场
第 12 章:澳洲给药装置市场:依产品类型
第 13 章:澳洲给药设备市场:依应用分类区域
第十四章:澳洲药物输送设备市场:依最终用户划分
第十五章:结论
第十六章 附录一:表格资料
第十七章 附录二:公司与组织清单
Australia Drug Delivery Devices Market: Overview
As per Roots Analysis, the Australia drug delivery devices market is estimated to grow from USD 3.46 billion in the current year to USD 11.25 billion by 2035 at a CAGR of 14% during the forecast period, till 2035.
Australia Drug Delivery Devices Market: Growth and Trends
Drug delivery devices are utilized for a variety of conditions, including asthma, chronic obstructive pulmonary disease (COPD), diabetes, cancer, cardiovascular diseases, and chronic pain. These devices facilitate accurate and focused administration of medications, enhancing effectiveness and patient adherence while reducing adverse effects. Recent advancements in drug delivery devices focus on smart connectivity, nanotechnology, and targeted release for better patient compliance and precision dosing.
The market for drug delivery devices in Australia is showing consistent growth, driven by the increasing prevalence of chronic illnesses such as diabetes along with growing cardiovascular and autoimmune disorders in an aging demographic. Such factors elevate the need for accurate, user-friendly devices like injectables, inhalers, sustained-release implants, and auto-injectors. In addition, advancements in technology, such as smart auto-injectors with connectivity, microneedle patches for painless transdermal delivery, biodegradable implants, wearable pumps that use AI for real-time dosing, and needle-free systems, are enhancing adherence and effectiveness while supporting Australia's digital health strategy and home care programs, collectively promoting the growth of the drug delivery devices market in Australia.
Growth Drivers: Strategic Enablers of Market Expansion
Australia's drug delivery devices market is propelled by several interconnected growth drivers that reflect broader demographic, technological, and policy shifts. Further, the surging prevalence of chronic diseases, cancer and cardiovascular conditions creates acute demand for efficient, targeted delivery systems like auto-injectors and sustained-release implants to improve patient outcomes and reduce hospitalization rates. Technological advancements, including smart connected inhalers, microneedle patches enhancing transdermal absorption, pre-filled syringes minimizing errors, and AI-integrated wearable pumps for real-time monitoring, boost adherence and efficacy while aligning with Australia's digital health ecosystem. Government support through initiatives, investments in healthcare infrastructure, and policies promoting telemedicine further accelerate adoption of drug delivery devices in this region.
Market Challenges: Critical Barriers Impeding Progress
Despite these tailwinds, the market grapples with significant challenges that hinder expansion and market entry. Stringent Therapeutic Goods Administration (TGA) regulations impose lengthy, costly approval processes often exceeding AUD 95,000 for Class III devices with phased compliance rollouts into 2026 creating barriers for innovators and delaying product launches. High development and acquisition costs for advanced technologies limit affordability and accessibility, especially in rural areas, while reimbursement hurdles from schemes like the Pharmaceutical Benefits Scheme (PBS) complicate market penetration for novel devices. Intense competition from major players like Becton Dickinson and Novartis, coupled with low awareness among healthcare providers and patients about benefits like reduced needless-stick injuries, slows adoption rates. Additionally, supply chain vulnerabilities, as seen in ongoing GLP-1 shortages like Ozempic into 2025, and the need for specialized manufacturing heighten risks in this capital-intensive sector.
Australia Drug Delivery Devices Market: Key Segments
Type of Product
- Inhalers
- Injection Devices
- Transdermal Patches
Application Area
- Oncology
- Infectious Diseases
- Respiratory Diseases
- Diabetes
End User
- Hospitals
- Diagnostic Centers
- Home Care Settings
- Others
Example Players in the Australia Drug Delivery Devices Market
- AbbVie
- Bayer
- Becton Dickinson and Company
- GlaxoSmithKline
- Johnson & Johnson
- Novartis
- Novo Nordisk
- Pfizer
- Sanofi
- SiBiono GeneTech
- Teva Pharmaceutical Industries
- Viatris
Key Questions Answered in this Report
- How many drug delivery device developers in Australia are currently engaged in this market?
- Which are the leading companies in this market?
- Which country dominates the Australia drug delivery devices market?
- What are the key trends observed in the Australia drug delivery devices market?
- What factors are likely to influence the evolution of this market?
- What are the primary challenges faced by Australia drug delivery devices market?
- What is the current and future Australia drug delivery devices market size?
- What is the CAGR of Australia drug delivery devices market?
- How is the current and future market opportunity likely to be distributed across key market segments?
Reasons to Buy this Report
- The report provides a comprehensive market analysis, offering detailed revenue projections of the overall market and its specific sub-segments. This information is valuable to both established market leaders and emerging entrants.
- The report offers stakeholders a comprehensive overview of the market, including key drivers, barriers, opportunities, and challenges. This information empowers stakeholders to stay abreast of market trends and make data-driven decisions to capitalize on growth prospects.
- The report can aid businesses in identifying future opportunities in any sector. It also helps in understanding if those opportunities are worth pursuing.
- The report helps in identifying customer demand by understanding the needs, preferences, and behavior of the target audience in order to tailor products or services effectively.
- The report equips new entrants with requisite information regarding a particular market to help them build successful business strategies.
- The report allows for more effective communication with the audience and in building strong business relations.
Complementary Benefits
- Complimentary Excel Data Packs for all Analytical Modules in the Report
- 15% Free Content Customization
- Detailed Report Walkthrough Session with Research Team
- Free Updated report if the report is 6-12 months old or older
TABLE OF CONTENTS
1. PREFACE
- 1.1. Introduction
- 1.2. Market Share Insights
- 1.3. Key Market Insights
- 1.4. Report Coverage
- 1.5. Key Questions Answered
- 1.6. Chapter Outlines
2. RESEARCH METHODOLOGY
- 2.1. Chapter Overview
- 2.2. Research Assumptions
- 2.2.1. Market Landscape and Market Trends
- 2.2.2. Market Forecast and Opportunity Analysis
- 2.2.3. Comparative Analysis
- 2.3. Database Building
- 2.3.1. Data Collection
- 2.3.2. Data Validation
- 2.3.3. Data Analysis
- 2.4. Project Methodology
- 2.4.1. Secondary Research
- 2.4.1.1. Annual Reports
- 2.4.1.2. Academic Research Papers
- 2.4.1.3. Company Websites
- 2.4.1.4. Investor Presentations
- 2.4.1.5. Regulatory Filings
- 2.4.1.6. White Papers
- 2.4.1.7. Industry Publications
- 2.4.1.8. Conferences and Seminars
- 2.4.1.9. Government Portals
- 2.4.1.10. Media and Press Releases
- 2.4.1.11. Newsletters
- 2.4.1.12. Industry Databases
- 2.4.1.13. Roots Proprietary Databases
- 2.4.1.14. Paid Databases and Sources
- 2.4.1.15. Social Media Portals
- 2.4.1.16. Other Secondary Sources
- 2.4.2. Primary Research
- 2.4.2.1. Types of Primary Research
- 2.4.2.1.1. Qualitative Research
- 2.4.2.1.2. Quantitative Research
- 2.4.2.1.3. Hybrid Approach
- 2.4.2.2. Advantages of Primary Research
- 2.4.2.3. Techniques for Primary Research
- 2.4.2.3.1. Interviews
- 2.4.2.3.2. Surveys
- 2.4.2.3.3. Focus Groups
- 2.4.2.3.4. Observational Research
- 2.4.2.3.5. Social Media Interactions
- 2.4.2.4. Key Opinion Leaders Considered in Primary Research
- 2.4.2.4.1. Company Executives (CXOs)
- 2.4.2.4.2. Board of Directors
- 2.4.2.4.3. Company Presidents and Vice Presidents
- 2.4.2.4.4. Research and Development Heads
- 2.4.2.4.5. Technical Experts
- 2.4.2.4.6. Subject Matter Experts
- 2.4.2.4.7. Scientists
- 2.4.2.4.8. Doctors and Other Healthcare Providers
- 2.4.2.5. Ethics and Integrity
- 2.4.2.5.1. Research Ethics
- 2.4.2.5.2. Data Integrity
- 2.4.2.1. Types of Primary Research
- 2.4.3. Analytical Tools and Databases
- 2.4.1. Secondary Research
- 2.5. Robust Quality Control
3. MARKET DYNAMICS
- 3.1. Chapter Overview
- 3.2. Forecast Methodology
- 3.2.1. Top-down Approach
- 3.2.2. Bottom-up Approach
- 3.2.3. Hybrid Approach
- 3.3. Market Assessment Framework
- 3.3.1. Total Addressable Market (TAM)
- 3.3.2. Serviceable Addressable Market (SAM)
- 3.3.3. Serviceable Obtainable Market (SOM)
- 3.3.4. Currently Acquired Market (CAM)
- 3.4. Forecasting Tools and Techniques
- 3.4.1. Qualitative Forecasting
- 3.4.2. Correlation
- 3.4.3. Regression
- 3.4.4. Extrapolation
- 3.4.5. Convergence
- 3.4.6. Sensitivity Analysis
- 3.4.7. Scenario Planning
- 3.4.8. Data Visualization
- 3.4.9. Time Series Analysis
- 3.4.10. Forecast Error Analysis
- 3.5. Key Considerations
- 3.5.1. Demographics
- 3.5.2. Government Regulations
- 3.5.3. Reimbursement Scenarios
- 3.5.4. Market Access
- 3.5.5. Supply Chain
- 3.5.6. Industry Consolidation
- 3.5.7. Pandemic / Unforeseen Disruptions Impact
- 3.6. Limitations
4. MACRO-ECONOMIC INDICATORS
- 4.1. Chapter Overview
- 4.2. Market Dynamics
- 4.2.1. Time Period
- 4.2.1.1. Historical Trends
- 4.2.1.2. Current and Forecasted Estimates
- 4.2.2. Currency Coverage
- 4.2.2.1. Major Currencies Affecting the Market
- 4.2.2.2. Factors Affecting Currency Fluctuations on the Industry
- 4.2.2.3. Impact of Currency Fluctuations on the Industry
- 4.2.3. Foreign Currency Exchange Rate
- 4.2.3.1. Impact of Foreign Exchange Rate Volatility on the Market
- 4.2.3.2. Strategies for Mitigating Foreign Exchange Risk
- 4.2.4. Recession
- 4.2.4.1. Assessment of Current Economic Conditions and Potential Impact on the Market
- 4.2.4.2. Historical Analysis of Past Recessions and Lessons Learnt
- 4.2.5. Inflation
- 4.2.5.1. Measurement and Analysis of Inflationary Pressures in the Economy
- 4.2.5.2. Potential Impact of Inflation on the Market Evolution
- 4.2.6. Interest Rates
- 4.2.6.1. Interest Rates and Their Impact on the Market
- 4.2.6.2. Strategies for Managing Interest Rate Risk
- 4.2.7. Commodity Flow Analysis
- 4.2.7.1. Type of Commodity
- 4.2.7.2. Origins and Destinations
- 4.2.7.3. Value and Weights
- 4.2.7.4. Modes of Transportation
- 4.2.8. Global Trade Dynamics
- 4.2.8.1. Import Scenario
- 4.2.8.2. Export Scenario
- 4.2.8.3. Trade Policies
- 4.2.8.4. Strategies for Mitigating the Risks Associated with Trade Barriers
- 4.2.8.5. Impact of Trade Barriers on the Market
- 4.2.9. War Impact Analysis
- 4.2.9.1. Russian-Ukraine War
- 4.2.9.2. Israel-Hamas War
- 4.2.10. COVID Impact / Related Factors
- 4.2.10.1. Global Economic Impact
- 4.2.10.2. Industry-specific Impact
- 4.2.10.3. Government Response and Stimulus Measures
- 4.2.10.4. Future Outlook and Adaptation Strategies
- 4.2.11. Other Indicators
- 4.2.11.1. Fiscal Policy
- 4.2.11.2. Consumer Spending
- 4.2.11.3. Gross Domestic Product (GDP)
- 4.2.11.4. Employment
- 4.2.11.5. Taxes
- 4.2.11.6. Stock Market Performance
- 4.2.11.7. Cross-Border Dynamics
- 4.2.1. Time Period
- 4.3. Conclusion
5. EXECUTIVE SUMMARY
6. INTRODUCTION
- 6.1. Chapter Overview
- 6.2. Overview of Drug Delivery Devices
- 6.3. Key Design Features and Development Process
- 6.4. Classification of Connected / Smart Drug Delivery Devices
- 6.5. Type of Device
- 6.6. Regulatory Guidelines for Drug Delivery Devices
- 6.7. Advantages and Limitations of Drug Delivery Devices
- 6.8. Future Perspective
7. MARKET LANDSCAPE
- 7.1. Chapter Overview
- 7.2. Australia Drug Delivery Devices Market: Overall Market Landscape
- 7.2.1. Analysis by Year of Establishment
- 7.2.2. Analysis by Company Size
- 7.2.3. Analysis by Location of Headquarters
- 7.2.4. Analysis by Stage of Development
- 7.2.5. Analysis by Type of Device
- 7.2.6. Analysis by Therapeutic Area
8. COMPANY PROFILES: AUSTRALIA DRUG DELIVERY DEVICES MARKET
- 8.1. Chapter Overview
- 8.2. Becton Dickinson and Company
- 8.2.1. Company Overview
- 8.2.2. Product Portfolio
- 8.2.3. Financial Information
- 8.2.4. Recent Developments and Future Outlook
- 8.3. SiBiono GeneTech
- 8.4. Bayer
- 8.5. Novartis
- 8.6. GlaxoSmithKline
- 8.7. Teva Pharmaceutical Industries
- 8.8. AbbVie
- 8.9. Novo Nordisk
- 8.10. Johnson & Johnson
- 8.11. Sanofi
- 8.12. Viatris
- 8.13. Pfizer
9. PARTNERSHIPS AND COLLABORATIONS
- 9.1. Chapter Overview
- 9.2. Partnership Models
- 9.3. Australia Drug Delivery Devices Market: Partnerships and Collaborations
- 9.3.1. Analysis by Year of Partnership
- 9.3.2. Analysis by Type of Partnership
- 9.3.3. Most Active Players: Analysis by Number of Partnerships
- 9.3.4. Analysis by Geography
- 9.3.4.1. Intercontinental and Intracontinental Agreements
- 9.3.4.2. Local and International Agreements
10. MARKET IMPACT ANALYSIS
- 10.1. Chapter Overview
- 10.2. Market Drivers
- 10.3. Market Restraints
- 10.4. Market Opportunities
- 10.5. Market Challenges
- 10.6. Conclusion
11. AUSTRALIA DRUG DELIVERY DEVICES MARKET
- 11.1. Chapter Overview
- 11.2. Key Assumptions and Methodology
- 11.3. Australia Drug Delivery Devices Market: Historical Trends (Since 2023) and Forecasted Estimates (Till 2035)
- 11.4. Roots Analysis Perspective on Market Growth
- 11.5 Scenario Analysis
- 11.5.1. Conservative Scenario
- 11.5.2. Optimistic Scenario
- 11.6. Key Market Segmentations
12. AUSTRALIA DRUG DELIVERY DEVICES MARKET, BY TYPE OF PRODUCT
- 12.1. Chapter Overview
- 12.2. Key Assumptions and Methodology
- 12.3. Australia Drug Delivery Devices Market: Distribution by Type of Product
- 12.3.1. Inhalers, Historical Trends (Since 2023) and Forecasted (Till 2035)
- 12.3.2. Injection Devices, Historical Trends (Since 2023) and Forecasted Estimates (Till 2035)
- 12.3.3. Transdermal Patches, Historical Trends (Since 2023) and Forecasted Estimates (Till 2035)
- 12.4. Data Triangulation and Validation
13. AUSTRALIA DRUG DELIVERY DEVICES MARKET, BY APPLICATION AREA
- 13.1. Chapter Overview
- 13.2. Assumptions and Methodology
- 13.3. Australia Drug Delivery Devices Market: Distribution by Application Area
- 13.3.1 Oncology: Historical Trends (Since 2023) and Forecasted Estimates (Till 2035)
- 13.3.2. Infectious Diseases: Historical Trends (Since 2023) and Forecasted Estimates (Till 2035)
- 13.3.3. Respiratory Diseases: Historical Trends (Since 2023) and Forecasted Estimates (Till 2035)
- 13.3.4. Diabetes: Historical Trends (Since 2023) and Forecasted Estimates (Till 2035)
- 13.4. Data Triangulation and Validation
14. AUSTRALIA DRUG DELIVERY DEVICES MARKET, BY END USER
- 14.1. Chapter Overview
- 14.2. Assumptions and Methodology
- 14.3. Australia Drug Delivery Devices Market: Distribution by End User
- 14.3.1 Hospitals: Historical Trends (Since 2023) and Forecasted Estimates (Till 2035)
- 14.3.2. Surgery Centers / Clinics: Historical Trends (Since 2023) and Forecasted Estimates (Till 2035)
- 14.3.3. Home Care Settings: Historical Trends (Since 2023) and Forecasted Estimates (Till 2035)
- 14.3.4. Others: Historical Trends (Since 2023) and Forecasted Estimates (Till 2035)
- 14.4. Data Triangulation and Validation
15. CONCLUDING REMARKS
16. APPENDIX I: TABULATED DATA
17. APPENDIX II: LIST OF COMPANIES AND ORGANIZATIONS
 2026年全球药物与基因递送设备市场报告2026年全球药物传输设备市场报告
 日本药物输送装置市场报告(按给药途径、应用、最终用户和地区划分,2026-2034年)
 药物输送装置市场规模、份额和成长分析(按给药途径、应用、最终用途和地区划分)-2026-2033年产业预测
 全球药物输送装置市场:依给药途径、应用、最终用户和地区划分 - 市场规模、行业趋势、机会分析和预测(2026-2035 年)
 药物输送装置市场规模、份额和趋势分析报告:按产品、应用、最终用途、地区和细分市场预测(2026-2033 年)
 药物输送装置市场-全球产业规模、份额、趋势、机会和预测,按应用、给药途径、最终用户、地区和竞争格局划分,2020-2030年预测
 药物输送装置-市场趋势、竞争格局与市场预测(2032 年)
 口腔喷雾泵市场按产品类型、材料类型、填充量、最终用户和分销管道划分-2025-2030 年全球预测
 全球COVID-19药物输送装置市场