


 |
市场调查报告书
商品编码
1365767
驾驶模拟器市场:按应用、车辆类型、模拟器类型:2023-2032 年全球机会分析与产业预测Driving Simulator Market By Application, By Vehicle Type, By Simulator Type : Global Opportunity Analysis and Industry Forecast, 2023-2032 |
||||||
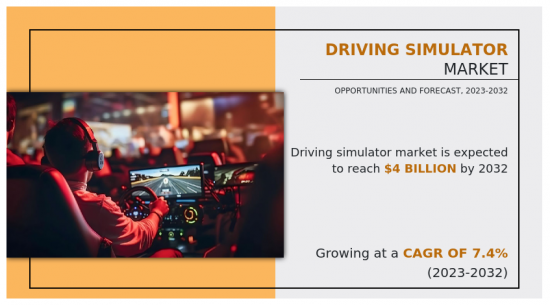
由于自动驾驶汽车测试和开发的需求不断增加,驾驶模拟器市场预计从 2023 年到 2032 年将大幅成长 7.4%。
当实体原型不可用时,驾驶模拟在自动驾驶汽车开发的早期阶段至关重要。模拟允许研究人员和工程师在安全的虚拟环境中尝试不同的感测器组合、控制演算法和软体组件。此外,DIL(驾驶员在环)模拟器的开发填补了离线模拟和现实世界评估之间的空白。 DIL 模拟器是一种「闭环」方式,可让真人直接参与离线车辆模拟,在人类和模拟车辆体验之间建立直接联繫。
此外,科技公司正在开发基于 DIL 的先进模拟器,以满足汽车公司的需求。例如,英国Ansible Motion 推出了 Delta 系列 S3 DIL 模拟器,这是一款先进的高性能动态驾驶模拟器。这款创新模拟器满足了道路和赛车场景中对高保真、人性化的车辆模拟日益增长的需求。它由本田研发部、宝马和澳洲迪肯大学共同开发。因此,多功能且先进的DIL模拟器满足了各行业的需求,受到汽车公司的兴趣。这为预测期内的驾驶模拟器提供者提供了机会。
此外,汽车学校正在利用人工智慧来监控驾驶员的驾驶情况。例如,2021年11月,杜拜开设了一个由人工智慧驱动的新驾驶中心,以提高驾驶技能并降低事故风险。这家私立汽车学校利用人工智慧技术来评估和提高驾驶员的表现。
目录
第1章简介
第2章执行摘要
第3章市场概况
- 市场定义和范围
- 主要发现
- 影响因素
- 主要投资机会
- 波特五力分析
- 市场动态
- 促进因素
- 自动驾驶汽车测试和开发需求快速成长
- 比传统方法更具成本效益的培训解决方案
- 整合到驾驶模拟器中
- 抑制因素
- 模拟器的初始成本较高
- 缺乏实务经验
- 机会
- 采用虚拟实境 (VR) 和扩增实境 (AR)
- 驾驶员在环(DIL)模拟器的开发
- 促进因素
- COVID-19 市场影响分析
第4章驾驶模拟器市场:依应用分类
- 概述
- 训练
- 研究和测试
- 娱乐
第5章驾驶模拟器市场:依车型分类
- 概述
- 汽车模拟器
- 卡车巴士模拟器
第6章驾驶模拟器市场:依模拟器类型
- 概述
- 训练模拟器
- 先进的驾驶模拟器
第7章驾驶模拟器市场:依地区
- 概述
- 北美洲
- 美国
- 加拿大
- 墨西哥
- 欧洲
- 德国
- 法国
- 义大利
- 英国
- 其他的
- 亚太地区
- 中国
- 日本
- 印度
- 韩国
- 其他的
- 拉丁美洲
- 拉丁美洲
- 中东
- 非洲
第8章竞争形势
- 介绍
- 关键成功策略
- 10家主要企业产品图谱
- 竞争仪表板
- 竞争热图
- 2022年主要企业定位
第9章公司简介
- AB Dynamics PLC
- AVSimulation
- Cruden
- CXC SIMULATIONS
- Hottinger Brel & Kjr(HBK)
- Moog Inc.
- Tecknotrove
- Thales
- Arotech Corporation
- Exail Technologies(former GROUPE GORGE)
The Driving Simulator Market is expected to experience a significant growth rate of 7.4% from 2023 to 2032 owing to rise in demand of testing and development of autonomous vehicle - Allied Market Research
Driving simulations are critical in the early stages of autonomous vehicle development when physical prototypes are unavailable. They allow researchers and engineers to experiment with various sensor combinations, control algorithms, and software components in a safe and virtual environment. Moreover, Driver-in-the-Loop (DIL) simulators have evolved to help fill this void between off-line simulations and real-world assessments. By allowing a real person to "close the loop" and thus be directly involved in what would otherwise be an off-line vehicle simulation, a DIL simulator is effectively a way to create a direct connection between a human being and a simulated vehicle experience.
Furthermore, advanced DIL based simulator is developed by tech companies to fulfil the demand of automotive companies. For instance, in UK-based Ansible Motion introduced its production Delta series S3 DIL simulator, which is advanced and high-performance dynamic driving simulator. This innovative simulator meets the increasing need for high-fidelity, human-centric vehicle simulations in road and motorsport scenarios. Honda R&D, BMW and Deakin University in Australia. Therefore, versatile and advanced DIL simulators meet various industry needs and attract interest from automotive companies. This provides opportunity for driving simulator providers during forecast period.
Moreover, driving school utilized the AI for monitoring the driver during ride. For instance, in November 2021, new artificial intelligence-based driving hub launched in Dubai to enhance driver skills and reduce accident risks. This private driving institute will utilize AI technology to evaluate and improve performance of drivers.
In addition, the car simulation systems are expected to be installed in the near future to test the driver and to recognize the untrained drives. For instance, in December 2022, Delhi's transport commissioner stated that the installation of the driving simulator at the regional transport office (RTO) will be the next big technological push and soon people will be able to give their driving test in the driving simulators. Similarly in Singapore, from 2019 it is mandatory for learners to attend and clear the driver simulator training before appearing in the practical driving and riding test. These developments indicate the upcoming demand for the driving simulator and shows its upscale growth in the market.
Furthermore, driving simulators provide a controlled environment in which new vehicle features, systems, and technologies can be tested and refined before being implemented on public roads. Furthermore, Europe is an important center for automotive research and development. Driving simulators are essential for testing and evaluating new technologies such as autonomous automobiles, advanced driver assistance systems (ADAS), and electric vehicles.
Moreover, major automotive simulation providers have launched new products to expand the market presence. For instance, in June 2022, Hottinger Brel & Kjar (HBK) through its subsidiary VI-grade launched software products for real-time simulation and driving simulators. It includes product updates and several usability enhancements for VI-CarRealTime, VI-WorldSim, VI-DriveSim and for the whole NVH Simulator product suite.
The global driving simulator market is segmented into simulator type, application, vehicle type, and region. Depending on application, it is fragmented into training, research & testing, and entertainment. By vehicle type, it is categorized into car simulators and truck & bus simulators. On the basis of simulator type, the market is segregated into training simulator and advanced driving simulator. Region wise, the market is analyzed across North America, Europe, Asia-Pacific, and LAMEA.
The key players profiled in the report include: Cruden, Tecknotrove, Hottinger Brel & Kjr (HBK), AVSimulation, CXC Simulations, Thales, Arotech Corporation, Exail Technologies (former GROUPE GORGE), Moog Inc., and AB Dynamics PLC. The leading companies adopt strategies such as product launch, partnership, acquisition, expansion, and collaboration to strengthen their market position.
Key Benefits For Stakeholders
- This report provides a quantitative analysis of the market segments, current trends, estimations, and dynamics of the driving simulator market analysis from 2022 to 2032 to identify the prevailing driving simulator market opportunities.
- The market research is offered along with information related to key drivers, restraints, and opportunities.
- Porter's five forces analysis highlights the potency of buyers and suppliers to enable stakeholders make profit-oriented business decisions and strengthen their supplier-buyer network.
- In-depth analysis of the driving simulator market segmentation assists to determine the prevailing market opportunities.
- Major countries in each region are mapped according to their revenue contribution to the global market.
- Market player positioning facilitates benchmarking and provides a clear understanding of the present position of the market players.
- The report includes the analysis of the regional as well as global driving simulator market trends, key players, market segments, application areas, and market growth strategies.
Additional benefits you will get with this purchase are:
- Quarterly Update and* (only available with a corporate license, on listed price)
- 5 additional Company Profile of client Choice pre- or Post-purchase, as a free update.
- Free Upcoming Version on the Purchase of Five and Enterprise User License.
- 16 analyst hours of support* (post-purchase, if you find additional data requirements upon review of the report, you may receive support amounting to 16 analyst hours to solve questions, and post-sale queries)
- 15% Free Customization* (in case the scope or segment of the report does not match your requirements, 20% is equivalent to 3 working days of free work, applicable once)
- Free data Pack on the Five and Enterprise User License. (Excel version of the report)
- Free Updated report if the report is 6-12 months old or older.
- 24-hour priority response*
- Free Industry updates and white papers.
Possible Customization with this report (with additional cost and timeline talk to the sales executive to know more)
- Additional company profiles with specific to client's interest
- Expanded list for Company Profiles
- SWOT Analysis
Key Market Segments
By Application
- Training
- Research and Testing
- Entertainment
By Vehicle Type
- Car Simulator
- Truck and Bus Simulator
By Simulator Type
- Training Simulator
- Advanced Driving Simulator
By Region
- North America
- U.S.
- Canada
- Mexico
- Europe
- Germany
- France
- Italy
- UK
- Rest of Europe
- Asia-Pacific
- China
- Japan
- India
- South Korea
- Rest of Asia-Pacific
- LAMEA
- Latin America
- Middle East
- Africa
Key Market Players:
- Cruden
- Tecknotrove
- Hottinger Brel & Kjr (HBK)
- AVSimulation
- CXC SIMULATIONS
- Thales
- Arotech Corporation
- Moog Inc.
- AB Dynamics PLC
- Exail Technologies (former GROUPE GORGE)
TABLE OF CONTENTS
CHAPTER 1: INTRODUCTION
- 1.1. Report description
- 1.2. Key market segments
- 1.3. Key benefits to the stakeholders
- 1.4. Research Methodology
- 1.4.1. Primary research
- 1.4.2. Secondary research
- 1.4.3. Analyst tools and models
CHAPTER 2: EXECUTIVE SUMMARY
- 2.1. CXO Perspective
CHAPTER 3: MARKET OVERVIEW
- 3.1. Market definition and scope
- 3.2. Key findings
- 3.2.1. Top impacting factors
- 3.2.2. Top investment pockets
- 3.3. Porter's five forces analysis
- 3.3.1. Moderate bargaining power of suppliers
- 3.3.2. Low threat of new entrants
- 3.3.3. Low threat of substitutes
- 3.3.4. Low intensity of rivalry
- 3.3.5. Low bargaining power of buyers
- 3.4. Market dynamics
- 3.4.1. Drivers
- 3.4.1.1. Surge in demand of testing and development of autonomous vehicle
- 3.4.1.2. Cost effective training solution over traditional method
- 3.4.1.3. Integration of AI and IoT in driving simulators
- 3.4.1. Drivers
- 3.4.2. Restraints
- 3.4.2.1. High initial cost of simulators
- 3.4.2.2. The lack of the real-world experience
- 3.4.3. Opportunities
- 3.4.3.1. Adoption of virtual reality (VR) and augmented reality (AR)
- 3.4.3.2. Development of Driver-in-the-Loop (DIL) simulators
- 3.5. COVID-19 Impact Analysis on the market
CHAPTER 4: DRIVING SIMULATOR MARKET, BY APPLICATION
- 4.1. Overview
- 4.1.1. Market size and forecast
- 4.2. Training
- 4.2.1. Key market trends, growth factors and opportunities
- 4.2.2. Market size and forecast, by region
- 4.2.3. Market share analysis by country
- 4.3. Research and Testing
- 4.3.1. Key market trends, growth factors and opportunities
- 4.3.2. Market size and forecast, by region
- 4.3.3. Market share analysis by country
- 4.4. Entertainment
- 4.4.1. Key market trends, growth factors and opportunities
- 4.4.2. Market size and forecast, by region
- 4.4.3. Market share analysis by country
CHAPTER 5: DRIVING SIMULATOR MARKET, BY VEHICLE TYPE
- 5.1. Overview
- 5.1.1. Market size and forecast
- 5.2. Car Simulator
- 5.2.1. Key market trends, growth factors and opportunities
- 5.2.2. Market size and forecast, by region
- 5.2.3. Market share analysis by country
- 5.3. Truck and Bus Simulator
- 5.3.1. Key market trends, growth factors and opportunities
- 5.3.2. Market size and forecast, by region
- 5.3.3. Market share analysis by country
CHAPTER 6: DRIVING SIMULATOR MARKET, BY SIMULATOR TYPE
- 6.1. Overview
- 6.1.1. Market size and forecast
- 6.2. Training Simulator
- 6.2.1. Key market trends, growth factors and opportunities
- 6.2.2. Market size and forecast, by region
- 6.2.3. Market share analysis by country
- 6.3. Advanced Driving Simulator
- 6.3.1. Key market trends, growth factors and opportunities
- 6.3.2. Market size and forecast, by region
- 6.3.3. Market share analysis by country
CHAPTER 7: DRIVING SIMULATOR MARKET, BY REGION
- 7.1. Overview
- 7.1.1. Market size and forecast By Region
- 7.2. North America
- 7.2.1. Key market trends, growth factors and opportunities
- 7.2.2. Market size and forecast, by Application
- 7.2.3. Market size and forecast, by Vehicle Type
- 7.2.4. Market size and forecast, by Simulator Type
- 7.2.5. Market size and forecast, by country
- 7.2.5.1. U.S.
- 7.2.5.1.1. Market size and forecast, by Application
- 7.2.5.1.2. Market size and forecast, by Vehicle Type
- 7.2.5.1.3. Market size and forecast, by Simulator Type
- 7.2.5.2. Canada
- 7.2.5.2.1. Market size and forecast, by Application
- 7.2.5.2.2. Market size and forecast, by Vehicle Type
- 7.2.5.2.3. Market size and forecast, by Simulator Type
- 7.2.5.3. Mexico
- 7.2.5.3.1. Market size and forecast, by Application
- 7.2.5.3.2. Market size and forecast, by Vehicle Type
- 7.2.5.3.3. Market size and forecast, by Simulator Type
- 7.3. Europe
- 7.3.1. Key market trends, growth factors and opportunities
- 7.3.2. Market size and forecast, by Application
- 7.3.3. Market size and forecast, by Vehicle Type
- 7.3.4. Market size and forecast, by Simulator Type
- 7.3.5. Market size and forecast, by country
- 7.3.5.1. Germany
- 7.3.5.1.1. Market size and forecast, by Application
- 7.3.5.1.2. Market size and forecast, by Vehicle Type
- 7.3.5.1.3. Market size and forecast, by Simulator Type
- 7.3.5.2. France
- 7.3.5.2.1. Market size and forecast, by Application
- 7.3.5.2.2. Market size and forecast, by Vehicle Type
- 7.3.5.2.3. Market size and forecast, by Simulator Type
- 7.3.5.3. Italy
- 7.3.5.3.1. Market size and forecast, by Application
- 7.3.5.3.2. Market size and forecast, by Vehicle Type
- 7.3.5.3.3. Market size and forecast, by Simulator Type
- 7.3.5.4. UK
- 7.3.5.4.1. Market size and forecast, by Application
- 7.3.5.4.2. Market size and forecast, by Vehicle Type
- 7.3.5.4.3. Market size and forecast, by Simulator Type
- 7.3.5.5. Rest of Europe
- 7.3.5.5.1. Market size and forecast, by Application
- 7.3.5.5.2. Market size and forecast, by Vehicle Type
- 7.3.5.5.3. Market size and forecast, by Simulator Type
- 7.4. Asia-Pacific
- 7.4.1. Key market trends, growth factors and opportunities
- 7.4.2. Market size and forecast, by Application
- 7.4.3. Market size and forecast, by Vehicle Type
- 7.4.4. Market size and forecast, by Simulator Type
- 7.4.5. Market size and forecast, by country
- 7.4.5.1. China
- 7.4.5.1.1. Market size and forecast, by Application
- 7.4.5.1.2. Market size and forecast, by Vehicle Type
- 7.4.5.1.3. Market size and forecast, by Simulator Type
- 7.4.5.2. Japan
- 7.4.5.2.1. Market size and forecast, by Application
- 7.4.5.2.2. Market size and forecast, by Vehicle Type
- 7.4.5.2.3. Market size and forecast, by Simulator Type
- 7.4.5.3. India
- 7.4.5.3.1. Market size and forecast, by Application
- 7.4.5.3.2. Market size and forecast, by Vehicle Type
- 7.4.5.3.3. Market size and forecast, by Simulator Type
- 7.4.5.4. South Korea
- 7.4.5.4.1. Market size and forecast, by Application
- 7.4.5.4.2. Market size and forecast, by Vehicle Type
- 7.4.5.4.3. Market size and forecast, by Simulator Type
- 7.4.5.5. Rest of Asia-Pacific
- 7.4.5.5.1. Market size and forecast, by Application
- 7.4.5.5.2. Market size and forecast, by Vehicle Type
- 7.4.5.5.3. Market size and forecast, by Simulator Type
- 7.5. LAMEA
- 7.5.1. Key market trends, growth factors and opportunities
- 7.5.2. Market size and forecast, by Application
- 7.5.3. Market size and forecast, by Vehicle Type
- 7.5.4. Market size and forecast, by Simulator Type
- 7.5.5. Market size and forecast, by country
- 7.5.5.1. Latin America
- 7.5.5.1.1. Market size and forecast, by Application
- 7.5.5.1.2. Market size and forecast, by Vehicle Type
- 7.5.5.1.3. Market size and forecast, by Simulator Type
- 7.5.5.2. Middle East
- 7.5.5.2.1. Market size and forecast, by Application
- 7.5.5.2.2. Market size and forecast, by Vehicle Type
- 7.5.5.2.3. Market size and forecast, by Simulator Type
- 7.5.5.3. Africa
- 7.5.5.3.1. Market size and forecast, by Application
- 7.5.5.3.2. Market size and forecast, by Vehicle Type
- 7.5.5.3.3. Market size and forecast, by Simulator Type
CHAPTER 8: COMPETITIVE LANDSCAPE
- 8.1. Introduction
- 8.2. Top winning strategies
- 8.3. Product Mapping of Top 10 Player
- 8.4. Competitive Dashboard
- 8.5. Competitive Heatmap
- 8.6. Top player positioning, 2022
CHAPTER 9: COMPANY PROFILES
- 9.1. AB Dynamics PLC
- 9.1.1. Company overview
- 9.1.2. Key Executives
- 9.1.3. Company snapshot
- 9.1.4. Operating business segments
- 9.1.5. Product portfolio
- 9.1.6. Business performance
- 9.1.7. Key strategic moves and developments
- 9.2. AVSimulation
- 9.2.1. Company overview
- 9.2.2. Key Executives
- 9.2.3. Company snapshot
- 9.2.4. Operating business segments
- 9.2.5. Product portfolio
- 9.3. Cruden
- 9.3.1. Company overview
- 9.3.2. Key Executives
- 9.3.3. Company snapshot
- 9.3.4. Operating business segments
- 9.3.5. Product portfolio
- 9.3.6. Key strategic moves and developments
- 9.4. CXC SIMULATIONS
- 9.4.1. Company overview
- 9.4.2. Key Executives
- 9.4.3. Company snapshot
- 9.4.4. Operating business segments
- 9.4.5. Product portfolio
- 9.4.6. Key strategic moves and developments
- 9.5. Hottinger Brel & Kjr (HBK)
- 9.5.1. Company overview
- 9.5.2. Key Executives
- 9.5.3. Company snapshot
- 9.5.4. Operating business segments
- 9.5.5. Product portfolio
- 9.5.6. Key strategic moves and developments
- 9.6. Moog Inc.
- 9.6.1. Company overview
- 9.6.2. Key Executives
- 9.6.3. Company snapshot
- 9.6.4. Operating business segments
- 9.6.5. Product portfolio
- 9.6.6. Business performance
- 9.7. Tecknotrove
- 9.7.1. Company overview
- 9.7.2. Key Executives
- 9.7.3. Company snapshot
- 9.7.4. Operating business segments
- 9.7.5. Product portfolio
- 9.8. Thales
- 9.8.1. Company overview
- 9.8.2. Key Executives
- 9.8.3. Company snapshot
- 9.8.4. Operating business segments
- 9.8.5. Product portfolio
- 9.8.6. Business performance
- 9.8.7. Key strategic moves and developments
- 9.9. Arotech Corporation
- 9.9.1. Company overview
- 9.9.2. Key Executives
- 9.9.3. Company snapshot
- 9.9.4. Operating business segments
- 9.9.5. Product portfolio
- 9.9.6. Key strategic moves and developments
- 9.10. Exail Technologies (former GROUPE GORGE)
- 9.10.1. Company overview
- 9.10.2. Key Executives
- 9.10.3. Company snapshot
- 9.10.4. Operating business segments
- 9.10.5. Product portfolio
LIST OF TABLES
- TABLE 01. GLOBAL DRIVING SIMULATOR MARKET, BY APPLICATION, 2022-2032 ($MILLION)
- TABLE 02. DRIVING SIMULATOR MARKET FOR TRAINING, BY REGION, 2022-2032 ($MILLION)
- TABLE 03. DRIVING SIMULATOR MARKET FOR RESEARCH AND TESTING, BY REGION, 2022-2032 ($MILLION)
- TABLE 04. DRIVING SIMULATOR MARKET FOR ENTERTAINMENT, BY REGION, 2022-2032 ($MILLION)
- TABLE 05. GLOBAL DRIVING SIMULATOR MARKET, BY VEHICLE TYPE, 2022-2032 ($MILLION)
- TABLE 06. DRIVING SIMULATOR MARKET FOR CAR SIMULATOR, BY REGION, 2022-2032 ($MILLION)
- TABLE 07. DRIVING SIMULATOR MARKET FOR TRUCK AND BUS SIMULATOR, BY REGION, 2022-2032 ($MILLION)
- TABLE 08. GLOBAL DRIVING SIMULATOR MARKET, BY SIMULATOR TYPE, 2022-2032 ($MILLION)
- TABLE 09. DRIVING SIMULATOR MARKET FOR TRAINING SIMULATOR, BY REGION, 2022-2032 ($MILLION)
- TABLE 10. DRIVING SIMULATOR MARKET FOR ADVANCED DRIVING SIMULATOR, BY REGION, 2022-2032 ($MILLION)
- TABLE 11. DRIVING SIMULATOR MARKET, BY REGION, 2022-2032 ($MILLION)
- TABLE 12. NORTH AMERICA DRIVING SIMULATOR MARKET, BY APPLICATION, 2022-2032 ($MILLION)
- TABLE 13. NORTH AMERICA DRIVING SIMULATOR MARKET, BY VEHICLE TYPE, 2022-2032 ($MILLION)
- TABLE 14. NORTH AMERICA DRIVING SIMULATOR MARKET, BY SIMULATOR TYPE, 2022-2032 ($MILLION)
- TABLE 15. NORTH AMERICA DRIVING SIMULATOR MARKET, BY COUNTRY, 2022-2032 ($MILLION)
- TABLE 16. U.S. DRIVING SIMULATOR MARKET, BY APPLICATION, 2022-2032 ($MILLION)
- TABLE 17. U.S. DRIVING SIMULATOR MARKET, BY VEHICLE TYPE, 2022-2032 ($MILLION)
- TABLE 18. U.S. DRIVING SIMULATOR MARKET, BY SIMULATOR TYPE, 2022-2032 ($MILLION)
- TABLE 19. CANADA DRIVING SIMULATOR MARKET, BY APPLICATION, 2022-2032 ($MILLION)
- TABLE 20. CANADA DRIVING SIMULATOR MARKET, BY VEHICLE TYPE, 2022-2032 ($MILLION)
- TABLE 21. CANADA DRIVING SIMULATOR MARKET, BY SIMULATOR TYPE, 2022-2032 ($MILLION)
- TABLE 22. MEXICO DRIVING SIMULATOR MARKET, BY APPLICATION, 2022-2032 ($MILLION)
- TABLE 23. MEXICO DRIVING SIMULATOR MARKET, BY VEHICLE TYPE, 2022-2032 ($MILLION)
- TABLE 24. MEXICO DRIVING SIMULATOR MARKET, BY SIMULATOR TYPE, 2022-2032 ($MILLION)
- TABLE 25. EUROPE DRIVING SIMULATOR MARKET, BY APPLICATION, 2022-2032 ($MILLION)
- TABLE 26. EUROPE DRIVING SIMULATOR MARKET, BY VEHICLE TYPE, 2022-2032 ($MILLION)
- TABLE 27. EUROPE DRIVING SIMULATOR MARKET, BY SIMULATOR TYPE, 2022-2032 ($MILLION)
- TABLE 28. EUROPE DRIVING SIMULATOR MARKET, BY COUNTRY, 2022-2032 ($MILLION)
- TABLE 29. GERMANY DRIVING SIMULATOR MARKET, BY APPLICATION, 2022-2032 ($MILLION)
- TABLE 30. GERMANY DRIVING SIMULATOR MARKET, BY VEHICLE TYPE, 2022-2032 ($MILLION)
- TABLE 31. GERMANY DRIVING SIMULATOR MARKET, BY SIMULATOR TYPE, 2022-2032 ($MILLION)
- TABLE 32. FRANCE DRIVING SIMULATOR MARKET, BY APPLICATION, 2022-2032 ($MILLION)
- TABLE 33. FRANCE DRIVING SIMULATOR MARKET, BY VEHICLE TYPE, 2022-2032 ($MILLION)
- TABLE 34. FRANCE DRIVING SIMULATOR MARKET, BY SIMULATOR TYPE, 2022-2032 ($MILLION)
- TABLE 35. ITALY DRIVING SIMULATOR MARKET, BY APPLICATION, 2022-2032 ($MILLION)
- TABLE 36. ITALY DRIVING SIMULATOR MARKET, BY VEHICLE TYPE, 2022-2032 ($MILLION)
- TABLE 37. ITALY DRIVING SIMULATOR MARKET, BY SIMULATOR TYPE, 2022-2032 ($MILLION)
- TABLE 38. UK DRIVING SIMULATOR MARKET, BY APPLICATION, 2022-2032 ($MILLION)
- TABLE 39. UK DRIVING SIMULATOR MARKET, BY VEHICLE TYPE, 2022-2032 ($MILLION)
- TABLE 40. UK DRIVING SIMULATOR MARKET, BY SIMULATOR TYPE, 2022-2032 ($MILLION)
- TABLE 41. REST OF EUROPE DRIVING SIMULATOR MARKET, BY APPLICATION, 2022-2032 ($MILLION)
- TABLE 42. REST OF EUROPE DRIVING SIMULATOR MARKET, BY VEHICLE TYPE, 2022-2032 ($MILLION)
- TABLE 43. REST OF EUROPE DRIVING SIMULATOR MARKET, BY SIMULATOR TYPE, 2022-2032 ($MILLION)
- TABLE 44. ASIA-PACIFIC DRIVING SIMULATOR MARKET, BY APPLICATION, 2022-2032 ($MILLION)
- TABLE 45. ASIA-PACIFIC DRIVING SIMULATOR MARKET, BY VEHICLE TYPE, 2022-2032 ($MILLION)
- TABLE 46. ASIA-PACIFIC DRIVING SIMULATOR MARKET, BY SIMULATOR TYPE, 2022-2032 ($MILLION)
- TABLE 47. ASIA-PACIFIC DRIVING SIMULATOR MARKET, BY COUNTRY, 2022-2032 ($MILLION)
- TABLE 48. CHINA DRIVING SIMULATOR MARKET, BY APPLICATION, 2022-2032 ($MILLION)
- TABLE 49. CHINA DRIVING SIMULATOR MARKET, BY VEHICLE TYPE, 2022-2032 ($MILLION)
- TABLE 50. CHINA DRIVING SIMULATOR MARKET, BY SIMULATOR TYPE, 2022-2032 ($MILLION)
- TABLE 51. JAPAN DRIVING SIMULATOR MARKET, BY APPLICATION, 2022-2032 ($MILLION)
- TABLE 52. JAPAN DRIVING SIMULATOR MARKET, BY VEHICLE TYPE, 2022-2032 ($MILLION)
- TABLE 53. JAPAN DRIVING SIMULATOR MARKET, BY SIMULATOR TYPE, 2022-2032 ($MILLION)
- TABLE 54. INDIA DRIVING SIMULATOR MARKET, BY APPLICATION, 2022-2032 ($MILLION)
- TABLE 55. INDIA DRIVING SIMULATOR MARKET, BY VEHICLE TYPE, 2022-2032 ($MILLION)
- TABLE 56. INDIA DRIVING SIMULATOR MARKET, BY SIMULATOR TYPE, 2022-2032 ($MILLION)
- TABLE 57. SOUTH KOREA DRIVING SIMULATOR MARKET, BY APPLICATION, 2022-2032 ($MILLION)
- TABLE 58. SOUTH KOREA DRIVING SIMULATOR MARKET, BY VEHICLE TYPE, 2022-2032 ($MILLION)
- TABLE 59. SOUTH KOREA DRIVING SIMULATOR MARKET, BY SIMULATOR TYPE, 2022-2032 ($MILLION)
- TABLE 60. REST OF ASIA-PACIFIC DRIVING SIMULATOR MARKET, BY APPLICATION, 2022-2032 ($MILLION)
- TABLE 61. REST OF ASIA-PACIFIC DRIVING SIMULATOR MARKET, BY VEHICLE TYPE, 2022-2032 ($MILLION)
- TABLE 62. REST OF ASIA-PACIFIC DRIVING SIMULATOR MARKET, BY SIMULATOR TYPE, 2022-2032 ($MILLION)
- TABLE 63. LAMEA DRIVING SIMULATOR MARKET, BY APPLICATION, 2022-2032 ($MILLION)
- TABLE 64. LAMEA DRIVING SIMULATOR MARKET, BY VEHICLE TYPE, 2022-2032 ($MILLION)
- TABLE 65. LAMEA DRIVING SIMULATOR MARKET, BY SIMULATOR TYPE, 2022-2032 ($MILLION)
- TABLE 66. LAMEA DRIVING SIMULATOR MARKET, BY COUNTRY, 2022-2032 ($MILLION)
- TABLE 67. LATIN AMERICA DRIVING SIMULATOR MARKET, BY APPLICATION, 2022-2032 ($MILLION)
- TABLE 68. LATIN AMERICA DRIVING SIMULATOR MARKET, BY VEHICLE TYPE, 2022-2032 ($MILLION)
- TABLE 69. LATIN AMERICA DRIVING SIMULATOR MARKET, BY SIMULATOR TYPE, 2022-2032 ($MILLION)
- TABLE 70. MIDDLE EAST DRIVING SIMULATOR MARKET, BY APPLICATION, 2022-2032 ($MILLION)
- TABLE 71. MIDDLE EAST DRIVING SIMULATOR MARKET, BY VEHICLE TYPE, 2022-2032 ($MILLION)
- TABLE 72. MIDDLE EAST DRIVING SIMULATOR MARKET, BY SIMULATOR TYPE, 2022-2032 ($MILLION)
- TABLE 73. AFRICA DRIVING SIMULATOR MARKET, BY APPLICATION, 2022-2032 ($MILLION)
- TABLE 74. AFRICA DRIVING SIMULATOR MARKET, BY VEHICLE TYPE, 2022-2032 ($MILLION)
- TABLE 75. AFRICA DRIVING SIMULATOR MARKET, BY SIMULATOR TYPE, 2022-2032 ($MILLION)
- TABLE 76. AB DYNAMICS PLC: KEY EXECUTIVES
- TABLE 77. AB DYNAMICS PLC: COMPANY SNAPSHOT
- TABLE 78. AB DYNAMICS PLC: PRODUCT SEGMENTS
- TABLE 79. AB DYNAMICS PLC: PRODUCT PORTFOLIO
- TABLE 80. AB DYNAMICS PLC: KEY STRATERGIES
- TABLE 81. AVSIMULATION: KEY EXECUTIVES
- TABLE 82. AVSIMULATION: COMPANY SNAPSHOT
- TABLE 83. AVSIMULATION: PRODUCT SEGMENTS
- TABLE 84. AVSIMULATION: PRODUCT PORTFOLIO
- TABLE 85. CRUDEN: KEY EXECUTIVES
- TABLE 86. CRUDEN: COMPANY SNAPSHOT
- TABLE 87. CRUDEN: PRODUCT SEGMENTS
- TABLE 88. CRUDEN: PRODUCT PORTFOLIO
- TABLE 89. CRUDEN: KEY STRATERGIES
- TABLE 90. CXC SIMULATIONS: KEY EXECUTIVES
- TABLE 91. CXC SIMULATIONS: COMPANY SNAPSHOT
- TABLE 92. CXC SIMULATIONS: PRODUCT SEGMENTS
- TABLE 93. CXC SIMULATIONS: PRODUCT PORTFOLIO
- TABLE 94. CXC SIMULATIONS: KEY STRATERGIES
- TABLE 95. HOTTINGER BREL & KJR (HBK): KEY EXECUTIVES
- TABLE 96. HOTTINGER BREL & KJR (HBK): COMPANY SNAPSHOT
- TABLE 97. HOTTINGER BREL & KJR (HBK): PRODUCT SEGMENTS
- TABLE 98. HOTTINGER BREL & KJR (HBK): PRODUCT PORTFOLIO
- TABLE 99. HOTTINGER BREL & KJR (HBK): KEY STRATERGIES
- TABLE 100. MOOG INC.: KEY EXECUTIVES
- TABLE 101. MOOG INC.: COMPANY SNAPSHOT
- TABLE 102. MOOG INC.: PRODUCT SEGMENTS
- TABLE 103. MOOG INC.: PRODUCT PORTFOLIO
- TABLE 104. TECKNOTROVE: KEY EXECUTIVES
- TABLE 105. TECKNOTROVE: COMPANY SNAPSHOT
- TABLE 106. TECKNOTROVE: PRODUCT SEGMENTS
- TABLE 107. TECKNOTROVE: PRODUCT PORTFOLIO
- TABLE 108. THALES: KEY EXECUTIVES
- TABLE 109. THALES: COMPANY SNAPSHOT
- TABLE 110. THALES: PRODUCT SEGMENTS
- TABLE 111. THALES: PRODUCT PORTFOLIO
- TABLE 112. THALES: KEY STRATERGIES
- TABLE 113. AROTECH CORPORATION: KEY EXECUTIVES
- TABLE 114. AROTECH CORPORATION: COMPANY SNAPSHOT
- TABLE 115. AROTECH CORPORATION: PRODUCT SEGMENTS
- TABLE 116. AROTECH CORPORATION: PRODUCT PORTFOLIO
- TABLE 117. AROTECH CORPORATION: KEY STRATERGIES
- TABLE 118. EXAIL TECHNOLOGIES (FORMER GROUPE GORGE): KEY EXECUTIVES
- TABLE 119. EXAIL TECHNOLOGIES (FORMER GROUPE GORGE): COMPANY SNAPSHOT
- TABLE 120. EXAIL TECHNOLOGIES (FORMER GROUPE GORGE): PRODUCT SEGMENTS
- TABLE 121. EXAIL TECHNOLOGIES (FORMER GROUPE GORGE): PRODUCT PORTFOLIO
LIST OF FIGURES
- FIGURE 01. DRIVING SIMULATOR MARKET, 2022-2032
- FIGURE 02. SEGMENTATION OF DRIVING SIMULATOR MARKET,2022-2032
- FIGURE 03. TOP INVESTMENT POCKETS IN DRIVING SIMULATOR MARKET (2023-2032)
- FIGURE 04. MODERATE BARGAINING POWER OF SUPPLIERS
- FIGURE 05. LOW THREAT OF NEW ENTRANTS
- FIGURE 06. LOW THREAT OF SUBSTITUTES
- FIGURE 07. LOW INTENSITY OF RIVALRY
- FIGURE 08. LOW BARGAINING POWER OF BUYERS
- FIGURE 09. GLOBAL DRIVING SIMULATOR MARKET:DRIVERS, RESTRAINTS AND OPPORTUNITIES
- FIGURE 10. DRIVING SIMULATOR MARKET, BY APPLICATION, 2022(%)
- FIGURE 11. COMPARATIVE SHARE ANALYSIS OF DRIVING SIMULATOR MARKET FOR TRAINING, BY COUNTRY 2022 AND 2032(%)
- FIGURE 12. COMPARATIVE SHARE ANALYSIS OF DRIVING SIMULATOR MARKET FOR RESEARCH AND TESTING, BY COUNTRY 2022 AND 2032(%)
- FIGURE 13. COMPARATIVE SHARE ANALYSIS OF DRIVING SIMULATOR MARKET FOR ENTERTAINMENT, BY COUNTRY 2022 AND 2032(%)
- FIGURE 14. DRIVING SIMULATOR MARKET, BY VEHICLE TYPE, 2022(%)
- FIGURE 15. COMPARATIVE SHARE ANALYSIS OF DRIVING SIMULATOR MARKET FOR CAR SIMULATOR, BY COUNTRY 2022 AND 2032(%)
- FIGURE 16. COMPARATIVE SHARE ANALYSIS OF DRIVING SIMULATOR MARKET FOR TRUCK AND BUS SIMULATOR, BY COUNTRY 2022 AND 2032(%)
- FIGURE 17. DRIVING SIMULATOR MARKET, BY SIMULATOR TYPE, 2022(%)
- FIGURE 18. COMPARATIVE SHARE ANALYSIS OF DRIVING SIMULATOR MARKET FOR TRAINING SIMULATOR, BY COUNTRY 2022 AND 2032(%)
- FIGURE 19. COMPARATIVE SHARE ANALYSIS OF DRIVING SIMULATOR MARKET FOR ADVANCED DRIVING SIMULATOR, BY COUNTRY 2022 AND 2032(%)
- FIGURE 20. DRIVING SIMULATOR MARKET BY REGION, 2022(%)
- FIGURE 21. U.S. DRIVING SIMULATOR MARKET, 2022-2032 ($MILLION)
- FIGURE 22. CANADA DRIVING SIMULATOR MARKET, 2022-2032 ($MILLION)
- FIGURE 23. MEXICO DRIVING SIMULATOR MARKET, 2022-2032 ($MILLION)
- FIGURE 24. GERMANY DRIVING SIMULATOR MARKET, 2022-2032 ($MILLION)
- FIGURE 25. FRANCE DRIVING SIMULATOR MARKET, 2022-2032 ($MILLION)
- FIGURE 26. ITALY DRIVING SIMULATOR MARKET, 2022-2032 ($MILLION)
- FIGURE 27. UK DRIVING SIMULATOR MARKET, 2022-2032 ($MILLION)
- FIGURE 28. REST OF EUROPE DRIVING SIMULATOR MARKET, 2022-2032 ($MILLION)
- FIGURE 29. CHINA DRIVING SIMULATOR MARKET, 2022-2032 ($MILLION)
- FIGURE 30. JAPAN DRIVING SIMULATOR MARKET, 2022-2032 ($MILLION)
- FIGURE 31. INDIA DRIVING SIMULATOR MARKET, 2022-2032 ($MILLION)
- FIGURE 32. SOUTH KOREA DRIVING SIMULATOR MARKET, 2022-2032 ($MILLION)
- FIGURE 33. REST OF ASIA-PACIFIC DRIVING SIMULATOR MARKET, 2022-2032 ($MILLION)
- FIGURE 34. LATIN AMERICA DRIVING SIMULATOR MARKET, 2022-2032 ($MILLION)
- FIGURE 35. MIDDLE EAST DRIVING SIMULATOR MARKET, 2022-2032 ($MILLION)
- FIGURE 36. AFRICA DRIVING SIMULATOR MARKET, 2022-2032 ($MILLION)
- FIGURE 37. TOP WINNING STRATEGIES, BY YEAR (2020-2023)
- FIGURE 38. TOP WINNING STRATEGIES, BY DEVELOPMENT (2020-2023)
- FIGURE 39. TOP WINNING STRATEGIES, BY COMPANY (2020-2023)
- FIGURE 40. PRODUCT MAPPING OF TOP 10 PLAYERS
- FIGURE 41. COMPETITIVE DASHBOARD
- FIGURE 42. COMPETITIVE HEATMAP: DRIVING SIMULATOR MARKET
- FIGURE 43. TOP PLAYER POSITIONING, 2022
- FIGURE 44. AB DYNAMICS PLC: NET SALES, 2020-2022 ($MILLION)
- FIGURE 45. AB DYNAMICS PLC: REVENUE SHARE BY SEGMENT, 2022 (%)
- FIGURE 46. AB DYNAMICS PLC: REVENUE SHARE BY REGION, 2022 (%)
- FIGURE 47. MOOG INC.: RESEARCH & DEVELOPMENT EXPENDITURE, 2019-2021 ($MILLION)
- FIGURE 48. MOOG INC.: NET SALES, 2019-2021 ($MILLION)
- FIGURE 49. MOOG INC.: REVENUE SHARE BY SEGMENT, 2021 (%)
- FIGURE 50. MOOG INC.: REVENUE SHARE BY REGION, 2021 (%)
- FIGURE 51. THALES: RESEARCH & DEVELOPMENT EXPENDITURE, 2020-2022 ($MILLION)
- FIGURE 52. THALES: NET REVENUE, 2020-2022 ($MILLION)
- FIGURE 53. THALES: REVENUE SHARE BY SEGMENT, 2022 (%)
- FIGURE 54. THALES: REVENUE SHARE BY SEGMENT, 2022 (%)
 2025年全球驾驶模拟器市场报告2025年赛车模拟器全球市场报告
 驾驶模拟器市场规模、份额及成长分析(按模拟器类型、训练驾驶模拟器、车辆类型、应用、最终用户和地区)- 产业预测,2025 年至 2032 年
 驾驶模拟器:市场占有率分析、产业趋势与统计、成长预测(2025-2030 年)
 驾驶模拟器市场 - 全球产业规模、份额、趋势、机会和预测,按车辆类型、应用类型、模拟器类型、地区和竞争细分,2020-2030F
 全球驾驶模拟器市场:市场规模、份额、趋势分析(按类型、应用、最终用途)、区域展望、未来预测(2024-2031)
 驾驶模拟器市场规模、份额、趋势分析报告:按模拟器类型、最终用途、地区和细分市场预测,2025-2030 年
 赛车模拟器的全球市场:各零件,各用途,各销售管道,各地区,机会,预测,2018年~2032年驾驶模拟器市场:到 2033 年的市场分析和预测 - 按类型、按产品、按服务、按技术、按组件、按应用、按最终用户、按功能、按安装类型、按模式
 赛车模拟器市场:现状分析与未来预测(2024-2032)