


 |
市场调查报告书
商品编码
1414871
太阳能树市场:按连结、组件、应用:2023-2032 年全球机会分析与产业预测Solar Tree Market By Connectivity, By Component, By Application : Global Opportunity Analysis and Industry Forecast, 2023-2032 |
||||||
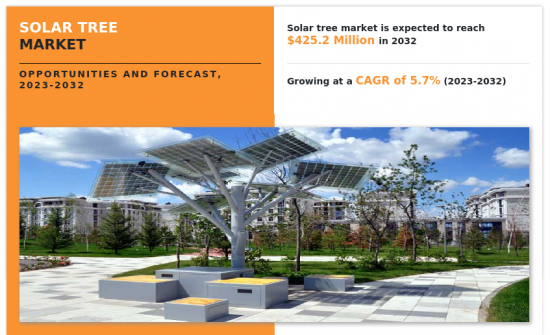
2022 年太阳能树市值为 2.474 亿美元,预计 2023-2032 年复合年增长率为 5.7%,到 2032 年将达到 4.252 亿美元。
太阳能树结构通常类似于树木或其他植物,但它们的工作原理与常规太阳能係统相同。当暴露在阳光下时,阵列中的太阳能电池会产生直流电(DC电),然后透过逆变器将其转换为交流电(AC电),从而更容易在电器产品中使用。太阳能树的特点之一是它们具有内建的能源储存功能,即使在有限的白天时间内也能提供持续的电力。另外,传统太阳能电池可以补充没有储能的模型。太阳能树也用于供电结构以及灯具和电动车充电器等户外元件。作为一种装饰性和永续能源解决方案,太阳能树展示了环保意识和创新设计的交叉点。
对气候变迁和石化燃料供应有限的日益担忧正在推动全球向可再生能源转型。太阳能是一种清洁、丰富的能源来源,太阳能树已作为一种高效能的太阳能工业技术而发展。此外,与传统能源来源相比,太阳能树具有显着的环境效益。透过利用阳光并将其转化为电能,它可以发电而不产生温室气体或其他有害污染物。这项特点与减少碳排放、减缓气候变迁的目标是一致的。使用者可以利用太阳能树发电,最大限度地减少对传统电力系统的依赖,并减少能源危机和中断的影响。世界许多国家政府都制定了支持性政策和财政奖励来鼓励使用可再生能源。对于从事太阳能树工作的个人和企业来说,补贴、税额扣抵、净计量计划和上网电价补贴都是具有经济吸引力的政策。
太阳能树的能量转换效率比传统树低。树状结构的树枝和阴影可能会影响最佳的阳光吸收和能量输出。复杂的设计虽然具有视觉吸引力,但在最大限度地提高能源产出效率方面提出了挑战。这种效率问题使人们对太阳能树的整体有效性产生了疑问,特别是在空间利用和能源输出是重要因素的环境中。
太阳能树不仅能能源产出,还能保护环境。太阳能树的垂直一体化和高大设计为环境改善创造了进一步的机会,特别是在都市区。其显着的优点之一是它为稀有动植物提供了栖息地,为保护城市景观的生物多样性奠定了基础。太阳能树的高大结构是各种植物和动物物种的栖息地,有助于城市环境的整体生态学健康。
此外,太阳能树提供的遮阳在缓解都市区热岛效应方面发挥重要作用。当沥青和混凝土等表面保留和吸收过多热量时,就会出现热岛,导致城市空间温度升高。太阳能树透过提供遮荫来帮助减少从这些表面反射的热能。这不仅解决了城市热量这一迫在眉睫的环境问题,而且也符合更广泛的气候变迁减缓努力。
由于COVID-19大流行,太阳能树市场受到了严重影响。由于製造设施暂时关闭和产能下降,包括太阳能组件生产和运输在内的全球供应链面临中断。这导致包括太阳能树在内的各种太阳能技术的生产和交付出现严重延误。封锁的实施,加上经济的不确定性和消费者支出的减少,可能会影响太阳能发电设备的需求,导致计划推迟和取消,从而影响太阳能树市场。我给了。此外,一些政府改变了政策或重新确定了优先顺序以应对这一流行病,从而影响了整个太阳能产业。
目录
第一章简介
第 2 章执行摘要
第三章市场概况
- 市场定义和范围
- 主要发现
- 影响因素
- 主要投资机会
- 波特五力分析
- 市场动态
- 促进因素
- 抑制因素
- 机会
- 平均售价
- 市场占有率分析
- 品牌占有率分析
- 贸易资料分析
- 产品消费
- 价值链分析
- 关键监管分析
- 专利形势
- 监管指引
- 赎回场景
第四章太阳能树市场:连结性别
- 概述
- 离网
- 在併网
第五章太阳能树市场:按组成部分
- 概述
- 电池
- 太阳能发电模组
- 电缆和连接器
- 其他的
第六章太阳能树市场:依应用分类
- 概述
- 住宅
- 商业/工业
- 公共产业
第七章太阳能树市场:按地区
- 概述
- 北美洲
- 美国
- 加拿大
- 墨西哥
- 欧洲
- 德国
- 英国
- 法国
- 西班牙
- 义大利
- 其他的
- 亚太地区
- 中国
- 日本
- 印度
- 韩国
- 澳洲
- 其他的
- 拉丁美洲/中东/非洲
- 巴西
- 阿拉伯聯合大公国
- 沙乌地阿拉伯
- 南非
- 其他的
第八章 竞争形势
- 介绍
- 关键成功策略
- 10家主要企业产品图谱
- 竞争对手仪表板
- 竞争热图
- 主要企业定位(2022年)
第九章 公司简介
- Beam Global
- Smartflower
- SolarBotanic Trees Ltd
- Solvis
- Solar Forma
- Spotlight Solar
- Power Tree
- IYSERT ENERGY
- NESSA
- ARTEMIDE SPA
According to a new report published by Allied Market Research, titled, "Solar Tree Market," The solar tree market was valued at $247.4 million in 2022, and is estimated to reach $425.2 million by 2032, growing at a CAGR of 5.7% from 2023 to 2032.
Solar tree structures, often resembling trees or other plants, work on the same principles as regular PV systems. When exposed to sunlight, the solar cells within the array generate direct current (DC power), subsequently converted into alternating current (AC power) through an inverter, facilitating use by household appliances. One distinguishing feature of solar trees is their potential for built-in energy storage, ensuring a continuous power supply during periods of limited sunlight. Alternatively, conventional solar batteries can complement models lacking integrated storage. Solar trees also find applications beyond providing electricity to structures, powering outdoor elements like light fixtures and electric vehicle chargers. As both a decorative and sustainable energy solution, solar trees exemplify the intersection of environmental consciousness and innovative design.
There is a global push to transition to renewable energy sources due to increasing concerns about climate change and the limited availability of fossil fuels. Solar power stands out as a clean and abundant energy source, and solar trees have evolved as a highly efficient solar industry technology. Furthermore, as compared to traditional energy sources, solar trees provide significant environmental benefits. These panels generate electricity without generating greenhouse gases or other harmful pollutants by harnessing sunlight and transforming it into electricity. This feature is consistent with the goals of lowering carbon emissions and mitigating climate change. Users can create their own electricity with solar trees, minimizing their reliance on traditional power systems and mitigating the impact of any energy crises or disruptions. Many governments throughout the world have put in place supportive policies and financial incentives to encourage the use of renewable energy. Subsidies, tax credits, net metering programs, and feed-in tariffs are among the policies that make it financially appealing for people and businesses to engage in Solar Trees.
Solar trees may experience lower energy conversion efficiency compared to their traditional counterparts. The tree-like structure, with branches and shading, can hinder optimal sunlight absorption and energy output. The intricate design, while visually appealing, introduces challenges in maximizing energy generation efficiency. This efficiency issue raises questions about the overall effectiveness of solar trees, especially in environments where space utilization and energy output are critical factors.
Solar trees contribute to environmental benefits that extend beyond energy generation. The vertical integration and elevated design of solar trees create additional opportunities for environmental enhancements, particularly in urban areas. One notable advantage is their capacity to host rare flora and fauna, providing a platform for biodiversity conservation within urban landscapes. The elevated structure of solar trees can serve as habitats for various plant and animal species, contributing to the overall ecological health of urban environments.
Furthermore, the shade cast by solar trees plays a crucial role in mitigating heat islands in urban areas. Heat islands result from the excessive retention and absorption of heat by surfaces like asphalt and concrete, leading to elevated temperatures in urban spaces. Solar trees, by providing shade, help reduce the thermal energy reflected off these surfaces. This not only addresses immediate environmental concerns related to urban heat but also aligns with broader climate change mitigation efforts.
The solar tree market experienced significant repercussions due to the COVID-19 pandemic. Global supply chains, encompassing the production and transportation of solar components, faced disruptions as manufacturing facilities encountered temporary shutdowns or reduced capacity. This led to considerable delays in the production and delivery of various solar technologies, including solar trees. The implementation of lockdown measures, along with economic uncertainties and decreased consumer spending, had the potential to influence the demand for solar installations, resulting in project postponements or cancellations and affecting the solar tree market. In addition, certain governments altered policies or reassessed priorities in response to the pandemic, impacting the solar industry as a whole.
The key players profiled in this report include: Beam Global, Smartflower, SolarBotanic Trees Ltd, Solvis, Solar Forma, Spotlight Solar, Power Tree, IYSERT ENERGY, NESSA, and ARTEMIDE S.P.A. The market players are continuously striving to achieve a dominant position in this competitive market using strategies such as collaborations and acquisitions.
Key Benefits For Stakeholders
- This report provides a quantitative analysis of the market segments, current trends, estimations, and dynamics of the solar tree market analysis from 2022 to 2032 to identify the prevailing solar tree market opportunities.
- The market research is offered along with information related to key drivers, restraints, and opportunities.
- Porter's five forces analysis highlights the potency of buyers and suppliers to enable stakeholders make profit-oriented business decisions and strengthen their supplier-buyer network.
- In-depth analysis of the solar tree market segmentation assists to determine the prevailing market opportunities.
- Major countries in each region are mapped according to their revenue contribution to the global market.
- Market player positioning facilitates benchmarking and provides a clear understanding of the present position of the market players.
- The report includes the analysis of the regional as well as global solar tree market trends, key players, market segments, application areas, and market growth strategies.
Additional benefits you will get with this purchase are:
- Quarterly Update and* (only available with a corporate license, on listed price)
- 5 additional Company Profile of client Choice pre- or Post-purchase, as a free update.
- Free Upcoming Version on the Purchase of Five and Enterprise User License.
- 16 analyst hours of support* (post-purchase, if you find additional data requirements upon review of the report, you may receive support amounting to 16 analyst hours to solve questions, and post-sale queries)
- 15% Free Customization* (in case the scope or segment of the report does not match your requirements, 15% is equivalent to 3 working days of free work, applicable once)
- Free data Pack on the Five and Enterprise User License. (Excel version of the report)
- Free Updated report if the report is 6-12 months old or older.
- 24-hour priority response*
- Free Industry updates and white papers.
Possible Customization with this report (with additional cost and timeline, please talk to the sales executive to know more)
- Consumer Buying Behavior Analysis
- Investment Opportunities
- Product Benchmarking / Product specification and applications
- Upcoming/New Entrant by Regions
- Technology Trend Analysis
- Go To Market Strategy
- New Product Development/ Product Matrix of Key Players
- Patient/epidemiology data at country, region, global level
- Regulatory Guidelines
- Additional company profiles with specific to client's interest
- Additional country or region analysis- market size and forecast
- Brands Share Analysis
- Criss-cross segment analysis- market size and forecast
- Historic market data
- Key player details (including location, contact details, supplier/vendor network etc. in excel format)
- List of customers/consumers/raw material suppliers- value chain analysis
- SWOT Analysis
Key Market Segments
By Application
- Residential
- Commercial and Industrial
- Utilities
By Connectivity
- Off-Grid
- On-Grid
By Component
- Battery
- Solar PV Modules
- Cables and Connectors
- Others
By Region
- North America
- U.S.
- Canada
- Mexico
- Europe
- Germany
- UK
- France
- Spain
- Italy
- Rest of Europe
- Asia-Pacific
- China
- Japan
- India
- South Korea
- Australia
- Rest of Asia-Pacific
- LAMEA
- Brazil
- United Arab Emirates
- Saudi Arabia
- South Africa
- Rest of LAMEA
Key Market Players:
- Beam Global
- Smartflower
- SolarBotanic Trees Ltd
- Solvis
- Solar Forma
- Spotlight Solar
- Power Tree
- IYSERT ENERGY
- NESSA
- ARTEMIDE S.P.A.
TABLE OF CONTENTS
CHAPTER 1: INTRODUCTION
- 1.1. Report description
- 1.2. Key market segments
- 1.3. Key benefits to the stakeholders
- 1.4. Research methodology
- 1.4.1. Primary research
- 1.4.2. Secondary research
- 1.4.3. Analyst tools and models
CHAPTER 2: EXECUTIVE SUMMARY
- 2.1. CXO Perspective
CHAPTER 3: MARKET OVERVIEW
- 3.1. Market definition and scope
- 3.2. Key findings
- 3.2.1. Top impacting factors
- 3.2.2. Top investment pockets
- 3.3. Porter's five forces analysis
- 3.4. Market dynamics
- 3.4.1. Drivers
- 3.4.2. Restraints
- 3.4.3. Opportunities
- 3.5. Average Selling Price
- 3.6. Market Share Analysis
- 3.7. Brand Share Analysis
- 3.8. Trade Data Analysis
- 3.9. Product Consumption
- 3.10. Value Chain Analysis
- 3.11. Key Regulation Analysis
- 3.12. Patent Landscape
- 3.13. Regulatory Guidelines
- 3.14. Reimbursement Scenario
CHAPTER 4: SOLAR TREE MARKET, BY CONNECTIVITY
- 4.1. Overview
- 4.1.1. Market size and forecast
- 4.2. Off-Grid
- 4.2.1. Key market trends, growth factors and opportunities
- 4.2.2. Market size and forecast, by region
- 4.2.3. Market share analysis by country
- 4.3. On-Grid
- 4.3.1. Key market trends, growth factors and opportunities
- 4.3.2. Market size and forecast, by region
- 4.3.3. Market share analysis by country
CHAPTER 5: SOLAR TREE MARKET, BY COMPONENT
- 5.1. Overview
- 5.1.1. Market size and forecast
- 5.2. Battery
- 5.2.1. Key market trends, growth factors and opportunities
- 5.2.2. Market size and forecast, by region
- 5.2.3. Market share analysis by country
- 5.3. Solar PV Modules
- 5.3.1. Key market trends, growth factors and opportunities
- 5.3.2. Market size and forecast, by region
- 5.3.3. Market share analysis by country
- 5.4. Cables and Connectors
- 5.4.1. Key market trends, growth factors and opportunities
- 5.4.2. Market size and forecast, by region
- 5.4.3. Market share analysis by country
- 5.5. Others
- 5.5.1. Key market trends, growth factors and opportunities
- 5.5.2. Market size and forecast, by region
- 5.5.3. Market share analysis by country
CHAPTER 6: SOLAR TREE MARKET, BY APPLICATION
- 6.1. Overview
- 6.1.1. Market size and forecast
- 6.2. Residential
- 6.2.1. Key market trends, growth factors and opportunities
- 6.2.2. Market size and forecast, by region
- 6.2.3. Market share analysis by country
- 6.3. Commercial and Industrial
- 6.3.1. Key market trends, growth factors and opportunities
- 6.3.2. Market size and forecast, by region
- 6.3.3. Market share analysis by country
- 6.4. Utilities
- 6.4.1. Key market trends, growth factors and opportunities
- 6.4.2. Market size and forecast, by region
- 6.4.3. Market share analysis by country
CHAPTER 7: SOLAR TREE MARKET, BY REGION
- 7.1. Overview
- 7.1.1. Market size and forecast By Region
- 7.2. North America
- 7.2.1. Key market trends, growth factors and opportunities
- 7.2.2. Market size and forecast, by Connectivity
- 7.2.3. Market size and forecast, by Component
- 7.2.4. Market size and forecast, by Application
- 7.2.5. Market size and forecast, by country
- 7.2.5.1. U.S.
- 7.2.5.1.1. Market size and forecast, by Connectivity
- 7.2.5.1.2. Market size and forecast, by Component
- 7.2.5.1.3. Market size and forecast, by Application
- 7.2.5.2. Canada
- 7.2.5.2.1. Market size and forecast, by Connectivity
- 7.2.5.2.2. Market size and forecast, by Component
- 7.2.5.2.3. Market size and forecast, by Application
- 7.2.5.3. Mexico
- 7.2.5.3.1. Market size and forecast, by Connectivity
- 7.2.5.3.2. Market size and forecast, by Component
- 7.2.5.3.3. Market size and forecast, by Application
- 7.3. Europe
- 7.3.1. Key market trends, growth factors and opportunities
- 7.3.2. Market size and forecast, by Connectivity
- 7.3.3. Market size and forecast, by Component
- 7.3.4. Market size and forecast, by Application
- 7.3.5. Market size and forecast, by country
- 7.3.5.1. Germany
- 7.3.5.1.1. Market size and forecast, by Connectivity
- 7.3.5.1.2. Market size and forecast, by Component
- 7.3.5.1.3. Market size and forecast, by Application
- 7.3.5.2. UK
- 7.3.5.2.1. Market size and forecast, by Connectivity
- 7.3.5.2.2. Market size and forecast, by Component
- 7.3.5.2.3. Market size and forecast, by Application
- 7.3.5.3. France
- 7.3.5.3.1. Market size and forecast, by Connectivity
- 7.3.5.3.2. Market size and forecast, by Component
- 7.3.5.3.3. Market size and forecast, by Application
- 7.3.5.4. Spain
- 7.3.5.4.1. Market size and forecast, by Connectivity
- 7.3.5.4.2. Market size and forecast, by Component
- 7.3.5.4.3. Market size and forecast, by Application
- 7.3.5.5. Italy
- 7.3.5.5.1. Market size and forecast, by Connectivity
- 7.3.5.5.2. Market size and forecast, by Component
- 7.3.5.5.3. Market size and forecast, by Application
- 7.3.5.6. Rest of Europe
- 7.3.5.6.1. Market size and forecast, by Connectivity
- 7.3.5.6.2. Market size and forecast, by Component
- 7.3.5.6.3. Market size and forecast, by Application
- 7.4. Asia-Pacific
- 7.4.1. Key market trends, growth factors and opportunities
- 7.4.2. Market size and forecast, by Connectivity
- 7.4.3. Market size and forecast, by Component
- 7.4.4. Market size and forecast, by Application
- 7.4.5. Market size and forecast, by country
- 7.4.5.1. China
- 7.4.5.1.1. Market size and forecast, by Connectivity
- 7.4.5.1.2. Market size and forecast, by Component
- 7.4.5.1.3. Market size and forecast, by Application
- 7.4.5.2. Japan
- 7.4.5.2.1. Market size and forecast, by Connectivity
- 7.4.5.2.2. Market size and forecast, by Component
- 7.4.5.2.3. Market size and forecast, by Application
- 7.4.5.3. India
- 7.4.5.3.1. Market size and forecast, by Connectivity
- 7.4.5.3.2. Market size and forecast, by Component
- 7.4.5.3.3. Market size and forecast, by Application
- 7.4.5.4. South Korea
- 7.4.5.4.1. Market size and forecast, by Connectivity
- 7.4.5.4.2. Market size and forecast, by Component
- 7.4.5.4.3. Market size and forecast, by Application
- 7.4.5.5. Australia
- 7.4.5.5.1. Market size and forecast, by Connectivity
- 7.4.5.5.2. Market size and forecast, by Component
- 7.4.5.5.3. Market size and forecast, by Application
- 7.4.5.6. Rest of Asia-Pacific
- 7.4.5.6.1. Market size and forecast, by Connectivity
- 7.4.5.6.2. Market size and forecast, by Component
- 7.4.5.6.3. Market size and forecast, by Application
- 7.5. LAMEA
- 7.5.1. Key market trends, growth factors and opportunities
- 7.5.2. Market size and forecast, by Connectivity
- 7.5.3. Market size and forecast, by Component
- 7.5.4. Market size and forecast, by Application
- 7.5.5. Market size and forecast, by country
- 7.5.5.1. Brazil
- 7.5.5.1.1. Market size and forecast, by Connectivity
- 7.5.5.1.2. Market size and forecast, by Component
- 7.5.5.1.3. Market size and forecast, by Application
- 7.5.5.2. United Arab Emirates
- 7.5.5.2.1. Market size and forecast, by Connectivity
- 7.5.5.2.2. Market size and forecast, by Component
- 7.5.5.2.3. Market size and forecast, by Application
- 7.5.5.3. Saudi Arabia
- 7.5.5.3.1. Market size and forecast, by Connectivity
- 7.5.5.3.2. Market size and forecast, by Component
- 7.5.5.3.3. Market size and forecast, by Application
- 7.5.5.4. South Africa
- 7.5.5.4.1. Market size and forecast, by Connectivity
- 7.5.5.4.2. Market size and forecast, by Component
- 7.5.5.4.3. Market size and forecast, by Application
- 7.5.5.5. Rest of LAMEA
- 7.5.5.5.1. Market size and forecast, by Connectivity
- 7.5.5.5.2. Market size and forecast, by Component
- 7.5.5.5.3. Market size and forecast, by Application
CHAPTER 8: COMPETITIVE LANDSCAPE
- 8.1. Introduction
- 8.2. Top winning strategies
- 8.3. Product mapping of top 10 player
- 8.4. Competitive dashboard
- 8.5. Competitive heatmap
- 8.6. Top player positioning, 2022
CHAPTER 9: COMPANY PROFILES
- 9.1. Beam Global
- 9.1.1. Company overview
- 9.1.2. Key executives
- 9.1.3. Company snapshot
- 9.2. Smartflower
- 9.2.1. Company overview
- 9.2.2. Key executives
- 9.2.3. Company snapshot
- 9.3. SolarBotanic Trees Ltd
- 9.3.1. Company overview
- 9.3.2. Key executives
- 9.3.3. Company snapshot
- 9.4. Solvis
- 9.4.1. Company overview
- 9.4.2. Key executives
- 9.4.3. Company snapshot
- 9.5. Solar Forma
- 9.5.1. Company overview
- 9.5.2. Key executives
- 9.5.3. Company snapshot
- 9.6. Spotlight Solar
- 9.6.1. Company overview
- 9.6.2. Key executives
- 9.6.3. Company snapshot
- 9.7. Power Tree
- 9.7.1. Company overview
- 9.7.2. Key executives
- 9.7.3. Company snapshot
- 9.8. IYSERT ENERGY
- 9.8.1. Company overview
- 9.8.2. Key executives
- 9.8.3. Company snapshot
- 9.9. NESSA
- 9.9.1. Company overview
- 9.9.2. Key executives
- 9.9.3. Company snapshot
- 9.10. ARTEMIDE S.P.A.
- 9.10.1. Company overview
- 9.10.2. Key executives
- 9.10.3. Company snapshot
LIST OF TABLES
- TABLE 01. GLOBAL SOLAR TREE MARKET, BY CONNECTIVITY, 2022-2032 ($THOUSAND)
- TABLE 02. SOLAR TREE MARKET FOR OFF-GRID, BY REGION, 2022-2032 ($THOUSAND)
- TABLE 03. SOLAR TREE MARKET FOR ON-GRID, BY REGION, 2022-2032 ($THOUSAND)
- TABLE 04. GLOBAL SOLAR TREE MARKET, BY COMPONENT, 2022-2032 ($THOUSAND)
- TABLE 05. SOLAR TREE MARKET FOR BATTERY, BY REGION, 2022-2032 ($THOUSAND)
- TABLE 06. SOLAR TREE MARKET FOR SOLAR PV MODULES, BY REGION, 2022-2032 ($THOUSAND)
- TABLE 07. SOLAR TREE MARKET FOR CABLES AND CONNECTORS, BY REGION, 2022-2032 ($THOUSAND)
- TABLE 08. SOLAR TREE MARKET FOR OTHERS, BY REGION, 2022-2032 ($THOUSAND)
- TABLE 09. GLOBAL SOLAR TREE MARKET, BY APPLICATION, 2022-2032 ($THOUSAND)
- TABLE 10. SOLAR TREE MARKET FOR RESIDENTIAL, BY REGION, 2022-2032 ($THOUSAND)
- TABLE 11. SOLAR TREE MARKET FOR COMMERCIAL AND INDUSTRIAL, BY REGION, 2022-2032 ($THOUSAND)
- TABLE 12. SOLAR TREE MARKET FOR UTILITIES, BY REGION, 2022-2032 ($THOUSAND)
- TABLE 13. SOLAR TREE MARKET, BY REGION, 2022-2032 ($THOUSAND)
- TABLE 14. NORTH AMERICA SOLAR TREE MARKET, BY CONNECTIVITY, 2022-2032 ($THOUSAND)
- TABLE 15. NORTH AMERICA SOLAR TREE MARKET, BY COMPONENT, 2022-2032 ($THOUSAND)
- TABLE 16. NORTH AMERICA SOLAR TREE MARKET, BY APPLICATION, 2022-2032 ($THOUSAND)
- TABLE 17. NORTH AMERICA SOLAR TREE MARKET, BY COUNTRY, 2022-2032 ($THOUSAND)
- TABLE 18. U.S. SOLAR TREE MARKET, BY CONNECTIVITY, 2022-2032 ($THOUSAND)
- TABLE 19. U.S. SOLAR TREE MARKET, BY COMPONENT, 2022-2032 ($THOUSAND)
- TABLE 20. U.S. SOLAR TREE MARKET, BY APPLICATION, 2022-2032 ($THOUSAND)
- TABLE 21. CANADA SOLAR TREE MARKET, BY CONNECTIVITY, 2022-2032 ($THOUSAND)
- TABLE 22. CANADA SOLAR TREE MARKET, BY COMPONENT, 2022-2032 ($THOUSAND)
- TABLE 23. CANADA SOLAR TREE MARKET, BY APPLICATION, 2022-2032 ($THOUSAND)
- TABLE 24. MEXICO SOLAR TREE MARKET, BY CONNECTIVITY, 2022-2032 ($THOUSAND)
- TABLE 25. MEXICO SOLAR TREE MARKET, BY COMPONENT, 2022-2032 ($THOUSAND)
- TABLE 26. MEXICO SOLAR TREE MARKET, BY APPLICATION, 2022-2032 ($THOUSAND)
- TABLE 27. EUROPE SOLAR TREE MARKET, BY CONNECTIVITY, 2022-2032 ($THOUSAND)
- TABLE 28. EUROPE SOLAR TREE MARKET, BY COMPONENT, 2022-2032 ($THOUSAND)
- TABLE 29. EUROPE SOLAR TREE MARKET, BY APPLICATION, 2022-2032 ($THOUSAND)
- TABLE 30. EUROPE SOLAR TREE MARKET, BY COUNTRY, 2022-2032 ($THOUSAND)
- TABLE 31. GERMANY SOLAR TREE MARKET, BY CONNECTIVITY, 2022-2032 ($THOUSAND)
- TABLE 32. GERMANY SOLAR TREE MARKET, BY COMPONENT, 2022-2032 ($THOUSAND)
- TABLE 33. GERMANY SOLAR TREE MARKET, BY APPLICATION, 2022-2032 ($THOUSAND)
- TABLE 34. UK SOLAR TREE MARKET, BY CONNECTIVITY, 2022-2032 ($THOUSAND)
- TABLE 35. UK SOLAR TREE MARKET, BY COMPONENT, 2022-2032 ($THOUSAND)
- TABLE 36. UK SOLAR TREE MARKET, BY APPLICATION, 2022-2032 ($THOUSAND)
- TABLE 37. FRANCE SOLAR TREE MARKET, BY CONNECTIVITY, 2022-2032 ($THOUSAND)
- TABLE 38. FRANCE SOLAR TREE MARKET, BY COMPONENT, 2022-2032 ($THOUSAND)
- TABLE 39. FRANCE SOLAR TREE MARKET, BY APPLICATION, 2022-2032 ($THOUSAND)
- TABLE 40. SPAIN SOLAR TREE MARKET, BY CONNECTIVITY, 2022-2032 ($THOUSAND)
- TABLE 41. SPAIN SOLAR TREE MARKET, BY COMPONENT, 2022-2032 ($THOUSAND)
- TABLE 42. SPAIN SOLAR TREE MARKET, BY APPLICATION, 2022-2032 ($THOUSAND)
- TABLE 43. ITALY SOLAR TREE MARKET, BY CONNECTIVITY, 2022-2032 ($THOUSAND)
- TABLE 44. ITALY SOLAR TREE MARKET, BY COMPONENT, 2022-2032 ($THOUSAND)
- TABLE 45. ITALY SOLAR TREE MARKET, BY APPLICATION, 2022-2032 ($THOUSAND)
- TABLE 46. REST OF EUROPE SOLAR TREE MARKET, BY CONNECTIVITY, 2022-2032 ($THOUSAND)
- TABLE 47. REST OF EUROPE SOLAR TREE MARKET, BY COMPONENT, 2022-2032 ($THOUSAND)
- TABLE 48. REST OF EUROPE SOLAR TREE MARKET, BY APPLICATION, 2022-2032 ($THOUSAND)
- TABLE 49. ASIA-PACIFIC SOLAR TREE MARKET, BY CONNECTIVITY, 2022-2032 ($THOUSAND)
- TABLE 50. ASIA-PACIFIC SOLAR TREE MARKET, BY COMPONENT, 2022-2032 ($THOUSAND)
- TABLE 51. ASIA-PACIFIC SOLAR TREE MARKET, BY APPLICATION, 2022-2032 ($THOUSAND)
- TABLE 52. ASIA-PACIFIC SOLAR TREE MARKET, BY COUNTRY, 2022-2032 ($THOUSAND)
- TABLE 53. CHINA SOLAR TREE MARKET, BY CONNECTIVITY, 2022-2032 ($THOUSAND)
- TABLE 54. CHINA SOLAR TREE MARKET, BY COMPONENT, 2022-2032 ($THOUSAND)
- TABLE 55. CHINA SOLAR TREE MARKET, BY APPLICATION, 2022-2032 ($THOUSAND)
- TABLE 56. JAPAN SOLAR TREE MARKET, BY CONNECTIVITY, 2022-2032 ($THOUSAND)
- TABLE 57. JAPAN SOLAR TREE MARKET, BY COMPONENT, 2022-2032 ($THOUSAND)
- TABLE 58. JAPAN SOLAR TREE MARKET, BY APPLICATION, 2022-2032 ($THOUSAND)
- TABLE 59. INDIA SOLAR TREE MARKET, BY CONNECTIVITY, 2022-2032 ($THOUSAND)
- TABLE 60. INDIA SOLAR TREE MARKET, BY COMPONENT, 2022-2032 ($THOUSAND)
- TABLE 61. INDIA SOLAR TREE MARKET, BY APPLICATION, 2022-2032 ($THOUSAND)
- TABLE 62. SOUTH KOREA SOLAR TREE MARKET, BY CONNECTIVITY, 2022-2032 ($THOUSAND)
- TABLE 63. SOUTH KOREA SOLAR TREE MARKET, BY COMPONENT, 2022-2032 ($THOUSAND)
- TABLE 64. SOUTH KOREA SOLAR TREE MARKET, BY APPLICATION, 2022-2032 ($THOUSAND)
- TABLE 65. AUSTRALIA SOLAR TREE MARKET, BY CONNECTIVITY, 2022-2032 ($THOUSAND)
- TABLE 66. AUSTRALIA SOLAR TREE MARKET, BY COMPONENT, 2022-2032 ($THOUSAND)
- TABLE 67. AUSTRALIA SOLAR TREE MARKET, BY APPLICATION, 2022-2032 ($THOUSAND)
- TABLE 68. REST OF ASIA-PACIFIC SOLAR TREE MARKET, BY CONNECTIVITY, 2022-2032 ($THOUSAND)
- TABLE 69. REST OF ASIA-PACIFIC SOLAR TREE MARKET, BY COMPONENT, 2022-2032 ($THOUSAND)
- TABLE 70. REST OF ASIA-PACIFIC SOLAR TREE MARKET, BY APPLICATION, 2022-2032 ($THOUSAND)
- TABLE 71. LAMEA SOLAR TREE MARKET, BY CONNECTIVITY, 2022-2032 ($THOUSAND)
- TABLE 72. LAMEA SOLAR TREE MARKET, BY COMPONENT, 2022-2032 ($THOUSAND)
- TABLE 73. LAMEA SOLAR TREE MARKET, BY APPLICATION, 2022-2032 ($THOUSAND)
- TABLE 74. LAMEA SOLAR TREE MARKET, BY COUNTRY, 2022-2032 ($THOUSAND)
- TABLE 75. BRAZIL SOLAR TREE MARKET, BY CONNECTIVITY, 2022-2032 ($THOUSAND)
- TABLE 76. BRAZIL SOLAR TREE MARKET, BY COMPONENT, 2022-2032 ($THOUSAND)
- TABLE 77. BRAZIL SOLAR TREE MARKET, BY APPLICATION, 2022-2032 ($THOUSAND)
- TABLE 78. UNITED ARAB EMIRATES SOLAR TREE MARKET, BY CONNECTIVITY, 2022-2032 ($THOUSAND)
- TABLE 79. UNITED ARAB EMIRATES SOLAR TREE MARKET, BY COMPONENT, 2022-2032 ($THOUSAND)
- TABLE 80. UNITED ARAB EMIRATES SOLAR TREE MARKET, BY APPLICATION, 2022-2032 ($THOUSAND)
- TABLE 81. SAUDI ARABIA SOLAR TREE MARKET, BY CONNECTIVITY, 2022-2032 ($THOUSAND)
- TABLE 82. SAUDI ARABIA SOLAR TREE MARKET, BY COMPONENT, 2022-2032 ($THOUSAND)
- TABLE 83. SAUDI ARABIA SOLAR TREE MARKET, BY APPLICATION, 2022-2032 ($THOUSAND)
- TABLE 84. SOUTH AFRICA SOLAR TREE MARKET, BY CONNECTIVITY, 2022-2032 ($THOUSAND)
- TABLE 85. SOUTH AFRICA SOLAR TREE MARKET, BY COMPONENT, 2022-2032 ($THOUSAND)
- TABLE 86. SOUTH AFRICA SOLAR TREE MARKET, BY APPLICATION, 2022-2032 ($THOUSAND)
- TABLE 87. REST OF LAMEA SOLAR TREE MARKET, BY CONNECTIVITY, 2022-2032 ($THOUSAND)
- TABLE 88. REST OF LAMEA SOLAR TREE MARKET, BY COMPONENT, 2022-2032 ($THOUSAND)
- TABLE 89. REST OF LAMEA SOLAR TREE MARKET, BY APPLICATION, 2022-2032 ($THOUSAND)
- TABLE 90. BEAM GLOBAL: KEY EXECUTIVES
- TABLE 91. BEAM GLOBAL: COMPANY SNAPSHOT
- TABLE 92. SMARTFLOWER: KEY EXECUTIVES
- TABLE 93. SMARTFLOWER: COMPANY SNAPSHOT
- TABLE 94. SOLARBOTANIC TREES LTD: KEY EXECUTIVES
- TABLE 95. SOLARBOTANIC TREES LTD: COMPANY SNAPSHOT
- TABLE 96. SOLVIS: KEY EXECUTIVES
- TABLE 97. SOLVIS: COMPANY SNAPSHOT
- TABLE 98. SOLAR FORMA: KEY EXECUTIVES
- TABLE 99. SOLAR FORMA: COMPANY SNAPSHOT
- TABLE 100. SPOTLIGHT SOLAR: KEY EXECUTIVES
- TABLE 101. SPOTLIGHT SOLAR: COMPANY SNAPSHOT
- TABLE 102. POWER TREE: KEY EXECUTIVES
- TABLE 103. POWER TREE: COMPANY SNAPSHOT
- TABLE 104. IYSERT ENERGY: KEY EXECUTIVES
- TABLE 105. IYSERT ENERGY: COMPANY SNAPSHOT
- TABLE 106. NESSA: KEY EXECUTIVES
- TABLE 107. NESSA: COMPANY SNAPSHOT
- TABLE 108. ARTEMIDE S.P.A.: KEY EXECUTIVES
- TABLE 109. ARTEMIDE S.P.A.: COMPANY SNAPSHOT
LIST OF FIGURES
- FIGURE 01. SOLAR TREE MARKET, 2022-2032
- FIGURE 02. SEGMENTATION OF SOLAR TREE MARKET,2022-2032
- FIGURE 03. TOP IMPACTING FACTORS IN SOLAR TREE MARKET
- FIGURE 04. TOP INVESTMENT POCKETS IN SOLAR TREE MARKET (2023-2032)
- FIGURE 05. BARGAINING POWER OF SUPPLIERS
- FIGURE 06. BARGAINING POWER OF BUYERS
- FIGURE 07. THREAT OF SUBSTITUTION
- FIGURE 08. THREAT OF SUBSTITUTION
- FIGURE 09. COMPETITIVE RIVALRY
- FIGURE 10. GLOBAL SOLAR TREE MARKET:DRIVERS, RESTRAINTS AND OPPORTUNITIES
- FIGURE 11. IMPACT OF KEY REGULATION: SOLAR TREE MARKET
- FIGURE 12. PATENT ANALYSIS BY COMPANY
- FIGURE 13. PATENT ANALYSIS BY COUNTRY
- FIGURE 14. REGULATORY GUIDELINES: SOLAR TREE MARKET
- FIGURE 15. SOLAR TREE MARKET, BY CONNECTIVITY, 2022 AND 2032(%)
- FIGURE 16. COMPARATIVE SHARE ANALYSIS OF SOLAR TREE MARKET FOR OFF-GRID, BY COUNTRY 2022 AND 2032(%)
- FIGURE 17. COMPARATIVE SHARE ANALYSIS OF SOLAR TREE MARKET FOR ON-GRID, BY COUNTRY 2022 AND 2032(%)
- FIGURE 18. SOLAR TREE MARKET, BY COMPONENT, 2022 AND 2032(%)
- FIGURE 19. COMPARATIVE SHARE ANALYSIS OF SOLAR TREE MARKET FOR BATTERY, BY COUNTRY 2022 AND 2032(%)
- FIGURE 20. COMPARATIVE SHARE ANALYSIS OF SOLAR TREE MARKET FOR SOLAR PV MODULES, BY COUNTRY 2022 AND 2032(%)
- FIGURE 21. COMPARATIVE SHARE ANALYSIS OF SOLAR TREE MARKET FOR CABLES AND CONNECTORS, BY COUNTRY 2022 AND 2032(%)
- FIGURE 22. COMPARATIVE SHARE ANALYSIS OF SOLAR TREE MARKET FOR OTHERS, BY COUNTRY 2022 AND 2032(%)
- FIGURE 23. SOLAR TREE MARKET, BY APPLICATION, 2022 AND 2032(%)
- FIGURE 24. COMPARATIVE SHARE ANALYSIS OF SOLAR TREE MARKET FOR RESIDENTIAL, BY COUNTRY 2022 AND 2032(%)
- FIGURE 25. COMPARATIVE SHARE ANALYSIS OF SOLAR TREE MARKET FOR COMMERCIAL AND INDUSTRIAL, BY COUNTRY 2022 AND 2032(%)
- FIGURE 26. COMPARATIVE SHARE ANALYSIS OF SOLAR TREE MARKET FOR UTILITIES, BY COUNTRY 2022 AND 2032(%)
- FIGURE 27. SOLAR TREE MARKET BY REGION, 2022 AND 2032(%)
- FIGURE 28. U.S. SOLAR TREE MARKET, 2022-2032 ($THOUSAND)
- FIGURE 29. CANADA SOLAR TREE MARKET, 2022-2032 ($THOUSAND)
- FIGURE 30. MEXICO SOLAR TREE MARKET, 2022-2032 ($THOUSAND)
- FIGURE 31. GERMANY SOLAR TREE MARKET, 2022-2032 ($THOUSAND)
- FIGURE 32. UK SOLAR TREE MARKET, 2022-2032 ($THOUSAND)
- FIGURE 33. FRANCE SOLAR TREE MARKET, 2022-2032 ($THOUSAND)
- FIGURE 34. SPAIN SOLAR TREE MARKET, 2022-2032 ($THOUSAND)
- FIGURE 35. ITALY SOLAR TREE MARKET, 2022-2032 ($THOUSAND)
- FIGURE 36. REST OF EUROPE SOLAR TREE MARKET, 2022-2032 ($THOUSAND)
- FIGURE 37. CHINA SOLAR TREE MARKET, 2022-2032 ($THOUSAND)
- FIGURE 38. JAPAN SOLAR TREE MARKET, 2022-2032 ($THOUSAND)
- FIGURE 39. INDIA SOLAR TREE MARKET, 2022-2032 ($THOUSAND)
- FIGURE 40. SOUTH KOREA SOLAR TREE MARKET, 2022-2032 ($THOUSAND)
- FIGURE 41. AUSTRALIA SOLAR TREE MARKET, 2022-2032 ($THOUSAND)
- FIGURE 42. REST OF ASIA-PACIFIC SOLAR TREE MARKET, 2022-2032 ($THOUSAND)
- FIGURE 43. BRAZIL SOLAR TREE MARKET, 2022-2032 ($THOUSAND)
- FIGURE 44. UNITED ARAB EMIRATES SOLAR TREE MARKET, 2022-2032 ($THOUSAND)
- FIGURE 45. SAUDI ARABIA SOLAR TREE MARKET, 2022-2032 ($THOUSAND)
- FIGURE 46. SOUTH AFRICA SOLAR TREE MARKET, 2022-2032 ($THOUSAND)
- FIGURE 47. REST OF LAMEA SOLAR TREE MARKET, 2022-2032 ($THOUSAND)
- FIGURE 48. PRODUCT MAPPING OF TOP 10 PLAYERS
- FIGURE 49. COMPETITIVE DASHBOARD
- FIGURE 50. COMPETITIVE HEATMAP: SOLAR TREE MARKET
- FIGURE 51. TOP PLAYER POSITIONING, 2022
 2025-2029年全球光伏(PV)市场
 全球并联型光电系统市场全球建筑太阳能电池市场全球碲化镉太阳能电池市场
 2032 年太阳能发电厂市场预测:按类型、安装类型、组件、技术、容量、最终用户和地区进行的全球分析全球太阳能树市场
 2025年全球薄膜光电模组市场报告
 2025 年至 2033 年光伏材料市场规模、份额、趋势及预测(按类型、材料、应用和地区)太阳能收集市场机会、成长动力、产业趋势分析及 2025 - 2034 年预测2032 年 Pico Solar 市场预测:按产品类型、技术、应用、最终用户和地区进行的全球分析