


 |
市场调查报告书
商品编码
1414911
5G 设备市场:依产品、最终用途:2023-2032 年全球机会分析与产业预测5G Equipment Market By Product (Macro Cell, Small Cell, Others), By End-Use (Retail Sector, Non-retail Sector): Global Opportunity Analysis and Industry Forecast, 2023-2032 |
||||||
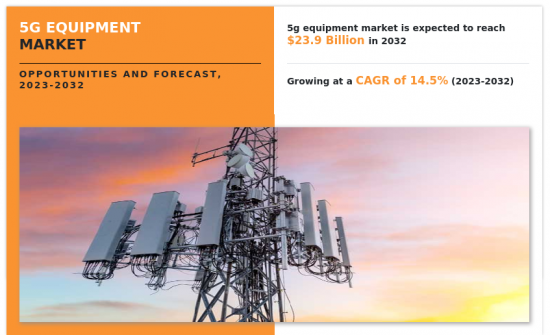
2022年5G设备市场规模预计为64亿美元,预计2032年将达239亿美元,2023年至2032年复合年增长率为14.5%。
同时,5G 产业正在帮助企业做好数位转型的准备,设备製造商在开发高性能元件以支援可靠实施方面发挥关键作用。然而,製造商面临的主要挑战包括管理日益小型化的封装组件中的极端热条件以及以低功耗实现高效能。这些挑战可以透过使用高性能材料来克服。预计这些因素将在预测期内为5G设备产业提供有利机会。
此外,全球物联网(IoT)的兴起(被认为是先进技术日益采用的一个例子)以及数位化的进步将对5G设备市场的成长产生正面影响。此外,对 5G 技术提高可操作性和生产力的需求不断增加,预计将在预测期内推动市场成长。此外,越来越多地采用新技术,例如:
软体定义网路 (SDN)、网路功能虚拟(NFV) 和边缘运算等新技术的广泛采用预计将在未来几年推动 5G 设备市场的成长。然而,安全问题、成本预算和缺乏标准阻碍了5G设备市场的成长。
此外,包括资料中心和服务供应商在内的企业越来越多地采用虚拟软体正在推动市场成长。此外,不断上升的网路普及和不断增加的政府倡议预计将为5G设备市场的扩张提供有利的成长机会。
目录
第一章简介
第 2 章执行摘要
第三章市场概况
- 市场定义和范围
- 主要发现
- 影响因素
- 主要投资机会
- 波特五力分析
- 市场动态
- 促进因素
- 科技的演进与网路的普及
- 对 SDN 和 NFV 的需求不断增长
- 抑制因素
- 技术创新成本高且预算有限
- 机会
- 5G技术在智慧城市的部署
- 促进因素
- 监管指引
第四章 5G设备市场:分产品
- 概述
- 宏蜂巢
- 小型基地台
- 其他的
第五章 5G设备市场:依最终用户划分
- 概述
- 零售业
- 非零售业
第六章 5G设备市场:按地区
- 概述
- 北美洲
- 美国
- 加拿大
- 欧洲
- 英国
- 德国
- 法国
- 义大利
- 西班牙
- 其他的
- 亚太地区
- 中国
- 日本
- 印度
- 澳洲
- 韩国
- 其他的
- 拉丁美洲
- 拉丁美洲
- 中东
- 非洲
第七章 竞争形势
- 介绍
- 关键成功策略
- 10家主要企业产品图谱
- 竞争对手仪表板
- 竞争热图
- 2022年主要企业定位
第八章 公司简介
- Cisco Systems, Inc.
- Samsung Electronics
- NEC Corporation
- Huawei Technologies Co., Ltd.
- AT&T Inc.
- Verizon Communications
- Qualcomm Technologies, Inc.
- Telefonaktiebolaget LM Ericsson
- ZTE Corporation
- Nokia Corporation
According to a new report published by Allied Market Research, titled, "5G Equipment Market," The 5g equipment market was valued at $6.4 billion in 2022, and is estimated to reach $23.9 billion by 2032, growing at a CAGR of 14.5% from 2023 to 2032.
On the other hand, the 5G industry is preparing businesses to experience digital transformation with equipment manufacturers, playing a crucial role in developing high performance components to support reliable implementation. On the contrary, major challenges to be addressed by manufacturers include managing extreme thermal conditions within increasing smaller encapsulated components and delivering high performance at low power. These challenges can be overcome through the use of high-performance materials. Such factors are expected to provide the lucrative opportunities for the 5G equipment industry during the forecast period.
Factors such as increase in adoption of advanced technologies such as Internet of Things (IoT) across the globe and rise in digitalization, positively impact the growth of the 5G equipment market. In addition, rise in demand of 5G technology to enhance operation & productivity is anticipated to propel the growth of the market during the forecast period. Furthermore, increase in adoption of emerging technologies such as software-defined networking (SDN), network functions virtualization (NFV), and edge computing is anticipated to enhance the 5G equipment market growth in the upcoming years. However, security concern & costs budget and lack of standards hamper the 5G equipment market growth.
Furthermore, growth in deployment of virtualized software among enterprises including data center and service provider drives the growth of the market. In addition, growing internet penetration and rise in government initiatives are expected to provide lucrative growth opportunities for the 5G equipment market expansion.
The 5G equipment market is segmented into product, end-use, and region. By product, the market is segregated into macro cell, small cell, and others. By end-use, the market is classified into retail sector and non-retail sector. Region-wise, the 5G equipment market is analyzed across North America, Europe, Asia-Pacific, and LAMEA.
The market players operating in the 5G equipment market are Cisco Systems, Inc., Samsung Electronics, NEC Corporation, Huawei Technologies Co., Ltd., AT&T Inc., Verizon Communication, Qualcomm Technologies, Telefonaktiebolaget LM Ericsson, ZTE Corporation, and Nokia Corporation. These major players have adopted various key development strategies such as business expansion, new product launches, and partnerships, which help to drive the growth of the 5G equipment market globally.
Key Benefits for Stakeholders
- The study provides an in-depth analysis of the 5G equipment market along with the current trends and future estimations to elucidate the imminent investment pockets.
- Information about key drivers, restrains, and opportunities and their impact analysis on the 5G equipment market size is provided in the report.
- The Porter's five forces analysis illustrates the potency of buyers and suppliers operating in the 5G equipment industry.
- The quantitative analysis of the global 5G equipment market for the period 2022-2032 is provided to determine the 5G equipment market potential.
Additional benefits you will get with this purchase are:
- Quarterly Update and* (only available with a corporate license, on listed price)
- 5 additional Company Profile of client Choice pre- or Post-purchase, as a free update.
- Free Upcoming Version on the Purchase of Five and Enterprise User License.
- 16 analyst hours of support* (post-purchase, if you find additional data requirements upon review of the report, you may receive support amounting to 16 analyst hours to solve questions, and post-sale queries)
- 15% Free Customization* (in case the scope or segment of the report does not match your requirements, 15% is equivalent to 3 working days of free work, applicable once)
- Free data Pack on the Five and Enterprise User License. (Excel version of the report)
- Free Updated report if the report is 6-12 months old or older.
- 24-hour priority response*
- Free Industry updates and white papers.
Possible Customization with this report (with additional cost and timeline, please talk to the sales executive to know more)
- Investment Opportunities
- Technology Trend Analysis
- Regulatory Guidelines
- Strategic Recommedations
- Additional company profiles with specific to client's interest
- SWOT Analysis
Key Market Segments
By Product
- Macro Cell
- Small Cell
- Others
By End-Use
- Retail Sector
- Non-retail Sector
By Region
- North America
- U.S.
- Canada
- Europe
- UK
- Germany
- France
- Italy
- Spain
- Rest of Europe
- Asia-Pacific
- China
- Japan
- India
- Australia
- South Korea
- Rest of Asia-Pacific
- LAMEA
- Latin America
- Middle East
- Africa
Key Market Players:
- Cisco Systems, Inc.
- Samsung Electronics
- NEC Corporation
- Huawei Technologies Co., Ltd.
- AT&T Inc.
- Verizon Communications
- Qualcomm Technologies, Inc.
- Telefonaktiebolaget LM Ericsson
- ZTE Corporation
- Nokia Corporation
TABLE OF CONTENTS
CHAPTER 1: INTRODUCTION
- 1.1. Report description
- 1.2. Key market segments
- 1.3. Key benefits to the stakeholders
- 1.4. Research methodology
- 1.4.1. Primary research
- 1.4.2. Secondary research
- 1.4.3. Analyst tools and models
CHAPTER 2: EXECUTIVE SUMMARY
- 2.1. CXO Perspective
CHAPTER 3: MARKET OVERVIEW
- 3.1. Market definition and scope
- 3.2. Key findings
- 3.2.1. Top impacting factors
- 3.2.2. Top investment pockets
- 3.3. Porter's five forces analysis
- 3.3.1. Low bargaining power of suppliers
- 3.3.2. Low threat of new entrants
- 3.3.3. Low threat of substitutes
- 3.3.4. Low intensity of rivalry
- 3.3.5. Low bargaining power of buyers
- 3.4. Market dynamics
- 3.4.1. Drivers
- 3.4.1.1. Advancement of technologies and internet penetration
- 3.4.1.2. Rise in demand for SDN and NFV
- 3.4.2. Restraints
- 3.4.2.1. High cost of innovation and budget constraints
- 3.4.3. Opportunities
- 3.4.3.1. Deployment of 5G technology in smart cities
- 3.4.1. Drivers
- 3.5. Regulatory Guidelines
CHAPTER 4: 5G EQUIPMENT MARKET, BY PRODUCT
- 4.1. Overview
- 4.1.1. Market size and forecast
- 4.2. Macro Cell
- 4.2.1. Key market trends, growth factors and opportunities
- 4.2.2. Market size and forecast, by region
- 4.2.3. Market share analysis by country
- 4.3. Small Cell
- 4.3.1. Key market trends, growth factors and opportunities
- 4.3.2. Market size and forecast, by region
- 4.3.3. Market share analysis by country
- 4.4. Others
- 4.4.1. Key market trends, growth factors and opportunities
- 4.4.2. Market size and forecast, by region
- 4.4.3. Market share analysis by country
CHAPTER 5: 5G EQUIPMENT MARKET, BY END-USE
- 5.1. Overview
- 5.1.1. Market size and forecast
- 5.2. Retail Sector
- 5.2.1. Key market trends, growth factors and opportunities
- 5.2.2. Market size and forecast, by region
- 5.2.3. Market share analysis by country
- 5.3. Non-retail Sector
- 5.3.1. Key market trends, growth factors and opportunities
- 5.3.2. Market size and forecast, by region
- 5.3.3. Market share analysis by country
CHAPTER 6: 5G EQUIPMENT MARKET, BY REGION
- 6.1. Overview
- 6.1.1. Market size and forecast By Region
- 6.2. North America
- 6.2.1. Key market trends, growth factors and opportunities
- 6.2.2. Market size and forecast, by Product
- 6.2.3. Market size and forecast, by End-Use
- 6.2.4. Market size and forecast, by country
- 6.2.4.1. U.S.
- 6.2.4.1.1. Market size and forecast, by Product
- 6.2.4.1.2. Market size and forecast, by End-Use
- 6.2.4.2. Canada
- 6.2.4.2.1. Market size and forecast, by Product
- 6.2.4.2.2. Market size and forecast, by End-Use
- 6.3. Europe
- 6.3.1. Key market trends, growth factors and opportunities
- 6.3.2. Market size and forecast, by Product
- 6.3.3. Market size and forecast, by End-Use
- 6.3.4. Market size and forecast, by country
- 6.3.4.1. UK
- 6.3.4.1.1. Market size and forecast, by Product
- 6.3.4.1.2. Market size and forecast, by End-Use
- 6.3.4.2. Germany
- 6.3.4.2.1. Market size and forecast, by Product
- 6.3.4.2.2. Market size and forecast, by End-Use
- 6.3.4.3. France
- 6.3.4.3.1. Market size and forecast, by Product
- 6.3.4.3.2. Market size and forecast, by End-Use
- 6.3.4.4. Italy
- 6.3.4.4.1. Market size and forecast, by Product
- 6.3.4.4.2. Market size and forecast, by End-Use
- 6.3.4.5. Spain
- 6.3.4.5.1. Market size and forecast, by Product
- 6.3.4.5.2. Market size and forecast, by End-Use
- 6.3.4.6. Rest of Europe
- 6.3.4.6.1. Market size and forecast, by Product
- 6.3.4.6.2. Market size and forecast, by End-Use
- 6.4. Asia-Pacific
- 6.4.1. Key market trends, growth factors and opportunities
- 6.4.2. Market size and forecast, by Product
- 6.4.3. Market size and forecast, by End-Use
- 6.4.4. Market size and forecast, by country
- 6.4.4.1. China
- 6.4.4.1.1. Market size and forecast, by Product
- 6.4.4.1.2. Market size and forecast, by End-Use
- 6.4.4.2. Japan
- 6.4.4.2.1. Market size and forecast, by Product
- 6.4.4.2.2. Market size and forecast, by End-Use
- 6.4.4.3. India
- 6.4.4.3.1. Market size and forecast, by Product
- 6.4.4.3.2. Market size and forecast, by End-Use
- 6.4.4.4. Australia
- 6.4.4.4.1. Market size and forecast, by Product
- 6.4.4.4.2. Market size and forecast, by End-Use
- 6.4.4.5. South Korea
- 6.4.4.5.1. Market size and forecast, by Product
- 6.4.4.5.2. Market size and forecast, by End-Use
- 6.4.4.6. Rest of Asia-Pacific
- 6.4.4.6.1. Market size and forecast, by Product
- 6.4.4.6.2. Market size and forecast, by End-Use
- 6.5. LAMEA
- 6.5.1. Key market trends, growth factors and opportunities
- 6.5.2. Market size and forecast, by Product
- 6.5.3. Market size and forecast, by End-Use
- 6.5.4. Market size and forecast, by country
- 6.5.4.1. Latin America
- 6.5.4.1.1. Market size and forecast, by Product
- 6.5.4.1.2. Market size and forecast, by End-Use
- 6.5.4.2. Middle East
- 6.5.4.2.1. Market size and forecast, by Product
- 6.5.4.2.2. Market size and forecast, by End-Use
- 6.5.4.3. Africa
- 6.5.4.3.1. Market size and forecast, by Product
- 6.5.4.3.2. Market size and forecast, by End-Use
CHAPTER 7: COMPETITIVE LANDSCAPE
- 7.1. Introduction
- 7.2. Top winning strategies
- 7.3. Product mapping of top 10 player
- 7.4. Competitive dashboard
- 7.5. Competitive heatmap
- 7.6. Top player positioning, 2022
CHAPTER 8: COMPANY PROFILES
- 8.1. Cisco Systems, Inc.
- 8.1.1. Company overview
- 8.1.2. Key executives
- 8.1.3. Company snapshot
- 8.1.4. Operating business segments
- 8.1.5. Product portfolio
- 8.1.6. Business performance
- 8.1.7. Key strategic moves and developments
- 8.2. Samsung Electronics
- 8.2.1. Company overview
- 8.2.2. Key executives
- 8.2.3. Company snapshot
- 8.2.4. Operating business segments
- 8.2.5. Product portfolio
- 8.2.6. Business performance
- 8.2.7. Key strategic moves and developments
- 8.3. NEC Corporation
- 8.3.1. Company overview
- 8.3.2. Key executives
- 8.3.3. Company snapshot
- 8.3.4. Operating business segments
- 8.3.5. Product portfolio
- 8.3.6. Business performance
- 8.3.7. Key strategic moves and developments
- 8.4. Huawei Technologies Co., Ltd.
- 8.4.1. Company overview
- 8.4.2. Key executives
- 8.4.3. Company snapshot
- 8.4.4. Operating business segments
- 8.4.5. Product portfolio
- 8.4.6. Business performance
- 8.4.7. Key strategic moves and developments
- 8.5. AT&T Inc.
- 8.5.1. Company overview
- 8.5.2. Key executives
- 8.5.3. Company snapshot
- 8.5.4. Operating business segments
- 8.5.5. Product portfolio
- 8.5.6. Business performance
- 8.5.7. Key strategic moves and developments
- 8.6. Verizon Communications
- 8.6.1. Company overview
- 8.6.2. Key executives
- 8.6.3. Company snapshot
- 8.6.4. Operating business segments
- 8.6.5. Product portfolio
- 8.6.6. Business performance
- 8.7. Qualcomm Technologies, Inc.
- 8.7.1. Company overview
- 8.7.2. Key executives
- 8.7.3. Company snapshot
- 8.7.4. Operating business segments
- 8.7.5. Product portfolio
- 8.7.6. Business performance
- 8.7.7. Key strategic moves and developments
- 8.8. Telefonaktiebolaget LM Ericsson
- 8.8.1. Company overview
- 8.8.2. Key executives
- 8.8.3. Company snapshot
- 8.8.4. Operating business segments
- 8.8.5. Product portfolio
- 8.8.6. Business performance
- 8.8.7. Key strategic moves and developments
- 8.9. ZTE Corporation
- 8.9.1. Company overview
- 8.9.2. Key executives
- 8.9.3. Company snapshot
- 8.9.4. Operating business segments
- 8.9.5. Product portfolio
- 8.9.6. Business performance
- 8.10. Nokia Corporation
- 8.10.1. Company overview
- 8.10.2. Key executives
- 8.10.3. Company snapshot
- 8.10.4. Operating business segments
- 8.10.5. Product portfolio
- 8.10.6. Business performance
- 8.10.7. Key strategic moves and developments
LIST OF TABLES
- TABLE 01. GLOBAL 5G EQUIPMENT MARKET, BY PRODUCT, 2022-2032 ($MILLION)
- TABLE 02. 5G EQUIPMENT MARKET FOR MACRO CELL, BY REGION, 2022-2032 ($MILLION)
- TABLE 03. 5G EQUIPMENT MARKET FOR SMALL CELL, BY REGION, 2022-2032 ($MILLION)
- TABLE 04. 5G EQUIPMENT MARKET FOR OTHERS, BY REGION, 2022-2032 ($MILLION)
- TABLE 05. GLOBAL 5G EQUIPMENT MARKET, BY END-USE, 2022-2032 ($MILLION)
- TABLE 06. 5G EQUIPMENT MARKET FOR RETAIL SECTOR, BY REGION, 2022-2032 ($MILLION)
- TABLE 07. 5G EQUIPMENT MARKET FOR NON-RETAIL SECTOR, BY REGION, 2022-2032 ($MILLION)
- TABLE 08. 5G EQUIPMENT MARKET, BY REGION, 2022-2032 ($MILLION)
- TABLE 09. NORTH AMERICA 5G EQUIPMENT MARKET, BY PRODUCT, 2022-2032 ($MILLION)
- TABLE 10. NORTH AMERICA 5G EQUIPMENT MARKET, BY END-USE, 2022-2032 ($MILLION)
- TABLE 11. NORTH AMERICA 5G EQUIPMENT MARKET, BY COUNTRY, 2022-2032 ($MILLION)
- TABLE 12. U.S. 5G EQUIPMENT MARKET, BY PRODUCT, 2022-2032 ($MILLION)
- TABLE 13. U.S. 5G EQUIPMENT MARKET, BY END-USE, 2022-2032 ($MILLION)
- TABLE 14. CANADA 5G EQUIPMENT MARKET, BY PRODUCT, 2022-2032 ($MILLION)
- TABLE 15. CANADA 5G EQUIPMENT MARKET, BY END-USE, 2022-2032 ($MILLION)
- TABLE 16. EUROPE 5G EQUIPMENT MARKET, BY PRODUCT, 2022-2032 ($MILLION)
- TABLE 17. EUROPE 5G EQUIPMENT MARKET, BY END-USE, 2022-2032 ($MILLION)
- TABLE 18. EUROPE 5G EQUIPMENT MARKET, BY COUNTRY, 2022-2032 ($MILLION)
- TABLE 19. UK 5G EQUIPMENT MARKET, BY PRODUCT, 2022-2032 ($MILLION)
- TABLE 20. UK 5G EQUIPMENT MARKET, BY END-USE, 2022-2032 ($MILLION)
- TABLE 21. GERMANY 5G EQUIPMENT MARKET, BY PRODUCT, 2022-2032 ($MILLION)
- TABLE 22. GERMANY 5G EQUIPMENT MARKET, BY END-USE, 2022-2032 ($MILLION)
- TABLE 23. FRANCE 5G EQUIPMENT MARKET, BY PRODUCT, 2022-2032 ($MILLION)
- TABLE 24. FRANCE 5G EQUIPMENT MARKET, BY END-USE, 2022-2032 ($MILLION)
- TABLE 25. ITALY 5G EQUIPMENT MARKET, BY PRODUCT, 2022-2032 ($MILLION)
- TABLE 26. ITALY 5G EQUIPMENT MARKET, BY END-USE, 2022-2032 ($MILLION)
- TABLE 27. SPAIN 5G EQUIPMENT MARKET, BY PRODUCT, 2022-2032 ($MILLION)
- TABLE 28. SPAIN 5G EQUIPMENT MARKET, BY END-USE, 2022-2032 ($MILLION)
- TABLE 29. REST OF EUROPE 5G EQUIPMENT MARKET, BY PRODUCT, 2022-2032 ($MILLION)
- TABLE 30. REST OF EUROPE 5G EQUIPMENT MARKET, BY END-USE, 2022-2032 ($MILLION)
- TABLE 31. ASIA-PACIFIC 5G EQUIPMENT MARKET, BY PRODUCT, 2022-2032 ($MILLION)
- TABLE 32. ASIA-PACIFIC 5G EQUIPMENT MARKET, BY END-USE, 2022-2032 ($MILLION)
- TABLE 33. ASIA-PACIFIC 5G EQUIPMENT MARKET, BY COUNTRY, 2022-2032 ($MILLION)
- TABLE 34. CHINA 5G EQUIPMENT MARKET, BY PRODUCT, 2022-2032 ($MILLION)
- TABLE 35. CHINA 5G EQUIPMENT MARKET, BY END-USE, 2022-2032 ($MILLION)
- TABLE 36. JAPAN 5G EQUIPMENT MARKET, BY PRODUCT, 2022-2032 ($MILLION)
- TABLE 37. JAPAN 5G EQUIPMENT MARKET, BY END-USE, 2022-2032 ($MILLION)
- TABLE 38. INDIA 5G EQUIPMENT MARKET, BY PRODUCT, 2022-2032 ($MILLION)
- TABLE 39. INDIA 5G EQUIPMENT MARKET, BY END-USE, 2022-2032 ($MILLION)
- TABLE 40. AUSTRALIA 5G EQUIPMENT MARKET, BY PRODUCT, 2022-2032 ($MILLION)
- TABLE 41. AUSTRALIA 5G EQUIPMENT MARKET, BY END-USE, 2022-2032 ($MILLION)
- TABLE 42. SOUTH KOREA 5G EQUIPMENT MARKET, BY PRODUCT, 2022-2032 ($MILLION)
- TABLE 43. SOUTH KOREA 5G EQUIPMENT MARKET, BY END-USE, 2022-2032 ($MILLION)
- TABLE 44. REST OF ASIA-PACIFIC 5G EQUIPMENT MARKET, BY PRODUCT, 2022-2032 ($MILLION)
- TABLE 45. REST OF ASIA-PACIFIC 5G EQUIPMENT MARKET, BY END-USE, 2022-2032 ($MILLION)
- TABLE 46. LAMEA 5G EQUIPMENT MARKET, BY PRODUCT, 2022-2032 ($MILLION)
- TABLE 47. LAMEA 5G EQUIPMENT MARKET, BY END-USE, 2022-2032 ($MILLION)
- TABLE 48. LAMEA 5G EQUIPMENT MARKET, BY COUNTRY, 2022-2032 ($MILLION)
- TABLE 49. LATIN AMERICA 5G EQUIPMENT MARKET, BY PRODUCT, 2022-2032 ($MILLION)
- TABLE 50. LATIN AMERICA 5G EQUIPMENT MARKET, BY END-USE, 2022-2032 ($MILLION)
- TABLE 51. MIDDLE EAST 5G EQUIPMENT MARKET, BY PRODUCT, 2022-2032 ($MILLION)
- TABLE 52. MIDDLE EAST 5G EQUIPMENT MARKET, BY END-USE, 2022-2032 ($MILLION)
- TABLE 53. AFRICA 5G EQUIPMENT MARKET, BY PRODUCT, 2022-2032 ($MILLION)
- TABLE 54. AFRICA 5G EQUIPMENT MARKET, BY END-USE, 2022-2032 ($MILLION)
- TABLE 55. CISCO SYSTEMS, INC.: KEY EXECUTIVES
- TABLE 56. CISCO SYSTEMS, INC.: COMPANY SNAPSHOT
- TABLE 57. CISCO SYSTEMS, INC.: SERVICE SEGMENTS
- TABLE 58. CISCO SYSTEMS, INC.: PRODUCT PORTFOLIO
- TABLE 59. CISCO SYSTEMS, INC.: KEY STRATERGIES
- TABLE 60. SAMSUNG ELECTRONICS: KEY EXECUTIVES
- TABLE 61. SAMSUNG ELECTRONICS: COMPANY SNAPSHOT
- TABLE 62. SAMSUNG ELECTRONICS: PRODUCT SEGMENTS
- TABLE 63. SAMSUNG ELECTRONICS: PRODUCT PORTFOLIO
- TABLE 64. SAMSUNG ELECTRONICS: KEY STRATERGIES
- TABLE 65. NEC CORPORATION: KEY EXECUTIVES
- TABLE 66. NEC CORPORATION: COMPANY SNAPSHOT
- TABLE 67. NEC CORPORATION: SERVICE SEGMENTS
- TABLE 68. NEC CORPORATION: PRODUCT PORTFOLIO
- TABLE 69. NEC CORPORATION: KEY STRATERGIES
- TABLE 70. HUAWEI TECHNOLOGIES CO., LTD.: KEY EXECUTIVES
- TABLE 71. HUAWEI TECHNOLOGIES CO., LTD.: COMPANY SNAPSHOT
- TABLE 72. HUAWEI TECHNOLOGIES CO., LTD.: SERVICE SEGMENTS
- TABLE 73. HUAWEI TECHNOLOGIES CO., LTD.: PRODUCT PORTFOLIO
- TABLE 74. HUAWEI TECHNOLOGIES CO., LTD.: KEY STRATERGIES
- TABLE 75. AT&T INC.: KEY EXECUTIVES
- TABLE 76. AT&T INC.: COMPANY SNAPSHOT
- TABLE 77. AT&T INC.: SERVICE SEGMENTS
- TABLE 78. AT&T INC.: PRODUCT PORTFOLIO
- TABLE 79. AT&T INC.: KEY STRATERGIES
- TABLE 80. VERIZON COMMUNICATIONS: KEY EXECUTIVES
- TABLE 81. VERIZON COMMUNICATIONS: COMPANY SNAPSHOT
- TABLE 82. VERIZON COMMUNICATIONS: PRODUCT SEGMENTS
- TABLE 83. VERIZON COMMUNICATIONS: SERVICE SEGMENTS
- TABLE 84. VERIZON COMMUNICATIONS: PRODUCT PORTFOLIO
- TABLE 85. QUALCOMM TECHNOLOGIES, INC. : KEY EXECUTIVES
- TABLE 86. QUALCOMM TECHNOLOGIES, INC. : COMPANY SNAPSHOT
- TABLE 87. QUALCOMM TECHNOLOGIES, INC. : SERVICE SEGMENTS
- TABLE 88. QUALCOMM TECHNOLOGIES, INC. : PRODUCT PORTFOLIO
- TABLE 89. QUALCOMM TECHNOLOGIES, INC. : KEY STRATERGIES
- TABLE 90. TELEFONAKTIEBOLAGET LM ERICSSON: KEY EXECUTIVES
- TABLE 91. TELEFONAKTIEBOLAGET LM ERICSSON: COMPANY SNAPSHOT
- TABLE 92. TELEFONAKTIEBOLAGET LM ERICSSON: SERVICE SEGMENTS
- TABLE 93. TELEFONAKTIEBOLAGET LM ERICSSON: PRODUCT PORTFOLIO
- TABLE 94. TELEFONAKTIEBOLAGET LM ERICSSON: KEY STRATERGIES
- TABLE 95. ZTE CORPORATION: KEY EXECUTIVES
- TABLE 96. ZTE CORPORATION: COMPANY SNAPSHOT
- TABLE 97. ZTE CORPORATION: PRODUCT SEGMENTS
- TABLE 98. ZTE CORPORATION: PRODUCT PORTFOLIO
- TABLE 99. NOKIA CORPORATION: KEY EXECUTIVES
- TABLE 100. NOKIA CORPORATION: COMPANY SNAPSHOT
- TABLE 101. NOKIA CORPORATION: SERVICE SEGMENTS
- TABLE 102. NOKIA CORPORATION: PRODUCT PORTFOLIO
- TABLE 103. NOKIA CORPORATION: KEY STRATERGIES
LIST OF FIGURES
- FIGURE 01. 5G EQUIPMENT MARKET, 2022-2032
- FIGURE 02. SEGMENTATION OF 5G EQUIPMENT MARKET,2022-2032
- FIGURE 03. TOP IMPACTING FACTORS IN 5G EQUIPMENT MARKET (2022 TO 2032)
- FIGURE 04. TOP INVESTMENT POCKETS IN 5G EQUIPMENT MARKET (2023-2032)
- FIGURE 05. LOW BARGAINING POWER OF SUPPLIERS
- FIGURE 06. LOW THREAT OF NEW ENTRANTS
- FIGURE 07. LOW THREAT OF SUBSTITUTES
- FIGURE 08. LOW INTENSITY OF RIVALRY
- FIGURE 09. LOW BARGAINING POWER OF BUYERS
- FIGURE 10. GLOBAL 5G EQUIPMENT MARKET:DRIVERS, RESTRAINTS AND OPPORTUNITIES
- FIGURE 11. REGULATORY GUIDELINES: 5G EQUIPMENT MARKET
- FIGURE 12. 5G EQUIPMENT MARKET, BY PRODUCT, 2022 AND 2032(%)
- FIGURE 13. COMPARATIVE SHARE ANALYSIS OF 5G EQUIPMENT MARKET FOR MACRO CELL, BY COUNTRY 2022 AND 2032(%)
- FIGURE 14. COMPARATIVE SHARE ANALYSIS OF 5G EQUIPMENT MARKET FOR SMALL CELL, BY COUNTRY 2022 AND 2032(%)
- FIGURE 15. COMPARATIVE SHARE ANALYSIS OF 5G EQUIPMENT MARKET FOR OTHERS, BY COUNTRY 2022 AND 2032(%)
- FIGURE 16. 5G EQUIPMENT MARKET, BY END-USE, 2022 AND 2032(%)
- FIGURE 17. COMPARATIVE SHARE ANALYSIS OF 5G EQUIPMENT MARKET FOR RETAIL SECTOR, BY COUNTRY 2022 AND 2032(%)
- FIGURE 18. COMPARATIVE SHARE ANALYSIS OF 5G EQUIPMENT MARKET FOR NON-RETAIL SECTOR, BY COUNTRY 2022 AND 2032(%)
- FIGURE 19. 5G EQUIPMENT MARKET BY REGION, 2022 AND 2032(%)
- FIGURE 20. U.S. 5G EQUIPMENT MARKET, 2022-2032 ($MILLION)
- FIGURE 21. CANADA 5G EQUIPMENT MARKET, 2022-2032 ($MILLION)
- FIGURE 22. UK 5G EQUIPMENT MARKET, 2022-2032 ($MILLION)
- FIGURE 23. GERMANY 5G EQUIPMENT MARKET, 2022-2032 ($MILLION)
- FIGURE 24. FRANCE 5G EQUIPMENT MARKET, 2022-2032 ($MILLION)
- FIGURE 25. ITALY 5G EQUIPMENT MARKET, 2022-2032 ($MILLION)
- FIGURE 26. SPAIN 5G EQUIPMENT MARKET, 2022-2032 ($MILLION)
- FIGURE 27. REST OF EUROPE 5G EQUIPMENT MARKET, 2022-2032 ($MILLION)
- FIGURE 28. CHINA 5G EQUIPMENT MARKET, 2022-2032 ($MILLION)
- FIGURE 29. JAPAN 5G EQUIPMENT MARKET, 2022-2032 ($MILLION)
- FIGURE 30. INDIA 5G EQUIPMENT MARKET, 2022-2032 ($MILLION)
- FIGURE 31. AUSTRALIA 5G EQUIPMENT MARKET, 2022-2032 ($MILLION)
- FIGURE 32. SOUTH KOREA 5G EQUIPMENT MARKET, 2022-2032 ($MILLION)
- FIGURE 33. REST OF ASIA-PACIFIC 5G EQUIPMENT MARKET, 2022-2032 ($MILLION)
- FIGURE 34. LATIN AMERICA 5G EQUIPMENT MARKET, 2022-2032 ($MILLION)
- FIGURE 35. MIDDLE EAST 5G EQUIPMENT MARKET, 2022-2032 ($MILLION)
- FIGURE 36. AFRICA 5G EQUIPMENT MARKET, 2022-2032 ($MILLION)
- FIGURE 37. TOP WINNING STRATEGIES, BY YEAR (2023-2023)
- FIGURE 38. TOP WINNING STRATEGIES, BY DEVELOPMENT (2023-2023)
- FIGURE 39. TOP WINNING STRATEGIES, BY COMPANY (2023-2023)
- FIGURE 40. PRODUCT MAPPING OF TOP 10 PLAYERS
- FIGURE 41. COMPETITIVE DASHBOARD
- FIGURE 42. COMPETITIVE HEATMAP: 5G EQUIPMENT MARKET
- FIGURE 43. TOP PLAYER POSITIONING, 2022
- FIGURE 44. CISCO SYSTEMS, INC.: NET REVENUE, 2021-2023 ($MILLION)
- FIGURE 45. CISCO SYSTEMS, INC.: RESEARCH & DEVELOPMENT EXPENDITURE, 2021-2023 ($MILLION)
- FIGURE 46. CISCO SYSTEMS, INC.: REVENUE SHARE BY SEGMENT, 2023 (%)
- FIGURE 47. CISCO SYSTEMS, INC.: REVENUE SHARE BY SEGMENT, 2023 (%)
- FIGURE 48. SAMSUNG ELECTRONICS: NET SALES, 2020-2022 ($MILLION)
- FIGURE 49. SAMSUNG ELECTRONICS: REVENUE SHARE BY SEGMENT, 2022 (%)
- FIGURE 50. SAMSUNG ELECTRONICS: REVENUE SHARE BY REGION, 2022 (%)
- FIGURE 51. NEC CORPORATION: NET REVENUE, 2020-2022 ($MILLION)
- FIGURE 52. NEC CORPORATION: REVENUE SHARE BY SEGMENT, 2022 (%)
- FIGURE 53. HUAWEI TECHNOLOGIES CO., LTD.: NET REVENUE, 2020-2022 ($MILLION)
- FIGURE 54. HUAWEI TECHNOLOGIES CO., LTD.: RESEARCH & DEVELOPMENT EXPENDITURE, 2020-2022 ($MILLION)
- FIGURE 55. HUAWEI TECHNOLOGIES CO., LTD.: REVENUE SHARE BY SEGMENT, 2022 (%)
- FIGURE 56. HUAWEI TECHNOLOGIES CO., LTD.: REVENUE SHARE BY REGION, 2022 (%)
- FIGURE 57. AT&T INC.: NET REVENUE, 2020-2022 ($MILLION)
- FIGURE 58. AT&T INC.: REVENUE SHARE BY SEGMENT, 2022 (%)
- FIGURE 59. AT&T INC.: REVENUE SHARE BY REGION, 2022 (%)
- FIGURE 60. VERIZON COMMUNICATIONS: NET REVENUE, 2020-2022 ($MILLION)
- FIGURE 61. VERIZON COMMUNICATIONS: REVENUE SHARE BY SEGMENT, 2022 (%)
- FIGURE 62. QUALCOMM TECHNOLOGIES, INC. : NET REVENUE, 2020-2022 ($MILLION)
- FIGURE 63. QUALCOMM TECHNOLOGIES, INC. : RESEARCH & DEVELOPMENT EXPENDITURE, 2020-2022 ($MILLION)
- FIGURE 64. QUALCOMM TECHNOLOGIES, INC. : REVENUE SHARE BY SEGMENT, 2022 (%)
- FIGURE 65. QUALCOMM TECHNOLOGIES, INC. : REVENUE SHARE BY REGION, 2022 (%)
- FIGURE 66. TELEFONAKTIEBOLAGET LM ERICSSON: NET REVENUE, 2020-2022 ($MILLION)
- FIGURE 67. TELEFONAKTIEBOLAGET LM ERICSSON: RESEARCH & DEVELOPMENT EXPENDITURE, 2020-2022 ($MILLION)
- FIGURE 68. TELEFONAKTIEBOLAGET LM ERICSSON: REVENUE SHARE BY SEGMENT, 2022 (%)
- FIGURE 69. TELEFONAKTIEBOLAGET LM ERICSSON: REVENUE SHARE BY REGION, 2022 (%)
- FIGURE 70. ZTE CORPORATION: NET SALES, 2020-2022 ($MILLION)
- FIGURE 71. ZTE CORPORATION: REVENUE SHARE BY SEGMENT, 2022 (%)
- FIGURE 72. ZTE CORPORATION: REVENUE SHARE BY REGION, 2022 (%)
- FIGURE 73. NOKIA CORPORATION: NET REVENUE, 2020-2022 ($MILLION)
- FIGURE 74. NOKIA CORPORATION: RESEARCH & DEVELOPMENT EXPENDITURE, 2020-2022 ($MILLION)
- FIGURE 75. NOKIA CORPORATION: REVENUE SHARE BY SEGMENT, 2022 (%)
- FIGURE 76. NOKIA CORPORATION: REVENUE SHARE BY REGION, 2022 (%)
 5G 设备:市场占有率分析、产业趋势与统计、成长预测(2024-2029 年)
 2024-2032 年按技术(网路功能虚拟化、软体定义网路、多接入边缘运算)、设备、架构(5G 独立、5G NR 非独立)、频率、应用和区域分類的 5G 设备市场
 5G 设备市场报告:2030 年趋势、预测与竞争分析
 2024 年 5G 设备测试全球市场报告
 5G 行动装置、功能和技术:供应商、趋势和预测
 5G行动装置厂商市场份额
 未来 5G 行动装置:报告的特性和功能(2023 年第 3 季)
 5G 设备测试市场规模和预测、全球和地区份额、趋势和成长机会分析报告范围:按组成部分;和最终用户
 5G 设备市场规模、份额、趋势分析报告:2023-2030 年按外形尺寸、频谱、地区和细分市场分類的趋势
 5G设备市场(2023-2028):按外形尺寸、用例、设备类型(移动、CPE)、部门(消费者、企业、工业、政府)、频段