


 |
市场调查报告书
商品编码
1414929
咖啡包市场:按口味、分销管道、咖啡馆浓度和最终用途分类:2023-2032 年全球机会分析和产业预测Coffee Pod Market By Flavor, By Distribution Channel, By Caffeine Concentration, By End Use : Global Opportunity Analysis and Industry Forecast, 2023-2032 |
||||||
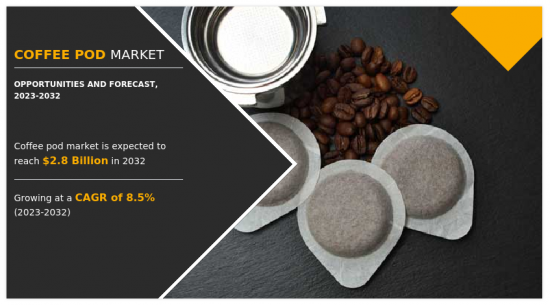
2022 年咖啡包市场价值为 12 亿美元,预计 2023 年至 2032 年复合年增长率为 8.5%,到 2032 年将达到 28 亿美元。
咖啡包是单份咖啡容器,用于製备各种类型的咖啡饮料。这些咖啡包由可回收的纸质扁平袋製成,里面装有预先计量好的压榨咖啡。与咖啡胶囊不同,咖啡包含大量咖啡,可在多台带有手柄的机器中使用。
对永续性和环境足迹的认识是咖啡包市场的主要驱动因素。由于其环保包装和可回收方面,咖啡包提供了市场上其他单份咖啡容器选项(例如铝包装咖啡胶囊)的最佳替代品。为此,许多公司正在推出由生物分解性材料製成的一次性容器。随着咖啡消费量的不断增加,人们希望减少与产品包装相关的碳排放。此外,消费者要求供应链透明度和原材料采购讯息,以遏制不道德的商业行为。透明度使品牌能够在各种型态的供应链中建立信任。
社会和文化影响在推动消费者消费趋势方面发挥着重要作用。透过网路、社群媒体和名人,全世界对健康消费习惯的认识大大提高。由于这些因素,消费者的存在和新客户开始意识到各种可用的产品和它们。许多人喝咖啡是因为它对改善和调节新陈代谢、认知和警觉性等身体功能有多种作用。此外,为了减少累积的压力、焦虑和对未来的恐惧(这些压力、焦虑和对未来的恐惧与社交互动和孤立的减少密切相关),消费者越来越认为咖啡是一种高度提神的饮料。
咖啡馆是一种天然兴奋剂,具有多种益处,例如改善新陈代谢、警觉性和认知功能。随着生活方式的改变使我们的生活变得更加忙碌,再加上社交互动减少和孤立等心理挑战因素,咖啡作为一种休息方式受到追捧。无论是会议、阅读、工作或休閒聚会,咖啡在提升体验方面都扮演着重要角色。消费者也在与恐惧和焦虑作斗争,人们经常透过喝咖啡休息来减轻压力。咖啡包因其提供的便利性而变得非常普及。
欧洲、北美和南美等已开发经济体的消费者正在寻求更具创新性的产品,并且更有可能先尝试它们。这些消费者拥有更高的可支配收入,可能会引领咖啡包的普及。这些地区国家的技术、识字率和其他发展指标更加发达,使人民更了解新的解决方案,更有能力应对生活方式的新变化。此外,咖啡机是使用咖啡包的先决条件,而富裕国家的人们比开发中国家的人们更有可能负担得起咖啡机,因此潜在需求更大。
然而,这个市场受到周围供应链、生态和环境挑战的显着影响。领先的咖啡包製造商咖啡馆 Borbon 报告称,由于製造成本增加,利润下降了 27%。成本增加导致产品价格上涨,影响盈利和销售。咖啡市场上的许多公司都在报告俄罗斯和乌克兰之间战争的影响。许多地区通膨急剧上升也导致物价上涨。根据国际咖啡组织(ICO)发布的报告,2021/22年度咖啡产量下降1.4%,至1.685亿袋。这些产量下降是由于天气、环境条件恶化和化肥成本增加所造成的。
随着对咖啡包的需求不断增加,各公司正在扩大其在国际市场的地理影响力。随着咖啡包的潜力变得越来越清晰,公司正在探索伙伴关係、协作和其他策略。 Caffe Borbone 和 Illycaffe 正在投资扩大其在美国市场的业务。然而,国际市场面临更高的竞争挑战。
包包咖啡深受义大利、法国、德国、巴西、美国等已开发国家消费者的欢迎。然而,企业在拓展国际市场时面临竞争。义大利咖啡公司Illycaffe已成为欧洲地区咖啡包和其他产品的强大供应商,但与国内市场相比,国际市场的扩张一直很困难。他表示,需要付出巨大的努力才能维持下去。它。另一方面,全球扩张将为企业带来新的机会。
目录
第一章简介
第 2 章执行摘要
第三章市场概况
- 市场定义和范围
- 主要发现
- 影响因素
- 主要投资机会
- 波特五力分析
- 市场动态
- 促进因素
- 对永续性和环境足迹的认识不断增强
- 购买力和家庭消费增加
- 采用更健康的生活方式
- 抑制因素
- 价格和生产成本上涨
- 全球竞争加剧
- 机会
- 对调味和咖啡馆咖啡的需求
- 促进因素
第四章 咖啡包市场:依口味
- 概述
- 焦糖
- 巧克力
- 榛子
- 其他的
第五章咖啡包市场:按分销管道
- 概述
- 大卖场/超级市场
- 专卖店
- 线上通路
- 其他的
第六章 咖啡包市场:依咖啡馆浓度分类
- 概述
- 含有咖啡馆
- 咖啡馆
第七章咖啡包市场:依最终用户分类
- 概述
- 商务用
- 住宅
第八章咖啡包市场:按地区
- 概述
- 北美洲
- 美国
- 加拿大
- 墨西哥
- 欧洲
- 德国
- 英国
- 西班牙
- 义大利
- 法国
- 其他的
- 亚太地区
- 中国
- 日本
- 印度
- 韩国
- 澳洲
- 新加坡
- 纽西兰
- 其他的
- 拉丁美洲/中东/非洲
- 巴西
- 阿根廷
- 南非
- 沙乌地阿拉伯
- 阿拉伯聯合大公国
- 其他的
第9章 竞争形势
- 介绍
- 关键成功策略
- 10家主要企业产品图谱
- 竞争对手仪表板
- 竞争热图
- 主要企业定位(2022年)
第十章 公司简介
- illycaffe SpA
- Lavazza Group
- Caffe Borbone Srl
- Labcaffe Srl
- Procaffe SpA
- Segafredo Zanetti SpA
- Kimbo SpA
- Gruppo Izzo Srl
- Gruppo Gimoka SpA
- Blasercafe AG
According to a new report published by Allied Market Research, titled, "Coffee Pod Market," The coffee pod market was valued at $1.2 billion in 2022, and is estimated to reach $2.8 billion by 2032, growing at a CAGR of 8.5% from 2023 to 2032.
A coffee pod is a single-serve coffee container that is used to prepare various types of coffee drinks. These pods are made with recyclable paper-based, flat bags, inside which a pre-measured dose of pressed coffee is packed. Unlike coffee capsules, pods contain a higher volume of coffee and can be used with multiple machines that are equipped with portafilter.
Sustainability and consciousness surrounding environmental footprint are major drivers for the coffee pod market. Due to eco-friendly packaging and recyclable aspects, coffee pods provide the best alternative to other single-serve coffee container options available on the market like aluminum packaging-based coffee capsules. In response, many companies are introducing single-serve containers that are made using biodegradable material. With ever-increasing coffee consumption, people subsequently want to reduce their carbon footprint which is associated with product packaging. In addition, consumers also demand supply chain transparency and raw material sourcing information to contain unethical business practices. Transparency allows brands to build trust in different modes of supply chain.
Social and cultural influences play an important role in driving consumer consumption trends. Global awareness about healthy consumption habits is largely spread through the internet, social media, and celebrities. Due to these factors consumers exist, and new customers become aware of the variety of products available and them. Many people consume coffee as it offers various benefits in improving and regulating body functions like metabolism, cognition, and alertness. Furthermore, to reduce the accumulated stress, anxiety, and fear about the future that is strongly linked with decreased social interaction and isolation, consumers perceive coffee as a highly refreshing beverage during various settings like meetings, reading, and other social events.
Caffeine, a natural stimulant, provides various advantages such as improvement in metabolism, alertness, and cognitive function. With changes in lifestyles that are making lives busier and compounded with factors like decreased social interactions, isolation, and other mentally challenging aspects coffee is sought after as a break. In numerous settings like meetings, reading, work, and casual meetups, coffee plays an important role in enhancing their experience. Consumers also struggle with fear and anxiety coffee breaks are often taken to reduce stress. Due to the convenience offered by coffee pods, they are becoming largely popular.
Consumers in developed economies in regions like Europe, and North and South America, demand more innovative products and are likely to be the first to try. These consumers have high disposable incomes and are potentially leading in terms of coffee pod adoption. Countries in these regions have more developed technology, literacy rate, and other developmental indicators due to which people become more aware of new solutions and are in a better position to accommodate new changes in their lifestyles. In addition, coffee machines are a prerequisite in using a coffee pod, and people in richer countries are more likely to afford it, thus posing a greater potential for demand, unlike developing economies.
However, the market is significantly impacted by the surrounding challenges in the supply chain, ecological, and environmental aspects. Caffe Borbone, a leading coffee pod manufacturing company, reported a fall in profits of 27% due to increased production costs. Increased costs result in more expensive products, thus impacting profitability and sales. Many companies in the coffee market have reported an impact due to the war between Russia and Ukraine. In addition, soaring inflation in many regions also contributes to elevating prices. According to the report published by the International Coffee Organization (ICO), coffee production in the year 2021/22 decreased by 1.4% to 168.5 million bags. These decreased production volumes were attributed to worsening weather, environmental conditions, and increased cost of fertilizers.
With the increased demand for coffee pods companies are expanding their geographical presence in their international markets. As the potential for coffee pods becomes apparent companies are seeking partnerships, collaborations, and other strategies. Caffe Borbone and Illycaffe are investing to expand their businesses in the U.S. market. However, international markets pose higher competition challenges.
Coffee pods are popular among consumers in developed economies such as Italy, France, Germany, Brazil, and the U.S. However, companies face competition with business expansion in international markets. Illycaffe, an Italian coffee company, that has established itself as a strong coffee pods and other products supplier in the Europe region stated expanding in the international market is challenging and requires an enormous amount of effort to sustain, compared to domestic markets. However, global expansion presents newer opportunities to companies.
The coffee pods market is analyzed on the basis of flavor, caffeine concentration, end use, distribution channel, and region. By flavor, the market is classified into caramel, chocolate, hazelnut, and others. By caffeine concentration, the market is classified as caffeinated and decaffeinated. By end use the market is classified into commercial and residential. By distribution channel the market is classified into hypermarket/supermarket, specialty stores, online channels, and others. By region, the market is analyzed for North America (U.S., Canada, and Mexico), Europe (the UK, Germany, Spain, France, Italy, and Rest of Europe), Asia-Pacific (China, Japan, India, Australia, New Zealand, South Korea, Singapore, and Rest of Asia-Pacific) and LAMEA (Saudi Arabia, Brazil, UAE, Argentina, South Africa, and Rest of LAMEA).
Players operating in the coffee pod market have adopted various developmental strategies to expand their coffee pod market share, increase profitability, and remain competitive in the market. Key players profiled in this report include illycaffe S.p.A., Lavazza Group, Gruppo Izzo S.r.l., Procaffe S.p.A., Labcaffe S.r.l., Kimbo S.p.A., Gruppo Gimoka S.p.A., Blasercafe AG, Caffe Borbone S.r.l., and Segafredo Zanetti S.p.A.
Key Benefits For Stakeholders
- This report provides a quantitative analysis of the market segments, current trends, estimations, and dynamics of the coffee pod market analysis from 2022 to 2032 to identify the prevailing coffee pod market opportunities.
- The market research is offered along with information related to key drivers, restraints, and opportunities.
- Porter's five forces analysis highlights the potency of buyers and suppliers to enable stakeholders make profit-oriented business decisions and strengthen their supplier-buyer network.
- In-depth analysis of the coffee pod market segmentation assists to determine the prevailing market opportunities.
- Major countries in each region are mapped according to their revenue contribution to the global market.
- Market player positioning facilitates benchmarking and provides a clear understanding of the present position of the market players.
- The report includes the analysis of the regional as well as global coffee pod market trends, key players, market segments, application areas, and market growth strategies.
Additional benefits you will get with this purchase are:
- Quarterly Update and* (only available with a corporate license, on listed price)
- 5 additional Company Profile of client Choice pre- or Post-purchase, as a free update.
- Free Upcoming Version on the Purchase of Five and Enterprise User License.
- 16 analyst hours of support* (post-purchase, if you find additional data requirements upon review of the report, you may receive support amounting to 16 analyst hours to solve questions, and post-sale queries)
- 15% Free Customization* (in case the scope or segment of the report does not match your requirements, 15% is equivalent to 3 working days of free work, applicable once)
- Free data Pack on the Five and Enterprise User License. (Excel version of the report)
- Free Updated report if the report is 6-12 months old or older.
- 24-hour priority response*
- Free Industry updates and white papers.
Possible Customization with this report (with additional cost and timeline, please talk to the sales executive to know more)
- Additional company profiles with specific to client's interest
- Additional country or region analysis- market size and forecast
- Brands Share Analysis
- Expanded list for Company Profiles
- Historic market data
- SWOT Analysis
Key Market Segments
By Caffeine Concentration
- Caffeinated
- Decaffeinated
By Flavor
- Caramel
- Chocolate
- Hazelnut
- Others
By Distribution Channel
- Hypermarkets/Supermarkets
- Specialty Stores
- Online Channel
- Others
By End Use
- Commercial
- Residential
By Region
- North America
- U.S.
- Canada
- Mexico
- Europe
- Germany
- UK
- Spain
- Italy
- France
- Rest of Europe
- Asia-Pacific
- China
- Japan
- India
- South Korea
- Australia
- Singapore
- New Zealand
- Rest of Asia-Pacific
- LAMEA
- Brazil
- Argentina
- South Africa
- Saudi Arabia
- UAE
- Rest of LAMEA
Key Market Players:
- Kimbo S.p.A.
- illycaffe S.p.A.
- Gruppo Gimoka S.p.A.
- Blasercafe AG
- Gruppo Izzo S.r.l.
- Segafredo Zanetti S.p.A.
- Lavazza Group
- Procaffe S.p.A.
- Labcaffe S.r.l.
- Caffe Borbone S.r.l.
TABLE OF CONTENTS
CHAPTER 1: INTRODUCTION
- 1.1. Report description
- 1.2. Key market segments
- 1.3. Key benefits to the stakeholders
- 1.4. Research methodology
- 1.4.1. Primary research
- 1.4.2. Secondary research
- 1.4.3. Analyst tools and models
CHAPTER 2: EXECUTIVE SUMMARY
- 2.1. CXO Perspective
CHAPTER 3: MARKET OVERVIEW
- 3.1. Market definition and scope
- 3.2. Key findings
- 3.2.1. Top impacting factors
- 3.2.2. Top investment pockets
- 3.3. Porter's five forces analysis
- 3.3.1. Low bargaining power of suppliers
- 3.3.2. Moderate threat of new entrants
- 3.3.3. Moderate threat of substitutes
- 3.3.4. Moderate intensity of rivalry
- 3.3.5. Moderate bargaining power of buyers
- 3.4. Market dynamics
- 3.4.1. Drivers
- 3.4.1.1. Increase in awareness about sustainability and environmental footprint
- 3.4.1.2. Increase in purchasing power and at-home consumption
- 3.4.1.3. Adoption of healthier lifestyles
- 3.4.2. Restraints
- 3.4.2.1. Rise in prices and production costs
- 3.4.2.2. High competition on a global level
- 3.4.3. Opportunities
- 3.4.3.1. Demand for flavors and decaffeinated coffee
- 3.4.1. Drivers
CHAPTER 4: COFFEE POD MARKET, BY FLAVOR
- 4.1. Overview
- 4.1.1. Market size and forecast
- 4.2. Caramel
- 4.2.1. Key market trends, growth factors and opportunities
- 4.2.2. Market size and forecast, by region
- 4.2.3. Market share analysis by country
- 4.3. Chocolate
- 4.3.1. Key market trends, growth factors and opportunities
- 4.3.2. Market size and forecast, by region
- 4.3.3. Market share analysis by country
- 4.4. Hazelnut
- 4.4.1. Key market trends, growth factors and opportunities
- 4.4.2. Market size and forecast, by region
- 4.4.3. Market share analysis by country
- 4.5. Others
- 4.5.1. Key market trends, growth factors and opportunities
- 4.5.2. Market size and forecast, by region
- 4.5.3. Market share analysis by country
CHAPTER 5: COFFEE POD MARKET, BY DISTRIBUTION CHANNEL
- 5.1. Overview
- 5.1.1. Market size and forecast
- 5.2. Hypermarkets/Supermarkets
- 5.2.1. Key market trends, growth factors and opportunities
- 5.2.2. Market size and forecast, by region
- 5.2.3. Market share analysis by country
- 5.3. Specialty Stores
- 5.3.1. Key market trends, growth factors and opportunities
- 5.3.2. Market size and forecast, by region
- 5.3.3. Market share analysis by country
- 5.4. Online Channel
- 5.4.1. Key market trends, growth factors and opportunities
- 5.4.2. Market size and forecast, by region
- 5.4.3. Market share analysis by country
- 5.5. Others
- 5.5.1. Key market trends, growth factors and opportunities
- 5.5.2. Market size and forecast, by region
- 5.5.3. Market share analysis by country
CHAPTER 6: COFFEE POD MARKET, BY CAFFEINE CONCENTRATION
- 6.1. Overview
- 6.1.1. Market size and forecast
- 6.2. Caffeinated
- 6.2.1. Key market trends, growth factors and opportunities
- 6.2.2. Market size and forecast, by region
- 6.2.3. Market share analysis by country
- 6.3. Decaffeinated
- 6.3.1. Key market trends, growth factors and opportunities
- 6.3.2. Market size and forecast, by region
- 6.3.3. Market share analysis by country
CHAPTER 7: COFFEE POD MARKET, BY END USE
- 7.1. Overview
- 7.1.1. Market size and forecast
- 7.2. Commercial
- 7.2.1. Key market trends, growth factors and opportunities
- 7.2.2. Market size and forecast, by region
- 7.2.3. Market share analysis by country
- 7.3. Residential
- 7.3.1. Key market trends, growth factors and opportunities
- 7.3.2. Market size and forecast, by region
- 7.3.3. Market share analysis by country
CHAPTER 8: COFFEE POD MARKET, BY REGION
- 8.1. Overview
- 8.1.1. Market size and forecast By Region
- 8.2. North America
- 8.2.1. Key market trends, growth factors and opportunities
- 8.2.2. Market size and forecast, by Flavor
- 8.2.3. Market size and forecast, by Distribution Channel
- 8.2.4. Market size and forecast, by Caffeine Concentration
- 8.2.5. Market size and forecast, by End Use
- 8.2.6. Market size and forecast, by country
- 8.2.6.1. U.S.
- 8.2.6.1.1. Market size and forecast, by Flavor
- 8.2.6.1.2. Market size and forecast, by Distribution Channel
- 8.2.6.1.3. Market size and forecast, by Caffeine Concentration
- 8.2.6.1.4. Market size and forecast, by End Use
- 8.2.6.2. Canada
- 8.2.6.2.1. Market size and forecast, by Flavor
- 8.2.6.2.2. Market size and forecast, by Distribution Channel
- 8.2.6.2.3. Market size and forecast, by Caffeine Concentration
- 8.2.6.2.4. Market size and forecast, by End Use
- 8.2.6.3. Mexico
- 8.2.6.3.1. Market size and forecast, by Flavor
- 8.2.6.3.2. Market size and forecast, by Distribution Channel
- 8.2.6.3.3. Market size and forecast, by Caffeine Concentration
- 8.2.6.3.4. Market size and forecast, by End Use
- 8.3. Europe
- 8.3.1. Key market trends, growth factors and opportunities
- 8.3.2. Market size and forecast, by Flavor
- 8.3.3. Market size and forecast, by Distribution Channel
- 8.3.4. Market size and forecast, by Caffeine Concentration
- 8.3.5. Market size and forecast, by End Use
- 8.3.6. Market size and forecast, by country
- 8.3.6.1. Germany
- 8.3.6.1.1. Market size and forecast, by Flavor
- 8.3.6.1.2. Market size and forecast, by Distribution Channel
- 8.3.6.1.3. Market size and forecast, by Caffeine Concentration
- 8.3.6.1.4. Market size and forecast, by End Use
- 8.3.6.2. UK
- 8.3.6.2.1. Market size and forecast, by Flavor
- 8.3.6.2.2. Market size and forecast, by Distribution Channel
- 8.3.6.2.3. Market size and forecast, by Caffeine Concentration
- 8.3.6.2.4. Market size and forecast, by End Use
- 8.3.6.3. Spain
- 8.3.6.3.1. Market size and forecast, by Flavor
- 8.3.6.3.2. Market size and forecast, by Distribution Channel
- 8.3.6.3.3. Market size and forecast, by Caffeine Concentration
- 8.3.6.3.4. Market size and forecast, by End Use
- 8.3.6.4. Italy
- 8.3.6.4.1. Market size and forecast, by Flavor
- 8.3.6.4.2. Market size and forecast, by Distribution Channel
- 8.3.6.4.3. Market size and forecast, by Caffeine Concentration
- 8.3.6.4.4. Market size and forecast, by End Use
- 8.3.6.5. France
- 8.3.6.5.1. Market size and forecast, by Flavor
- 8.3.6.5.2. Market size and forecast, by Distribution Channel
- 8.3.6.5.3. Market size and forecast, by Caffeine Concentration
- 8.3.6.5.4. Market size and forecast, by End Use
- 8.3.6.6. Rest of Europe
- 8.3.6.6.1. Market size and forecast, by Flavor
- 8.3.6.6.2. Market size and forecast, by Distribution Channel
- 8.3.6.6.3. Market size and forecast, by Caffeine Concentration
- 8.3.6.6.4. Market size and forecast, by End Use
- 8.4. Asia-Pacific
- 8.4.1. Key market trends, growth factors and opportunities
- 8.4.2. Market size and forecast, by Flavor
- 8.4.3. Market size and forecast, by Distribution Channel
- 8.4.4. Market size and forecast, by Caffeine Concentration
- 8.4.5. Market size and forecast, by End Use
- 8.4.6. Market size and forecast, by country
- 8.4.6.1. China
- 8.4.6.1.1. Market size and forecast, by Flavor
- 8.4.6.1.2. Market size and forecast, by Distribution Channel
- 8.4.6.1.3. Market size and forecast, by Caffeine Concentration
- 8.4.6.1.4. Market size and forecast, by End Use
- 8.4.6.2. Japan
- 8.4.6.2.1. Market size and forecast, by Flavor
- 8.4.6.2.2. Market size and forecast, by Distribution Channel
- 8.4.6.2.3. Market size and forecast, by Caffeine Concentration
- 8.4.6.2.4. Market size and forecast, by End Use
- 8.4.6.3. India
- 8.4.6.3.1. Market size and forecast, by Flavor
- 8.4.6.3.2. Market size and forecast, by Distribution Channel
- 8.4.6.3.3. Market size and forecast, by Caffeine Concentration
- 8.4.6.3.4. Market size and forecast, by End Use
- 8.4.6.4. South Korea
- 8.4.6.4.1. Market size and forecast, by Flavor
- 8.4.6.4.2. Market size and forecast, by Distribution Channel
- 8.4.6.4.3. Market size and forecast, by Caffeine Concentration
- 8.4.6.4.4. Market size and forecast, by End Use
- 8.4.6.5. Australia
- 8.4.6.5.1. Market size and forecast, by Flavor
- 8.4.6.5.2. Market size and forecast, by Distribution Channel
- 8.4.6.5.3. Market size and forecast, by Caffeine Concentration
- 8.4.6.5.4. Market size and forecast, by End Use
- 8.4.6.6. Singapore
- 8.4.6.6.1. Market size and forecast, by Flavor
- 8.4.6.6.2. Market size and forecast, by Distribution Channel
- 8.4.6.6.3. Market size and forecast, by Caffeine Concentration
- 8.4.6.6.4. Market size and forecast, by End Use
- 8.4.6.7. New Zealand
- 8.4.6.7.1. Market size and forecast, by Flavor
- 8.4.6.7.2. Market size and forecast, by Distribution Channel
- 8.4.6.7.3. Market size and forecast, by Caffeine Concentration
- 8.4.6.7.4. Market size and forecast, by End Use
- 8.4.6.8. Rest of Asia-Pacific
- 8.4.6.8.1. Market size and forecast, by Flavor
- 8.4.6.8.2. Market size and forecast, by Distribution Channel
- 8.4.6.8.3. Market size and forecast, by Caffeine Concentration
- 8.4.6.8.4. Market size and forecast, by End Use
- 8.5. LAMEA
- 8.5.1. Key market trends, growth factors and opportunities
- 8.5.2. Market size and forecast, by Flavor
- 8.5.3. Market size and forecast, by Distribution Channel
- 8.5.4. Market size and forecast, by Caffeine Concentration
- 8.5.5. Market size and forecast, by End Use
- 8.5.6. Market size and forecast, by country
- 8.5.6.1. Brazil
- 8.5.6.1.1. Market size and forecast, by Flavor
- 8.5.6.1.2. Market size and forecast, by Distribution Channel
- 8.5.6.1.3. Market size and forecast, by Caffeine Concentration
- 8.5.6.1.4. Market size and forecast, by End Use
- 8.5.6.2. Argentina
- 8.5.6.2.1. Market size and forecast, by Flavor
- 8.5.6.2.2. Market size and forecast, by Distribution Channel
- 8.5.6.2.3. Market size and forecast, by Caffeine Concentration
- 8.5.6.2.4. Market size and forecast, by End Use
- 8.5.6.3. South Africa
- 8.5.6.3.1. Market size and forecast, by Flavor
- 8.5.6.3.2. Market size and forecast, by Distribution Channel
- 8.5.6.3.3. Market size and forecast, by Caffeine Concentration
- 8.5.6.3.4. Market size and forecast, by End Use
- 8.5.6.4. Saudi Arabia
- 8.5.6.4.1. Market size and forecast, by Flavor
- 8.5.6.4.2. Market size and forecast, by Distribution Channel
- 8.5.6.4.3. Market size and forecast, by Caffeine Concentration
- 8.5.6.4.4. Market size and forecast, by End Use
- 8.5.6.5. UAE
- 8.5.6.5.1. Market size and forecast, by Flavor
- 8.5.6.5.2. Market size and forecast, by Distribution Channel
- 8.5.6.5.3. Market size and forecast, by Caffeine Concentration
- 8.5.6.5.4. Market size and forecast, by End Use
- 8.5.6.6. Rest of LAMEA
- 8.5.6.6.1. Market size and forecast, by Flavor
- 8.5.6.6.2. Market size and forecast, by Distribution Channel
- 8.5.6.6.3. Market size and forecast, by Caffeine Concentration
- 8.5.6.6.4. Market size and forecast, by End Use
CHAPTER 9: COMPETITIVE LANDSCAPE
- 9.1. Introduction
- 9.2. Top winning strategies
- 9.3. Product mapping of top 10 player
- 9.4. Competitive dashboard
- 9.5. Competitive heatmap
- 9.6. Top player positioning, 2022
CHAPTER 10: COMPANY PROFILES
- 10.1. illycaffe S.p.A.
- 10.1.1. Company overview
- 10.1.2. Key executives
- 10.1.3. Company snapshot
- 10.1.4. Operating business segments
- 10.1.5. Product portfolio
- 10.1.6. Business performance
- 10.2. Lavazza Group
- 10.2.1. Company overview
- 10.2.2. Key executives
- 10.2.3. Company snapshot
- 10.2.4. Operating business segments
- 10.2.5. Product portfolio
- 10.2.6. Business performance
- 10.2.7. Key strategic moves and developments
- 10.3. Caffe Borbone S.r.l.
- 10.3.1. Company overview
- 10.3.2. Key executives
- 10.3.3. Company snapshot
- 10.3.4. Operating business segments
- 10.3.5. Product portfolio
- 10.3.6. Business performance
- 10.3.7. Key strategic moves and developments
- 10.4. Labcaffe S.r.l.
- 10.4.1. Company overview
- 10.4.2. Key executives
- 10.4.3. Company snapshot
- 10.4.4. Product portfolio
- 10.5. Procaffe S.p.A.
- 10.5.1. Company overview
- 10.5.2. Key executives
- 10.5.3. Company snapshot
- 10.5.4. Product portfolio
- 10.6. Segafredo Zanetti S.p.A.
- 10.6.1. Company overview
- 10.6.2. Key executives
- 10.6.3. Company snapshot
- 10.6.4. Operating business segments
- 10.6.5. Product portfolio
- 10.6.6. Key strategic moves and developments
- 10.7. Kimbo S.p.A.
- 10.7.1. Company overview
- 10.7.2. Key executives
- 10.7.3. Company snapshot
- 10.7.4. Product portfolio
- 10.8. Gruppo Izzo S.r.l.
- 10.8.1. Company overview
- 10.8.2. Key executives
- 10.8.3. Company snapshot
- 10.8.4. Operating business segments
- 10.8.5. Product portfolio
- 10.9. Gruppo Gimoka S.p.A.
- 10.9.1. Company overview
- 10.9.2. Key executives
- 10.9.3. Company snapshot
- 10.9.4. Operating business segments
- 10.9.5. Product portfolio
- 10.9.6. Key strategic moves and developments
- 10.10. Blasercafe AG
- 10.10.1. Company overview
- 10.10.2. Key executives
- 10.10.3. Company snapshot
- 10.10.4. Product portfolio
LIST OF TABLES
- TABLE 01. GLOBAL COFFEE POD MARKET, BY FLAVOR, 2022-2032 ($MILLION)
- TABLE 02. COFFEE POD MARKET FOR CARAMEL, BY REGION, 2022-2032 ($MILLION)
- TABLE 03. COFFEE POD MARKET FOR CHOCOLATE, BY REGION, 2022-2032 ($MILLION)
- TABLE 04. COFFEE POD MARKET FOR HAZELNUT, BY REGION, 2022-2032 ($MILLION)
- TABLE 05. COFFEE POD MARKET FOR OTHERS, BY REGION, 2022-2032 ($MILLION)
- TABLE 06. GLOBAL COFFEE POD MARKET, BY DISTRIBUTION CHANNEL, 2022-2032 ($MILLION)
- TABLE 07. COFFEE POD MARKET FOR HYPERMARKETS/SUPERMARKETS, BY REGION, 2022-2032 ($MILLION)
- TABLE 08. COFFEE POD MARKET FOR SPECIALTY STORES, BY REGION, 2022-2032 ($MILLION)
- TABLE 09. COFFEE POD MARKET FOR ONLINE CHANNEL, BY REGION, 2022-2032 ($MILLION)
- TABLE 10. COFFEE POD MARKET FOR OTHERS, BY REGION, 2022-2032 ($MILLION)
- TABLE 11. GLOBAL COFFEE POD MARKET, BY CAFFEINE CONCENTRATION, 2022-2032 ($MILLION)
- TABLE 12. COFFEE POD MARKET FOR CAFFEINATED, BY REGION, 2022-2032 ($MILLION)
- TABLE 13. COFFEE POD MARKET FOR DECAFFEINATED, BY REGION, 2022-2032 ($MILLION)
- TABLE 14. GLOBAL COFFEE POD MARKET, BY END USE, 2022-2032 ($MILLION)
- TABLE 15. COFFEE POD MARKET FOR COMMERCIAL, BY REGION, 2022-2032 ($MILLION)
- TABLE 16. COFFEE POD MARKET FOR RESIDENTIAL, BY REGION, 2022-2032 ($MILLION)
- TABLE 17. COFFEE POD MARKET, BY REGION, 2022-2032 ($MILLION)
- TABLE 18. NORTH AMERICA COFFEE POD MARKET, BY FLAVOR, 2022-2032 ($MILLION)
- TABLE 19. NORTH AMERICA COFFEE POD MARKET, BY DISTRIBUTION CHANNEL, 2022-2032 ($MILLION)
- TABLE 20. NORTH AMERICA COFFEE POD MARKET, BY CAFFEINE CONCENTRATION, 2022-2032 ($MILLION)
- TABLE 21. NORTH AMERICA COFFEE POD MARKET, BY END USE, 2022-2032 ($MILLION)
- TABLE 22. NORTH AMERICA COFFEE POD MARKET, BY COUNTRY, 2022-2032 ($MILLION)
- TABLE 23. U.S. COFFEE POD MARKET, BY FLAVOR, 2022-2032 ($MILLION)
- TABLE 24. U.S. COFFEE POD MARKET, BY DISTRIBUTION CHANNEL, 2022-2032 ($MILLION)
- TABLE 25. U.S. COFFEE POD MARKET, BY CAFFEINE CONCENTRATION, 2022-2032 ($MILLION)
- TABLE 26. U.S. COFFEE POD MARKET, BY END USE, 2022-2032 ($MILLION)
- TABLE 27. CANADA COFFEE POD MARKET, BY FLAVOR, 2022-2032 ($MILLION)
- TABLE 28. CANADA COFFEE POD MARKET, BY DISTRIBUTION CHANNEL, 2022-2032 ($MILLION)
- TABLE 29. CANADA COFFEE POD MARKET, BY CAFFEINE CONCENTRATION, 2022-2032 ($MILLION)
- TABLE 30. CANADA COFFEE POD MARKET, BY END USE, 2022-2032 ($MILLION)
- TABLE 31. MEXICO COFFEE POD MARKET, BY FLAVOR, 2022-2032 ($MILLION)
- TABLE 32. MEXICO COFFEE POD MARKET, BY DISTRIBUTION CHANNEL, 2022-2032 ($MILLION)
- TABLE 33. MEXICO COFFEE POD MARKET, BY CAFFEINE CONCENTRATION, 2022-2032 ($MILLION)
- TABLE 34. MEXICO COFFEE POD MARKET, BY END USE, 2022-2032 ($MILLION)
- TABLE 35. EUROPE COFFEE POD MARKET, BY FLAVOR, 2022-2032 ($MILLION)
- TABLE 36. EUROPE COFFEE POD MARKET, BY DISTRIBUTION CHANNEL, 2022-2032 ($MILLION)
- TABLE 37. EUROPE COFFEE POD MARKET, BY CAFFEINE CONCENTRATION, 2022-2032 ($MILLION)
- TABLE 38. EUROPE COFFEE POD MARKET, BY END USE, 2022-2032 ($MILLION)
- TABLE 39. EUROPE COFFEE POD MARKET, BY COUNTRY, 2022-2032 ($MILLION)
- TABLE 40. GERMANY COFFEE POD MARKET, BY FLAVOR, 2022-2032 ($MILLION)
- TABLE 41. GERMANY COFFEE POD MARKET, BY DISTRIBUTION CHANNEL, 2022-2032 ($MILLION)
- TABLE 42. GERMANY COFFEE POD MARKET, BY CAFFEINE CONCENTRATION, 2022-2032 ($MILLION)
- TABLE 43. GERMANY COFFEE POD MARKET, BY END USE, 2022-2032 ($MILLION)
- TABLE 44. UK COFFEE POD MARKET, BY FLAVOR, 2022-2032 ($MILLION)
- TABLE 45. UK COFFEE POD MARKET, BY DISTRIBUTION CHANNEL, 2022-2032 ($MILLION)
- TABLE 46. UK COFFEE POD MARKET, BY CAFFEINE CONCENTRATION, 2022-2032 ($MILLION)
- TABLE 47. UK COFFEE POD MARKET, BY END USE, 2022-2032 ($MILLION)
- TABLE 48. SPAIN COFFEE POD MARKET, BY FLAVOR, 2022-2032 ($MILLION)
- TABLE 49. SPAIN COFFEE POD MARKET, BY DISTRIBUTION CHANNEL, 2022-2032 ($MILLION)
- TABLE 50. SPAIN COFFEE POD MARKET, BY CAFFEINE CONCENTRATION, 2022-2032 ($MILLION)
- TABLE 51. SPAIN COFFEE POD MARKET, BY END USE, 2022-2032 ($MILLION)
- TABLE 52. ITALY COFFEE POD MARKET, BY FLAVOR, 2022-2032 ($MILLION)
- TABLE 53. ITALY COFFEE POD MARKET, BY DISTRIBUTION CHANNEL, 2022-2032 ($MILLION)
- TABLE 54. ITALY COFFEE POD MARKET, BY CAFFEINE CONCENTRATION, 2022-2032 ($MILLION)
- TABLE 55. ITALY COFFEE POD MARKET, BY END USE, 2022-2032 ($MILLION)
- TABLE 56. FRANCE COFFEE POD MARKET, BY FLAVOR, 2022-2032 ($MILLION)
- TABLE 57. FRANCE COFFEE POD MARKET, BY DISTRIBUTION CHANNEL, 2022-2032 ($MILLION)
- TABLE 58. FRANCE COFFEE POD MARKET, BY CAFFEINE CONCENTRATION, 2022-2032 ($MILLION)
- TABLE 59. FRANCE COFFEE POD MARKET, BY END USE, 2022-2032 ($MILLION)
- TABLE 60. REST OF EUROPE COFFEE POD MARKET, BY FLAVOR, 2022-2032 ($MILLION)
- TABLE 61. REST OF EUROPE COFFEE POD MARKET, BY DISTRIBUTION CHANNEL, 2022-2032 ($MILLION)
- TABLE 62. REST OF EUROPE COFFEE POD MARKET, BY CAFFEINE CONCENTRATION, 2022-2032 ($MILLION)
- TABLE 63. REST OF EUROPE COFFEE POD MARKET, BY END USE, 2022-2032 ($MILLION)
- TABLE 64. ASIA-PACIFIC COFFEE POD MARKET, BY FLAVOR, 2022-2032 ($MILLION)
- TABLE 65. ASIA-PACIFIC COFFEE POD MARKET, BY DISTRIBUTION CHANNEL, 2022-2032 ($MILLION)
- TABLE 66. ASIA-PACIFIC COFFEE POD MARKET, BY CAFFEINE CONCENTRATION, 2022-2032 ($MILLION)
- TABLE 67. ASIA-PACIFIC COFFEE POD MARKET, BY END USE, 2022-2032 ($MILLION)
- TABLE 68. ASIA-PACIFIC COFFEE POD MARKET, BY COUNTRY, 2022-2032 ($MILLION)
- TABLE 69. CHINA COFFEE POD MARKET, BY FLAVOR, 2022-2032 ($MILLION)
- TABLE 70. CHINA COFFEE POD MARKET, BY DISTRIBUTION CHANNEL, 2022-2032 ($MILLION)
- TABLE 71. CHINA COFFEE POD MARKET, BY CAFFEINE CONCENTRATION, 2022-2032 ($MILLION)
- TABLE 72. CHINA COFFEE POD MARKET, BY END USE, 2022-2032 ($MILLION)
- TABLE 73. JAPAN COFFEE POD MARKET, BY FLAVOR, 2022-2032 ($MILLION)
- TABLE 74. JAPAN COFFEE POD MARKET, BY DISTRIBUTION CHANNEL, 2022-2032 ($MILLION)
- TABLE 75. JAPAN COFFEE POD MARKET, BY CAFFEINE CONCENTRATION, 2022-2032 ($MILLION)
- TABLE 76. JAPAN COFFEE POD MARKET, BY END USE, 2022-2032 ($MILLION)
- TABLE 77. INDIA COFFEE POD MARKET, BY FLAVOR, 2022-2032 ($MILLION)
- TABLE 78. INDIA COFFEE POD MARKET, BY DISTRIBUTION CHANNEL, 2022-2032 ($MILLION)
- TABLE 79. INDIA COFFEE POD MARKET, BY CAFFEINE CONCENTRATION, 2022-2032 ($MILLION)
- TABLE 80. INDIA COFFEE POD MARKET, BY END USE, 2022-2032 ($MILLION)
- TABLE 81. SOUTH KOREA COFFEE POD MARKET, BY FLAVOR, 2022-2032 ($MILLION)
- TABLE 82. SOUTH KOREA COFFEE POD MARKET, BY DISTRIBUTION CHANNEL, 2022-2032 ($MILLION)
- TABLE 83. SOUTH KOREA COFFEE POD MARKET, BY CAFFEINE CONCENTRATION, 2022-2032 ($MILLION)
- TABLE 84. SOUTH KOREA COFFEE POD MARKET, BY END USE, 2022-2032 ($MILLION)
- TABLE 85. AUSTRALIA COFFEE POD MARKET, BY FLAVOR, 2022-2032 ($MILLION)
- TABLE 86. AUSTRALIA COFFEE POD MARKET, BY DISTRIBUTION CHANNEL, 2022-2032 ($MILLION)
- TABLE 87. AUSTRALIA COFFEE POD MARKET, BY CAFFEINE CONCENTRATION, 2022-2032 ($MILLION)
- TABLE 88. AUSTRALIA COFFEE POD MARKET, BY END USE, 2022-2032 ($MILLION)
- TABLE 89. SINGAPORE COFFEE POD MARKET, BY FLAVOR, 2022-2032 ($MILLION)
- TABLE 90. SINGAPORE COFFEE POD MARKET, BY DISTRIBUTION CHANNEL, 2022-2032 ($MILLION)
- TABLE 91. SINGAPORE COFFEE POD MARKET, BY CAFFEINE CONCENTRATION, 2022-2032 ($MILLION)
- TABLE 92. SINGAPORE COFFEE POD MARKET, BY END USE, 2022-2032 ($MILLION)
- TABLE 93. NEW ZEALAND COFFEE POD MARKET, BY FLAVOR, 2022-2032 ($MILLION)
- TABLE 94. NEW ZEALAND COFFEE POD MARKET, BY DISTRIBUTION CHANNEL, 2022-2032 ($MILLION)
- TABLE 95. NEW ZEALAND COFFEE POD MARKET, BY CAFFEINE CONCENTRATION, 2022-2032 ($MILLION)
- TABLE 96. NEW ZEALAND COFFEE POD MARKET, BY END USE, 2022-2032 ($MILLION)
- TABLE 97. REST OF ASIA-PACIFIC COFFEE POD MARKET, BY FLAVOR, 2022-2032 ($MILLION)
- TABLE 98. REST OF ASIA-PACIFIC COFFEE POD MARKET, BY DISTRIBUTION CHANNEL, 2022-2032 ($MILLION)
- TABLE 99. REST OF ASIA-PACIFIC COFFEE POD MARKET, BY CAFFEINE CONCENTRATION, 2022-2032 ($MILLION)
- TABLE 100. REST OF ASIA-PACIFIC COFFEE POD MARKET, BY END USE, 2022-2032 ($MILLION)
- TABLE 101. LAMEA COFFEE POD MARKET, BY FLAVOR, 2022-2032 ($MILLION)
- TABLE 102. LAMEA COFFEE POD MARKET, BY DISTRIBUTION CHANNEL, 2022-2032 ($MILLION)
- TABLE 103. LAMEA COFFEE POD MARKET, BY CAFFEINE CONCENTRATION, 2022-2032 ($MILLION)
- TABLE 104. LAMEA COFFEE POD MARKET, BY END USE, 2022-2032 ($MILLION)
- TABLE 105. LAMEA COFFEE POD MARKET, BY COUNTRY, 2022-2032 ($MILLION)
- TABLE 106. BRAZIL COFFEE POD MARKET, BY FLAVOR, 2022-2032 ($MILLION)
- TABLE 107. BRAZIL COFFEE POD MARKET, BY DISTRIBUTION CHANNEL, 2022-2032 ($MILLION)
- TABLE 108. BRAZIL COFFEE POD MARKET, BY CAFFEINE CONCENTRATION, 2022-2032 ($MILLION)
- TABLE 109. BRAZIL COFFEE POD MARKET, BY END USE, 2022-2032 ($MILLION)
- TABLE 110. ARGENTINA COFFEE POD MARKET, BY FLAVOR, 2022-2032 ($MILLION)
- TABLE 111. ARGENTINA COFFEE POD MARKET, BY DISTRIBUTION CHANNEL, 2022-2032 ($MILLION)
- TABLE 112. ARGENTINA COFFEE POD MARKET, BY CAFFEINE CONCENTRATION, 2022-2032 ($MILLION)
- TABLE 113. ARGENTINA COFFEE POD MARKET, BY END USE, 2022-2032 ($MILLION)
- TABLE 114. SOUTH AFRICA COFFEE POD MARKET, BY FLAVOR, 2022-2032 ($MILLION)
- TABLE 115. SOUTH AFRICA COFFEE POD MARKET, BY DISTRIBUTION CHANNEL, 2022-2032 ($MILLION)
- TABLE 116. SOUTH AFRICA COFFEE POD MARKET, BY CAFFEINE CONCENTRATION, 2022-2032 ($MILLION)
- TABLE 117. SOUTH AFRICA COFFEE POD MARKET, BY END USE, 2022-2032 ($MILLION)
- TABLE 118. SAUDI ARABIA COFFEE POD MARKET, BY FLAVOR, 2022-2032 ($MILLION)
- TABLE 119. SAUDI ARABIA COFFEE POD MARKET, BY DISTRIBUTION CHANNEL, 2022-2032 ($MILLION)
- TABLE 120. SAUDI ARABIA COFFEE POD MARKET, BY CAFFEINE CONCENTRATION, 2022-2032 ($MILLION)
- TABLE 121. SAUDI ARABIA COFFEE POD MARKET, BY END USE, 2022-2032 ($MILLION)
- TABLE 122. UAE COFFEE POD MARKET, BY FLAVOR, 2022-2032 ($MILLION)
- TABLE 123. UAE COFFEE POD MARKET, BY DISTRIBUTION CHANNEL, 2022-2032 ($MILLION)
- TABLE 124. UAE COFFEE POD MARKET, BY CAFFEINE CONCENTRATION, 2022-2032 ($MILLION)
- TABLE 125. UAE COFFEE POD MARKET, BY END USE, 2022-2032 ($MILLION)
- TABLE 126. REST OF LAMEA COFFEE POD MARKET, BY FLAVOR, 2022-2032 ($MILLION)
- TABLE 127. REST OF LAMEA COFFEE POD MARKET, BY DISTRIBUTION CHANNEL, 2022-2032 ($MILLION)
- TABLE 128. REST OF LAMEA COFFEE POD MARKET, BY CAFFEINE CONCENTRATION, 2022-2032 ($MILLION)
- TABLE 129. REST OF LAMEA COFFEE POD MARKET, BY END USE, 2022-2032 ($MILLION)
- TABLE 130. ILLYCAFFE S.P.A.: KEY EXECUTIVES
- TABLE 131. ILLYCAFFE S.P.A.: COMPANY SNAPSHOT
- TABLE 132. ILLYCAFFE S.P.A.: PRODUCT SEGMENTS
- TABLE 133. ILLYCAFFE S.P.A.: PRODUCT PORTFOLIO
- TABLE 134. LAVAZZA GROUP: KEY EXECUTIVES
- TABLE 135. LAVAZZA GROUP: COMPANY SNAPSHOT
- TABLE 136. LAVAZZA GROUP: PRODUCT SEGMENTS
- TABLE 137. LAVAZZA GROUP: PRODUCT PORTFOLIO
- TABLE 138. LAVAZZA GROUP: KEY STRATERGIES
- TABLE 139. CAFFE BORBONE S.R.L.: KEY EXECUTIVES
- TABLE 140. CAFFE BORBONE S.R.L.: COMPANY SNAPSHOT
- TABLE 141. CAFFE BORBONE S.R.L.: PRODUCT SEGMENTS
- TABLE 142. CAFFE BORBONE S.R.L.: PRODUCT PORTFOLIO
- TABLE 143. CAFFE BORBONE S.R.L.: KEY STRATERGIES
- TABLE 144. LABCAFFE S.R.L.: KEY EXECUTIVES
- TABLE 145. LABCAFFE S.R.L.: COMPANY SNAPSHOT
- TABLE 146. LABCAFFE S.R.L.: PRODUCT PORTFOLIO
- TABLE 147. PROCAFFE S.P.A.: KEY EXECUTIVES
- TABLE 148. PROCAFFE S.P.A.: COMPANY SNAPSHOT
- TABLE 149. PROCAFFE S.P.A.: PRODUCT PORTFOLIO
- TABLE 150. SEGAFREDO ZANETTI S.P.A.: KEY EXECUTIVES
- TABLE 151. SEGAFREDO ZANETTI S.P.A.: COMPANY SNAPSHOT
- TABLE 152. SEGAFREDO ZANETTI S.P.A.: PRODUCT SEGMENTS
- TABLE 153. SEGAFREDO ZANETTI S.P.A.: PRODUCT PORTFOLIO
- TABLE 154. SEGAFREDO ZANETTI S.P.A.: KEY STRATERGIES
- TABLE 155. KIMBO S.P.A.: KEY EXECUTIVES
- TABLE 156. KIMBO S.P.A.: COMPANY SNAPSHOT
- TABLE 157. KIMBO S.P.A.: PRODUCT PORTFOLIO
- TABLE 158. GRUPPO IZZO S.R.L.: KEY EXECUTIVES
- TABLE 159. GRUPPO IZZO S.R.L.: COMPANY SNAPSHOT
- TABLE 160. GRUPPO IZZO S.R.L.: PRODUCT SEGMENTS
- TABLE 161. GRUPPO IZZO S.R.L.: PRODUCT PORTFOLIO
- TABLE 162. GRUPPO GIMOKA S.P.A.: KEY EXECUTIVES
- TABLE 163. GRUPPO GIMOKA S.P.A.: COMPANY SNAPSHOT
- TABLE 164. GRUPPO GIMOKA S.P.A.: PRODUCT SEGMENTS
- TABLE 165. GRUPPO GIMOKA S.P.A.: SERVICE SEGMENTS
- TABLE 166. GRUPPO GIMOKA S.P.A.: PRODUCT PORTFOLIO
- TABLE 167. GRUPPO GIMOKA S.P.A.: KEY STRATERGIES
- TABLE 168. BLASERCAFE AG: KEY EXECUTIVES
- TABLE 169. BLASERCAFE AG: COMPANY SNAPSHOT
- TABLE 170. BLASERCAFE AG: PRODUCT PORTFOLIO
LIST OF FIGURES
- FIGURE 01. COFFEE POD MARKET, 2022-2032
- FIGURE 02. SEGMENTATION OF COFFEE POD MARKET,2022-2032
- FIGURE 03. TOP IMPACTING FACTORS IN COFFEE POD MARKET (2022 TO 2032)
- FIGURE 04. TOP INVESTMENT POCKETS IN COFFEE POD MARKET (2023-2032)
- FIGURE 05. LOW BARGAINING POWER OF SUPPLIERS
- FIGURE 06. MODERATE THREAT OF NEW ENTRANTS
- FIGURE 07. MODERATE THREAT OF SUBSTITUTES
- FIGURE 08. MODERATE INTENSITY OF RIVALRY
- FIGURE 09. MODERATE BARGAINING POWER OF BUYERS
- FIGURE 10. GLOBAL COFFEE POD MARKET:DRIVERS, RESTRAINTS AND OPPORTUNITIES
- FIGURE 11. COFFEE POD MARKET, BY FLAVOR, 2022 AND 2032(%)
- FIGURE 12. COMPARATIVE SHARE ANALYSIS OF COFFEE POD MARKET FOR CARAMEL, BY COUNTRY 2022 AND 2032(%)
- FIGURE 13. COMPARATIVE SHARE ANALYSIS OF COFFEE POD MARKET FOR CHOCOLATE, BY COUNTRY 2022 AND 2032(%)
- FIGURE 14. COMPARATIVE SHARE ANALYSIS OF COFFEE POD MARKET FOR HAZELNUT, BY COUNTRY 2022 AND 2032(%)
- FIGURE 15. COMPARATIVE SHARE ANALYSIS OF COFFEE POD MARKET FOR OTHERS, BY COUNTRY 2022 AND 2032(%)
- FIGURE 16. COFFEE POD MARKET, BY DISTRIBUTION CHANNEL, 2022 AND 2032(%)
- FIGURE 17. COMPARATIVE SHARE ANALYSIS OF COFFEE POD MARKET FOR HYPERMARKETS/SUPERMARKETS, BY COUNTRY 2022 AND 2032(%)
- FIGURE 18. COMPARATIVE SHARE ANALYSIS OF COFFEE POD MARKET FOR SPECIALTY STORES, BY COUNTRY 2022 AND 2032(%)
- FIGURE 19. COMPARATIVE SHARE ANALYSIS OF COFFEE POD MARKET FOR ONLINE CHANNEL, BY COUNTRY 2022 AND 2032(%)
- FIGURE 20. COMPARATIVE SHARE ANALYSIS OF COFFEE POD MARKET FOR OTHERS, BY COUNTRY 2022 AND 2032(%)
- FIGURE 21. COFFEE POD MARKET, BY CAFFEINE CONCENTRATION, 2022 AND 2032(%)
- FIGURE 22. COMPARATIVE SHARE ANALYSIS OF COFFEE POD MARKET FOR CAFFEINATED, BY COUNTRY 2022 AND 2032(%)
- FIGURE 23. COMPARATIVE SHARE ANALYSIS OF COFFEE POD MARKET FOR DECAFFEINATED, BY COUNTRY 2022 AND 2032(%)
- FIGURE 24. COFFEE POD MARKET, BY END USE, 2022 AND 2032(%)
- FIGURE 25. COMPARATIVE SHARE ANALYSIS OF COFFEE POD MARKET FOR COMMERCIAL, BY COUNTRY 2022 AND 2032(%)
- FIGURE 26. COMPARATIVE SHARE ANALYSIS OF COFFEE POD MARKET FOR RESIDENTIAL, BY COUNTRY 2022 AND 2032(%)
- FIGURE 27. COFFEE POD MARKET BY REGION, 2022 AND 2032(%)
- FIGURE 28. U.S. COFFEE POD MARKET, 2022-2032 ($MILLION)
- FIGURE 29. CANADA COFFEE POD MARKET, 2022-2032 ($MILLION)
- FIGURE 30. MEXICO COFFEE POD MARKET, 2022-2032 ($MILLION)
- FIGURE 31. GERMANY COFFEE POD MARKET, 2022-2032 ($MILLION)
- FIGURE 32. UK COFFEE POD MARKET, 2022-2032 ($MILLION)
- FIGURE 33. SPAIN COFFEE POD MARKET, 2022-2032 ($MILLION)
- FIGURE 34. ITALY COFFEE POD MARKET, 2022-2032 ($MILLION)
- FIGURE 35. FRANCE COFFEE POD MARKET, 2022-2032 ($MILLION)
- FIGURE 36. REST OF EUROPE COFFEE POD MARKET, 2022-2032 ($MILLION)
- FIGURE 37. CHINA COFFEE POD MARKET, 2022-2032 ($MILLION)
- FIGURE 38. JAPAN COFFEE POD MARKET, 2022-2032 ($MILLION)
- FIGURE 39. INDIA COFFEE POD MARKET, 2022-2032 ($MILLION)
- FIGURE 40. SOUTH KOREA COFFEE POD MARKET, 2022-2032 ($MILLION)
- FIGURE 41. AUSTRALIA COFFEE POD MARKET, 2022-2032 ($MILLION)
- FIGURE 42. SINGAPORE COFFEE POD MARKET, 2022-2032 ($MILLION)
- FIGURE 43. NEW ZEALAND COFFEE POD MARKET, 2022-2032 ($MILLION)
- FIGURE 44. REST OF ASIA-PACIFIC COFFEE POD MARKET, 2022-2032 ($MILLION)
- FIGURE 45. BRAZIL COFFEE POD MARKET, 2022-2032 ($MILLION)
- FIGURE 46. ARGENTINA COFFEE POD MARKET, 2022-2032 ($MILLION)
- FIGURE 47. SOUTH AFRICA COFFEE POD MARKET, 2022-2032 ($MILLION)
- FIGURE 48. SAUDI ARABIA COFFEE POD MARKET, 2022-2032 ($MILLION)
- FIGURE 49. UAE COFFEE POD MARKET, 2022-2032 ($MILLION)
- FIGURE 50. REST OF LAMEA COFFEE POD MARKET, 2022-2032 ($MILLION)
- FIGURE 51. TOP WINNING STRATEGIES, BY YEAR (2020-2023)
- FIGURE 52. TOP WINNING STRATEGIES, BY DEVELOPMENT (2020-2023)
- FIGURE 53. TOP WINNING STRATEGIES, BY COMPANY (2020-2023)
- FIGURE 54. PRODUCT MAPPING OF TOP 10 PLAYERS
- FIGURE 55. COMPETITIVE DASHBOARD
- FIGURE 56. COMPETITIVE HEATMAP: COFFEE POD MARKET
- FIGURE 57. TOP PLAYER POSITIONING, 2022
- FIGURE 58. ILLYCAFFE S.P.A.: NET SALES, 2022-2022 ($MILLION)
- FIGURE 59. LAVAZZA GROUP: NET REVENUE, 2020-2022 ($MILLION)
- FIGURE 60. LAVAZZA GROUP: RESEARCH & DEVELOPMENT EXPENDITURE, 2020-2022 ($MILLION)
- FIGURE 61. LAVAZZA GROUP: REVENUE SHARE BY REGION, 2021 (%)
- FIGURE 62. CAFFE BORBONE S.R.L.: NET SALES, 2020-2022 ($MILLION)


