


 |
市场调查报告书
商品编码
1415006
内容行销市场:按通路类型、最终用途:2023-2032 年全球机会分析与产业预测Content marketing Market By Channel Type (Social Media, Blogs, Video Platforms, Others), By End Use (Brand Awareness, Lead Generation, Others): Global Opportunity Analysis and Industry Forecast, 2023-2032 |
||||||
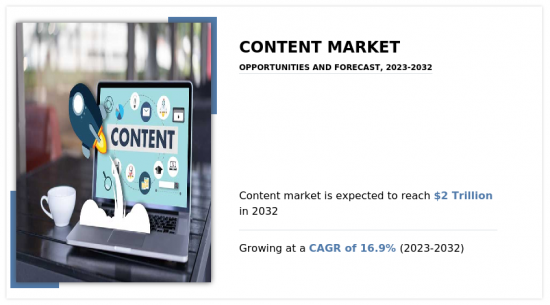
2022年内容行销市场规模预估为4,132亿美元,预估2032年将达19,564亿美元,2023年至2032年复合年增长率为16.9%。
内容行销产业是一个动态且不断发展的形势,当今企业可以使用多种内容格式和平台。部落格是内容行销的基本组成部分,是推广产品、讨论行业趋势和展示专业知识的宝贵资源。部落格通常会补充自订图像和影片以提高参与度。
在当今的数位时代,社群媒体已成为连接世界各地人们的全球平台。它是个人与朋友和熟人联繫、交流和共用经验的中心。然而,社群媒体的发展不仅改变了个人互动,也彻底改变了商业世界。社群媒体已发展成为行销策略领域最重要的工具之一,尤其是品牌健康和市场开拓。
社群媒体内容行销(SMCM)是透过社群媒体平台进行有效品牌传播的基石。 SMCM 可作为向消费者传递有影响力的讯息、吸引他们的注意力并鼓励与您的品牌持续互动的管道。另一方面,品牌健康度是对品牌在数位受众中的认知度和股权的长期评估。 SMCM 在品牌健康中的作用至关重要,因为它是消费者收集品牌和产品资讯的媒介。有效的 SMCM 会影响消费者的认知,并对品牌健康产生直接影响。执行良好的 SMCM 策略可以透过提高知名度、建立信誉和强化品牌股权来提高您的品牌健康得分。因此,企业必须擅长内容行销来吸引和留住客户。内容行销产业正处于数位转型的十字路口,而 SMCM 在塑造品牌健康和现代市场成功方面发挥关键作用。
缺乏有效分发内容以产生潜在客户、提高品牌知名度和增加业务收入的知识和专业收益预计将限制未来几年内容行销市场的收益成长,这是一些主要因素。
影片平台的日益普及创造了绝佳的市场机会。影片平台越来越多地使用演算法和用户资料来个人化内容推荐。这有助于保持受众的参与度,并鼓励他们在平台上花费更多时间。透过挑战、竞赛、用户评价等方式鼓励用户生成内容(UGC)可以成为影片行销的强大推动力。 UGC 为品牌宣传活动增添了真实性和参与度。有多种内容格式,包括:我们透过教学影片、教学、访谈、网路研讨会、说故事等来满足不同受众的偏好和需求。透过内容多样化,您可以保持受众的参与度并了解情况。
此外,透过与社群媒体影响者和内容创作者合作,品牌可以接触到更广泛、更活跃的受众。影响者行销已成为影片内容推广的关键驱动力。进阶分析工具提供有关影片表现、观看者行为和参与度指标的宝贵资料。这种资料主导的方法允许内容创建者重新制定策略并优化其内容。扩增实境和虚拟实境 (AR/VR) 等新技术正在融入影片内容行销,以创造身临其境型的体验。这些技术在游戏、旅游和房地产等行业尤其有效。
COVID-19 的疫情对内容行销产业产生了积极影响,全球业务变得更加数位化,购物和娱乐等线上平台变得更加流行。后疫情时代内容行销产业的特征将是持续关注数位管道、更加重视真实性和同理心,以及更依赖资料主导的个人化。大流行加速了这些趋势,这对于内容行销的发展至关重要。
目录
第一章简介
第 2 章执行摘要
第三章市场概况
- 市场定义和范围
- 主要发现
- 影响因素
- 主要投资机会
- 波特五力分析
- 市场动态
- 促进因素
- 抑制因素
- 机会
- 市场占有率分析
- 价值链分析
- 关键监管分析
- 专利形势
第四章内容行销市场:按通路类型
- 概述
- 社群媒体
- 部落格
- 影片平台
- 其他的
第五章内容行销市场:依最终用途
- 概述
- 品牌认知度
- 领先一代
- 其他的
第六章内容行销市场:按地区
- 概述
- 北美洲
- 美国
- 加拿大
- 墨西哥
- 欧洲
- 德国
- 英国
- 法国
- 西班牙
- 义大利
- 其他的
- 亚太地区
- 中国
- 日本
- 印度
- 韩国
- 澳洲
- 其他的
- 拉丁美洲/中东/非洲
- 巴西
- 沙乌地阿拉伯
- UAE
- 南非
- 其他的
第七章 竞争形势
- 介绍
- 关键成功策略
- 10家主要企业产品图谱
- 竞争对手仪表板
- 竞争热图
- 主要企业定位(2022年)
第八章 公司简介
- JACK IN THE BOX WORLDWIDE
- MEDIA.MONKS
- WATCONSULT
- bc web wise
- lowe lintas
- WAVEMAKER GLOBAL
- DENTSU WEBCHUTNEY
- Ogilvy
- Mindshare Media Ltd
- Social Beat Digital Marketing LLP
- TAG
- schbang
- ZOO MEDIA
- the glitch
According to a new report published by Allied Market Research, titled, "Content marketing Market," The content marketing market was valued at $413.20 billion in 2022, and is estimated to reach $1956.4 billion by 2032, growing at a CAGR of 16.9% from 2023 to 2032. The content marketing industry is a dynamic and ever-evolving landscape driven by the diverse range of content formats and platforms available to businesses today. One of the fundamental components of content marketing is blogs which serve as a valuable resource for promoting products, discussing industry trends, and showcasing expertise. Blogs are often complemented with custom images and videos to enhance engagement.
In today's digital age, social media has emerged as a global platform that connects people from all corners of the world. It serves as a hub for individuals to connect, communicate, and share experiences with friends and acquaintances. However, the evolution of social media has not only transformed personal interactions but has also revolutionized the business world. Social media has evolved into one of the most indispensable tools in the realm of marketing strategy particularly in the context of brand health and development.
Social Media Content Marketing (SMCM) is the cornerstone of effective brand communication through social media platforms. It serves as the conduit for delivering impactful information to consumers captivating their attention and encouraging continued engagement with brands. Brand health, on the other hand, represents the long-term evaluation of a brand's awareness and equity among digital audiences. The role of SMCM in brand health is indispensable as it acts as the medium through which consumers gather information about brands and products. Effective SMCM has a direct impact on brand health, influencing the perception of consumers. A well-executed SMCM strategy can elevate a brand's health score by increasing awareness, building credibility, and enhancing brand equity. Therefore, it is imperative for businesses to excel in content marketing to attract and retain customers enticing them to visit their pages, stay updated with the latest news, and ultimately become repeat purchasers. The content marketing industry finds itself at the intersection of this digital transformation, with SMCM playing a pivotal role in shaping brand health and success in the contemporary market.
Lack of knowledge and expertise in effectively delivery the content to generate leads, create brand awareness, and increase the business revenue are few of the major factors estimated to restrain the content marketing market revenue growth in the upcoming years.
The growing popularity of video platforms to generate excellent opportunities in the market. Video platforms are increasingly using algorithms and user data to personalize content recommendations. This helps keep viewers engaged and encourages them to spend more time on the platform. Encouraging user-generated content (UGC) through challenges, contests, or user testimonials can be a powerful driver for video marketing. UGC adds authenticity and engagement to brand campaigns. A variety of content formats, such as explainer videos, tutorials, interviews, webinars, and storytelling, cater to different audience preferences and needs. Diversifying content keeps viewers engaged and informed.
Furthermore, partnering with social media influencers and content creators can help brands reach a broader and more engaged audience. Influencer marketing has become a significant driver of video content promotion. Advanced analytics tools provide valuable data on video performance, viewer behavior, and engagement metrics. This data-driven approach allows content creators to refine their strategies and optimize their content. Emerging technologies like Augmented Reality and Virtual Reality (AR/VR) are being integrated into video content marketing to create immersive experiences. These technologies can be particularly effective for industries like gaming, tourism, and real estate.
The COVID-19 pandemic led to positive impact on the content marketing industry owing to increase in digitization in the business globally and growing popularity of online platforms for shopping, entertainment, and others. The post-COVID content marketing industry is characterized by a continued emphasis on digital channels, an increased focus on authenticity and empathy, and an increasing reliance on data-driven personalization. While the pandemic accelerated these trends, they are now integral to the evolving landscape of content marketing.
The key players profiled in this report include: Jack In The Box, Media.Monks, Watconsult, BC Web Wise, Lowe Lintas, Wavemaker Global, Dentsu Webchutney, Ogilvy, Mindshare, and Social Beat. The market players are continuously striving to achieve a dominant position in this competitive market using strategies such as collaborations and acquisitions.
Key Benefits For Stakeholders
- This report provides a quantitative analysis of the market segments, current trends, estimations, and dynamics of the content marketing market analysis from 2022 to 2032 to identify the prevailing content marketing market opportunities.
- The market research is offered along with information related to key drivers, restraints, and opportunities.
- Porter's five forces analysis highlights the potency of buyers and suppliers to enable stakeholders make profit-oriented business decisions and strengthen their supplier-buyer network.
- In-depth analysis of the content marketing market segmentation assists to determine the prevailing market opportunities.
- Major countries in each region are mapped according to their revenue contribution to the global market.
- Market player positioning facilitates benchmarking and provides a clear understanding of the present position of the market players.
- The report includes the analysis of the regional as well as global content marketing market trends, key players, market segments, application areas, and market growth strategies.
Additional benefits you will get with this purchase are:
- Quarterly Update and* (only available with a corporate license, on listed price)
- 5 additional Company Profile of client Choice pre- or Post-purchase, as a free update.
- Free Upcoming Version on the Purchase of Five and Enterprise User License.
- 16 analyst hours of support* (post-purchase, if you find additional data requirements upon review of the report, you may receive support amounting to 16 analyst hours to solve questions, and post-sale queries)
- 15% Free Customization* (in case the scope or segment of the report does not match your requirements, 15% is equivalent to 3 working days of free work, applicable once)
- Free data Pack on the Five and Enterprise User License. (Excel version of the report)
- Free Updated report if the report is 6-12 months old or older.
- 24-hour priority response*
- Free Industry updates and white papers.
Possible Customization with this report (with additional cost and timeline, please talk to the sales executive to know more)
- Consumer Buying Behavior Analysis
- End user preferences and pain points
- Investment Opportunities
- Upcoming/New Entrant by Regions
- Technology Trend Analysis
- Go To Market Strategy
- Market share analysis of players by products/segments
- Pain Point Analysis
- Regulatory Guidelines
- Strategic Recommedations
- Additional company profiles with specific to client's interest
- Additional country or region analysis- market size and forecast
- Criss-cross segment analysis- market size and forecast
- Expanded list for Company Profiles
- Historic market data
- Market share analysis of players at global/region/country level
- SWOT Analysis
Key Market Segments
By Channel Type
- Social Media
- Blogs
- Video Platforms
- Others
By End Use
- Brand Awareness
- Lead Generation
- Others
By Region
- North America
- U.S.
- Canada
- Mexico
- Europe
- Germany
- UK
- France
- Spain
- Italy
- Rest of Europe
- Asia-Pacific
- China
- Japan
- India
- South Korea
- Australia
- Rest of Asia-Pacific
- LAMEA
- Brazil
- Saudi Arabia
- UAE
- South Africa
- Rest of LAMEA
Key Market Players:
- JACK IN THE BOX WORLDWIDE
- MEDIA.MONKS
- WATCONSULT
- bc web wise
- lowe lintas
- WAVEMAKER GLOBAL
- DENTSU WEBCHUTNEY
- Ogilvy
- Mindshare Media Ltd
- Social Beat Digital Marketing LLP
- TAG
- schbang
- ZOO MEDIA
- the glitch
TABLE OF CONTENTS
CHAPTER 1: INTRODUCTION
- 1.1. Report description
- 1.2. Key market segments
- 1.3. Key benefits to the stakeholders
- 1.4. Research methodology
- 1.4.1. Primary research
- 1.4.2. Secondary research
- 1.4.3. Analyst tools and models
CHAPTER 2: EXECUTIVE SUMMARY
- 2.1. CXO Perspective
CHAPTER 3: MARKET OVERVIEW
- 3.1. Market definition and scope
- 3.2. Key findings
- 3.2.1. Top impacting factors
- 3.2.2. Top investment pockets
- 3.3. Porter's five forces analysis
- 3.4. Market dynamics
- 3.4.1. Drivers
- 3.4.2. Restraints
- 3.4.3. Opportunities
- 3.5. Market Share Analysis
- 3.6. Value Chain Analysis
- 3.7. Key Regulation Analysis
- 3.8. Patent Landscape
CHAPTER 4: CONTENT MARKETING MARKET, BY CHANNEL TYPE
- 4.1. Overview
- 4.1.1. Market size and forecast
- 4.2. Social Media
- 4.2.1. Key market trends, growth factors and opportunities
- 4.2.2. Market size and forecast, by region
- 4.2.3. Market share analysis by country
- 4.3. Blogs
- 4.3.1. Key market trends, growth factors and opportunities
- 4.3.2. Market size and forecast, by region
- 4.3.3. Market share analysis by country
- 4.4. Video Platforms
- 4.4.1. Key market trends, growth factors and opportunities
- 4.4.2. Market size and forecast, by region
- 4.4.3. Market share analysis by country
- 4.5. Others
- 4.5.1. Key market trends, growth factors and opportunities
- 4.5.2. Market size and forecast, by region
- 4.5.3. Market share analysis by country
CHAPTER 5: CONTENT MARKETING MARKET, BY END USE
- 5.1. Overview
- 5.1.1. Market size and forecast
- 5.2. Brand Awareness
- 5.2.1. Key market trends, growth factors and opportunities
- 5.2.2. Market size and forecast, by region
- 5.2.3. Market share analysis by country
- 5.3. Lead Generation
- 5.3.1. Key market trends, growth factors and opportunities
- 5.3.2. Market size and forecast, by region
- 5.3.3. Market share analysis by country
- 5.4. Others
- 5.4.1. Key market trends, growth factors and opportunities
- 5.4.2. Market size and forecast, by region
- 5.4.3. Market share analysis by country
CHAPTER 6: CONTENT MARKETING MARKET, BY REGION
- 6.1. Overview
- 6.1.1. Market size and forecast By Region
- 6.2. North America
- 6.2.1. Key market trends, growth factors and opportunities
- 6.2.2. Market size and forecast, by Channel Type
- 6.2.3. Market size and forecast, by End Use
- 6.2.4. Market size and forecast, by country
- 6.2.4.1. U.S.
- 6.2.4.1.1. Market size and forecast, by Channel Type
- 6.2.4.1.2. Market size and forecast, by End Use
- 6.2.4.2. Canada
- 6.2.4.2.1. Market size and forecast, by Channel Type
- 6.2.4.2.2. Market size and forecast, by End Use
- 6.2.4.3. Mexico
- 6.2.4.3.1. Market size and forecast, by Channel Type
- 6.2.4.3.2. Market size and forecast, by End Use
- 6.3. Europe
- 6.3.1. Key market trends, growth factors and opportunities
- 6.3.2. Market size and forecast, by Channel Type
- 6.3.3. Market size and forecast, by End Use
- 6.3.4. Market size and forecast, by country
- 6.3.4.1. Germany
- 6.3.4.1.1. Market size and forecast, by Channel Type
- 6.3.4.1.2. Market size and forecast, by End Use
- 6.3.4.2. UK
- 6.3.4.2.1. Market size and forecast, by Channel Type
- 6.3.4.2.2. Market size and forecast, by End Use
- 6.3.4.3. France
- 6.3.4.3.1. Market size and forecast, by Channel Type
- 6.3.4.3.2. Market size and forecast, by End Use
- 6.3.4.4. Spain
- 6.3.4.4.1. Market size and forecast, by Channel Type
- 6.3.4.4.2. Market size and forecast, by End Use
- 6.3.4.5. Italy
- 6.3.4.5.1. Market size and forecast, by Channel Type
- 6.3.4.5.2. Market size and forecast, by End Use
- 6.3.4.6. Rest of Europe
- 6.3.4.6.1. Market size and forecast, by Channel Type
- 6.3.4.6.2. Market size and forecast, by End Use
- 6.4. Asia-Pacific
- 6.4.1. Key market trends, growth factors and opportunities
- 6.4.2. Market size and forecast, by Channel Type
- 6.4.3. Market size and forecast, by End Use
- 6.4.4. Market size and forecast, by country
- 6.4.4.1. China
- 6.4.4.1.1. Market size and forecast, by Channel Type
- 6.4.4.1.2. Market size and forecast, by End Use
- 6.4.4.2. Japan
- 6.4.4.2.1. Market size and forecast, by Channel Type
- 6.4.4.2.2. Market size and forecast, by End Use
- 6.4.4.3. India
- 6.4.4.3.1. Market size and forecast, by Channel Type
- 6.4.4.3.2. Market size and forecast, by End Use
- 6.4.4.4. South Korea
- 6.4.4.4.1. Market size and forecast, by Channel Type
- 6.4.4.4.2. Market size and forecast, by End Use
- 6.4.4.5. Australia
- 6.4.4.5.1. Market size and forecast, by Channel Type
- 6.4.4.5.2. Market size and forecast, by End Use
- 6.4.4.6. Rest of Asia-Pacific
- 6.4.4.6.1. Market size and forecast, by Channel Type
- 6.4.4.6.2. Market size and forecast, by End Use
- 6.5. LAMEA
- 6.5.1. Key market trends, growth factors and opportunities
- 6.5.2. Market size and forecast, by Channel Type
- 6.5.3. Market size and forecast, by End Use
- 6.5.4. Market size and forecast, by country
- 6.5.4.1. Brazil
- 6.5.4.1.1. Market size and forecast, by Channel Type
- 6.5.4.1.2. Market size and forecast, by End Use
- 6.5.4.2. Saudi Arabia
- 6.5.4.2.1. Market size and forecast, by Channel Type
- 6.5.4.2.2. Market size and forecast, by End Use
- 6.5.4.3. UAE
- 6.5.4.3.1. Market size and forecast, by Channel Type
- 6.5.4.3.2. Market size and forecast, by End Use
- 6.5.4.4. South Africa
- 6.5.4.4.1. Market size and forecast, by Channel Type
- 6.5.4.4.2. Market size and forecast, by End Use
- 6.5.4.5. Rest of LAMEA
- 6.5.4.5.1. Market size and forecast, by Channel Type
- 6.5.4.5.2. Market size and forecast, by End Use
CHAPTER 7: COMPETITIVE LANDSCAPE
- 7.1. Introduction
- 7.2. Top winning strategies
- 7.3. Product mapping of top 10 player
- 7.4. Competitive dashboard
- 7.5. Competitive heatmap
- 7.6. Top player positioning, 2022
CHAPTER 8: COMPANY PROFILES
- 8.1. JACK IN THE BOX WORLDWIDE
- 8.1.1. Company overview
- 8.1.2. Key executives
- 8.1.3. Company snapshot
- 8.2. MEDIA.MONKS
- 8.2.1. Company overview
- 8.2.2. Key executives
- 8.2.3. Company snapshot
- 8.3. WATCONSULT
- 8.3.1. Company overview
- 8.3.2. Key executives
- 8.3.3. Company snapshot
- 8.4. bc web wise
- 8.4.1. Company overview
- 8.4.2. Key executives
- 8.4.3. Company snapshot
- 8.5. lowe lintas
- 8.5.1. Company overview
- 8.5.2. Key executives
- 8.5.3. Company snapshot
- 8.6. WAVEMAKER GLOBAL
- 8.6.1. Company overview
- 8.6.2. Key executives
- 8.6.3. Company snapshot
- 8.7. DENTSU WEBCHUTNEY
- 8.7.1. Company overview
- 8.7.2. Key executives
- 8.7.3. Company snapshot
- 8.8. Ogilvy
- 8.8.1. Company overview
- 8.8.2. Key executives
- 8.8.3. Company snapshot
- 8.9. Mindshare Media Ltd
- 8.9.1. Company overview
- 8.9.2. Key executives
- 8.9.3. Company snapshot
- 8.10. Social Beat Digital Marketing LLP
- 8.10.1. Company overview
- 8.10.2. Key executives
- 8.10.3. Company snapshot
- 8.11. TAG
- 8.11.1. Company overview
- 8.11.2. Key executives
- 8.11.3. Company snapshot
- 8.12. schbang
- 8.12.1. Company overview
- 8.12.2. Key executives
- 8.12.3. Company snapshot
- 8.13. ZOO MEDIA
- 8.13.1. Company overview
- 8.13.2. Key executives
- 8.13.3. Company snapshot
- 8.14. the glitch
- 8.14.1. Company overview
- 8.14.2. Key executives
- 8.14.3. Company snapshot
LIST OF TABLES
- TABLE 01. GLOBAL CONTENT MARKETING MARKET, BY CHANNEL TYPE, 2022-2032 ($BILLION)
- TABLE 02. CONTENT MARKETING MARKET FOR SOCIAL MEDIA, BY REGION, 2022-2032 ($BILLION)
- TABLE 03. CONTENT MARKETING MARKET FOR BLOGS, BY REGION, 2022-2032 ($BILLION)
- TABLE 04. CONTENT MARKETING MARKET FOR VIDEO PLATFORMS, BY REGION, 2022-2032 ($BILLION)
- TABLE 05. CONTENT MARKETING MARKET FOR OTHERS, BY REGION, 2022-2032 ($BILLION)
- TABLE 06. GLOBAL CONTENT MARKETING MARKET, BY END USE, 2022-2032 ($BILLION)
- TABLE 07. CONTENT MARKETING MARKET FOR BRAND AWARENESS, BY REGION, 2022-2032 ($BILLION)
- TABLE 08. CONTENT MARKETING MARKET FOR LEAD GENERATION, BY REGION, 2022-2032 ($BILLION)
- TABLE 09. CONTENT MARKETING MARKET FOR OTHERS, BY REGION, 2022-2032 ($BILLION)
- TABLE 10. CONTENT MARKETING MARKET, BY REGION, 2022-2032 ($BILLION)
- TABLE 11. NORTH AMERICA CONTENT MARKETING MARKET, BY CHANNEL TYPE, 2022-2032 ($BILLION)
- TABLE 12. NORTH AMERICA CONTENT MARKETING MARKET, BY END USE, 2022-2032 ($BILLION)
- TABLE 13. NORTH AMERICA CONTENT MARKETING MARKET, BY COUNTRY, 2022-2032 ($BILLION)
- TABLE 14. U.S. CONTENT MARKETING MARKET, BY CHANNEL TYPE, 2022-2032 ($BILLION)
- TABLE 15. U.S. CONTENT MARKETING MARKET, BY END USE, 2022-2032 ($BILLION)
- TABLE 16. CANADA CONTENT MARKETING MARKET, BY CHANNEL TYPE, 2022-2032 ($BILLION)
- TABLE 17. CANADA CONTENT MARKETING MARKET, BY END USE, 2022-2032 ($BILLION)
- TABLE 18. MEXICO CONTENT MARKETING MARKET, BY CHANNEL TYPE, 2022-2032 ($BILLION)
- TABLE 19. MEXICO CONTENT MARKETING MARKET, BY END USE, 2022-2032 ($BILLION)
- TABLE 20. EUROPE CONTENT MARKETING MARKET, BY CHANNEL TYPE, 2022-2032 ($BILLION)
- TABLE 21. EUROPE CONTENT MARKETING MARKET, BY END USE, 2022-2032 ($BILLION)
- TABLE 22. EUROPE CONTENT MARKETING MARKET, BY COUNTRY, 2022-2032 ($BILLION)
- TABLE 23. GERMANY CONTENT MARKETING MARKET, BY CHANNEL TYPE, 2022-2032 ($BILLION)
- TABLE 24. GERMANY CONTENT MARKETING MARKET, BY END USE, 2022-2032 ($BILLION)
- TABLE 25. UK CONTENT MARKETING MARKET, BY CHANNEL TYPE, 2022-2032 ($BILLION)
- TABLE 26. UK CONTENT MARKETING MARKET, BY END USE, 2022-2032 ($BILLION)
- TABLE 27. FRANCE CONTENT MARKETING MARKET, BY CHANNEL TYPE, 2022-2032 ($BILLION)
- TABLE 28. FRANCE CONTENT MARKETING MARKET, BY END USE, 2022-2032 ($BILLION)
- TABLE 29. SPAIN CONTENT MARKETING MARKET, BY CHANNEL TYPE, 2022-2032 ($BILLION)
- TABLE 30. SPAIN CONTENT MARKETING MARKET, BY END USE, 2022-2032 ($BILLION)
- TABLE 31. ITALY CONTENT MARKETING MARKET, BY CHANNEL TYPE, 2022-2032 ($BILLION)
- TABLE 32. ITALY CONTENT MARKETING MARKET, BY END USE, 2022-2032 ($BILLION)
- TABLE 33. REST OF EUROPE CONTENT MARKETING MARKET, BY CHANNEL TYPE, 2022-2032 ($BILLION)
- TABLE 34. REST OF EUROPE CONTENT MARKETING MARKET, BY END USE, 2022-2032 ($BILLION)
- TABLE 35. ASIA-PACIFIC CONTENT MARKETING MARKET, BY CHANNEL TYPE, 2022-2032 ($BILLION)
- TABLE 36. ASIA-PACIFIC CONTENT MARKETING MARKET, BY END USE, 2022-2032 ($BILLION)
- TABLE 37. ASIA-PACIFIC CONTENT MARKETING MARKET, BY COUNTRY, 2022-2032 ($BILLION)
- TABLE 38. CHINA CONTENT MARKETING MARKET, BY CHANNEL TYPE, 2022-2032 ($BILLION)
- TABLE 39. CHINA CONTENT MARKETING MARKET, BY END USE, 2022-2032 ($BILLION)
- TABLE 40. JAPAN CONTENT MARKETING MARKET, BY CHANNEL TYPE, 2022-2032 ($BILLION)
- TABLE 41. JAPAN CONTENT MARKETING MARKET, BY END USE, 2022-2032 ($BILLION)
- TABLE 42. INDIA CONTENT MARKETING MARKET, BY CHANNEL TYPE, 2022-2032 ($BILLION)
- TABLE 43. INDIA CONTENT MARKETING MARKET, BY END USE, 2022-2032 ($BILLION)
- TABLE 44. SOUTH KOREA CONTENT MARKETING MARKET, BY CHANNEL TYPE, 2022-2032 ($BILLION)
- TABLE 45. SOUTH KOREA CONTENT MARKETING MARKET, BY END USE, 2022-2032 ($BILLION)
- TABLE 46. AUSTRALIA CONTENT MARKETING MARKET, BY CHANNEL TYPE, 2022-2032 ($BILLION)
- TABLE 47. AUSTRALIA CONTENT MARKETING MARKET, BY END USE, 2022-2032 ($BILLION)
- TABLE 48. REST OF ASIA-PACIFIC CONTENT MARKETING MARKET, BY CHANNEL TYPE, 2022-2032 ($BILLION)
- TABLE 49. REST OF ASIA-PACIFIC CONTENT MARKETING MARKET, BY END USE, 2022-2032 ($BILLION)
- TABLE 50. LAMEA CONTENT MARKETING MARKET, BY CHANNEL TYPE, 2022-2032 ($BILLION)
- TABLE 51. LAMEA CONTENT MARKETING MARKET, BY END USE, 2022-2032 ($BILLION)
- TABLE 52. LAMEA CONTENT MARKETING MARKET, BY COUNTRY, 2022-2032 ($BILLION)
- TABLE 53. BRAZIL CONTENT MARKETING MARKET, BY CHANNEL TYPE, 2022-2032 ($BILLION)
- TABLE 54. BRAZIL CONTENT MARKETING MARKET, BY END USE, 2022-2032 ($BILLION)
- TABLE 55. SAUDI ARABIA CONTENT MARKETING MARKET, BY CHANNEL TYPE, 2022-2032 ($BILLION)
- TABLE 56. SAUDI ARABIA CONTENT MARKETING MARKET, BY END USE, 2022-2032 ($BILLION)
- TABLE 57. UAE CONTENT MARKETING MARKET, BY CHANNEL TYPE, 2022-2032 ($BILLION)
- TABLE 58. UAE CONTENT MARKETING MARKET, BY END USE, 2022-2032 ($BILLION)
- TABLE 59. SOUTH AFRICA CONTENT MARKETING MARKET, BY CHANNEL TYPE, 2022-2032 ($BILLION)
- TABLE 60. SOUTH AFRICA CONTENT MARKETING MARKET, BY END USE, 2022-2032 ($BILLION)
- TABLE 61. REST OF LAMEA CONTENT MARKETING MARKET, BY CHANNEL TYPE, 2022-2032 ($BILLION)
- TABLE 62. REST OF LAMEA CONTENT MARKETING MARKET, BY END USE, 2022-2032 ($BILLION)
- TABLE 63. JACK IN THE BOX WORLDWIDE: KEY EXECUTIVES
- TABLE 64. JACK IN THE BOX WORLDWIDE: COMPANY SNAPSHOT
- TABLE 65. MEDIA.MONKS: KEY EXECUTIVES
- TABLE 66. MEDIA.MONKS: COMPANY SNAPSHOT
- TABLE 67. WATCONSULT: KEY EXECUTIVES
- TABLE 68. WATCONSULT: COMPANY SNAPSHOT
- TABLE 69. BC WEB WISE: KEY EXECUTIVES
- TABLE 70. BC WEB WISE: COMPANY SNAPSHOT
- TABLE 71. LOWE LINTAS: KEY EXECUTIVES
- TABLE 72. LOWE LINTAS: COMPANY SNAPSHOT
- TABLE 73. WAVEMAKER GLOBAL: KEY EXECUTIVES
- TABLE 74. WAVEMAKER GLOBAL: COMPANY SNAPSHOT
- TABLE 75. DENTSU WEBCHUTNEY: KEY EXECUTIVES
- TABLE 76. DENTSU WEBCHUTNEY: COMPANY SNAPSHOT
- TABLE 77. OGILVY: KEY EXECUTIVES
- TABLE 78. OGILVY: COMPANY SNAPSHOT
- TABLE 79. MINDSHARE MEDIA LTD: KEY EXECUTIVES
- TABLE 80. MINDSHARE MEDIA LTD: COMPANY SNAPSHOT
- TABLE 81. SOCIAL BEAT DIGITAL MARKETING LLP: KEY EXECUTIVES
- TABLE 82. SOCIAL BEAT DIGITAL MARKETING LLP: COMPANY SNAPSHOT
- TABLE 83. TAG: KEY EXECUTIVES
- TABLE 84. TAG: COMPANY SNAPSHOT
- TABLE 85. SCHBANG: KEY EXECUTIVES
- TABLE 86. SCHBANG: COMPANY SNAPSHOT
- TABLE 87. ZOO MEDIA: KEY EXECUTIVES
- TABLE 88. ZOO MEDIA: COMPANY SNAPSHOT
- TABLE 89. THE GLITCH: KEY EXECUTIVES
- TABLE 90. THE GLITCH: COMPANY SNAPSHOT
LIST OF FIGURES
- FIGURE 01. CONTENT MARKETING MARKET, 2022-2032
- FIGURE 02. SEGMENTATION OF CONTENT MARKETING MARKET,2022-2032
- FIGURE 03. TOP IMPACTING FACTORS IN CONTENT MARKETING MARKET
- FIGURE 04. TOP INVESTMENT POCKETS IN CONTENT MARKETING MARKET (2023-2032)
- FIGURE 05. BARGAINING POWER OF SUPPLIERS
- FIGURE 06. BARGAINING POWER OF BUYERS
- FIGURE 07. THREAT OF SUBSTITUTION
- FIGURE 08. THREAT OF SUBSTITUTION
- FIGURE 09. COMPETITIVE RIVALRY
- FIGURE 10. GLOBAL CONTENT MARKETING MARKET:DRIVERS, RESTRAINTS AND OPPORTUNITIES
- FIGURE 11. IMPACT OF KEY REGULATION: CONTENT MARKETING MARKET
- FIGURE 12. PATENT ANALYSIS BY COMPANY
- FIGURE 13. PATENT ANALYSIS BY COUNTRY
- FIGURE 14. CONTENT MARKETING MARKET, BY CHANNEL TYPE, 2022 AND 2032(%)
- FIGURE 15. COMPARATIVE SHARE ANALYSIS OF CONTENT MARKETING MARKET FOR SOCIAL MEDIA, BY COUNTRY 2022 AND 2032(%)
- FIGURE 16. COMPARATIVE SHARE ANALYSIS OF CONTENT MARKETING MARKET FOR BLOGS, BY COUNTRY 2022 AND 2032(%)
- FIGURE 17. COMPARATIVE SHARE ANALYSIS OF CONTENT MARKETING MARKET FOR VIDEO PLATFORMS, BY COUNTRY 2022 AND 2032(%)
- FIGURE 18. COMPARATIVE SHARE ANALYSIS OF CONTENT MARKETING MARKET FOR OTHERS, BY COUNTRY 2022 AND 2032(%)
- FIGURE 19. CONTENT MARKETING MARKET, BY END USE, 2022 AND 2032(%)
- FIGURE 20. COMPARATIVE SHARE ANALYSIS OF CONTENT MARKETING MARKET FOR BRAND AWARENESS, BY COUNTRY 2022 AND 2032(%)
- FIGURE 21. COMPARATIVE SHARE ANALYSIS OF CONTENT MARKETING MARKET FOR LEAD GENERATION, BY COUNTRY 2022 AND 2032(%)
- FIGURE 22. COMPARATIVE SHARE ANALYSIS OF CONTENT MARKETING MARKET FOR OTHERS, BY COUNTRY 2022 AND 2032(%)
- FIGURE 23. CONTENT MARKETING MARKET BY REGION, 2022 AND 2032(%)
- FIGURE 24. U.S. CONTENT MARKETING MARKET, 2022-2032 ($BILLION)
- FIGURE 25. CANADA CONTENT MARKETING MARKET, 2022-2032 ($BILLION)
- FIGURE 26. MEXICO CONTENT MARKETING MARKET, 2022-2032 ($BILLION)
- FIGURE 27. GERMANY CONTENT MARKETING MARKET, 2022-2032 ($BILLION)
- FIGURE 28. UK CONTENT MARKETING MARKET, 2022-2032 ($BILLION)
- FIGURE 29. FRANCE CONTENT MARKETING MARKET, 2022-2032 ($BILLION)
- FIGURE 30. SPAIN CONTENT MARKETING MARKET, 2022-2032 ($BILLION)
- FIGURE 31. ITALY CONTENT MARKETING MARKET, 2022-2032 ($BILLION)
- FIGURE 32. REST OF EUROPE CONTENT MARKETING MARKET, 2022-2032 ($BILLION)
- FIGURE 33. CHINA CONTENT MARKETING MARKET, 2022-2032 ($BILLION)
- FIGURE 34. JAPAN CONTENT MARKETING MARKET, 2022-2032 ($BILLION)
- FIGURE 35. INDIA CONTENT MARKETING MARKET, 2022-2032 ($BILLION)
- FIGURE 36. SOUTH KOREA CONTENT MARKETING MARKET, 2022-2032 ($BILLION)
- FIGURE 37. AUSTRALIA CONTENT MARKETING MARKET, 2022-2032 ($BILLION)
- FIGURE 38. REST OF ASIA-PACIFIC CONTENT MARKETING MARKET, 2022-2032 ($BILLION)
- FIGURE 39. BRAZIL CONTENT MARKETING MARKET, 2022-2032 ($BILLION)
- FIGURE 40. SAUDI ARABIA CONTENT MARKETING MARKET, 2022-2032 ($BILLION)
- FIGURE 41. UAE CONTENT MARKETING MARKET, 2022-2032 ($BILLION)
- FIGURE 42. SOUTH AFRICA CONTENT MARKETING MARKET, 2022-2032 ($BILLION)
- FIGURE 43. REST OF LAMEA CONTENT MARKETING MARKET, 2022-2032 ($BILLION)
- FIGURE 44. PRODUCT MAPPING OF TOP 10 PLAYERS
- FIGURE 45. COMPETITIVE DASHBOARD
- FIGURE 46. COMPETITIVE HEATMAP: CONTENT MARKETING MARKET
- FIGURE 47. TOP PLAYER POSITIONING, 2022
 内容行销市场规模、份额、成长分析(按内容类型、格式、技术整合、分销管道、垂直产业和地区)-2025 年至 2032 年产业预测
 2025年AI内容行销全球市场报告2025 年内容行销软体全球市场报告
 2025-2029 年全球内容行销市场
 内容行销市场:按管道类型、按业务类型、按内容类型、按行业应用、按客户类型、按内容格式、按目的 - 2025-2030 年全球预测内容行销软体市场:按组成部分、内容类型、组织规模、产业 - 2025-2030 年全球预测
 情境式行销解决方案市场:全球产业分析,规模,占有率,成长,趋势,2024年~2033年预测
 内容行销市场:市场占有率分析、产业趋势/统计、成长预测,2024-2029