


 |
市场调查报告书
商品编码
1447159
混合电容器市场:按产品类型、按应用划分:2023-2032 年全球机会分析与产业预测Hybrid Capacitor Market By Product Type (Radial Type, Laminating Type), By Application (Power Generation, Transmission, Distribution, Others): Global Opportunity Analysis and Industry Forecast, 2023-2032 |
||||||
混合电容器,也称为电化学电容器或超级电容,属于一类整合了传统电容器和电池特性的能源储存装置。
与依赖电极电荷分离和化学反应电池的标准电容器相比,混合电容器融合了静电双层电容(EDLC)和赝电容机制。这种融合使设备具有高功率密度、快速充电/放电能力和延长的循环寿命。
混合电容器在汽车领域发挥着至关重要的作用,特别是在电动车(EV)和混合动力电动车(HEV)中。其高功率密度可在加速过程中实现快速能量爆发,有助于提高电动车的整体性能。此外,混合电容器在再生煞车系统中发挥重要作用,在车辆减速期间恢復和储存能量。这种储存的能量在传统煞车系统中会以热量的形式散失,但在加速过程中可以更有效地利用,使电动车更加节能并延长其行驶里程。混合电容器管理快速充放电週期的能力对于满足汽车应用的动态能源管理要求特别有用。
在家用电子电器中,混合电容器用于各种应用,以满足对有效和高效能能源储存解决方案不断增长的需求。主要应用是行动电子设备,例如智慧型手机、笔记型电脑和平板电脑。混合电容器因其在功率和能源储存之间的平衡特性而被纳入这些设备中。混合电容器的快速充电和放电能力有助于减少电子设备的充电时间,增加使用者的便利性。此外,其耐用性和循环寿命使其适合频繁充电和放电的应用。
医疗设备也受益于混合电容器的结合,特别是对于需要快速能量释放的设备。心臟去颤器和某些监测设备等关键医疗设备依赖于混合电容器的快速反应和能量供给能力,从而提高了基本医疗干预措施的有效性和可靠性。
由于汽车应用中越来越多地采用径向型混合电容器,加上其尺寸紧凑且适合高密度封装,混合电容器市场预计将显着增长。此外,可再生能源市场的成长和抗振能力的增强预计将为预测期内的市场成长提供有利的机会。相反,低能量密度限制了混合电容器市场的成长。
混合电容器市场按产品类型、应用和地区细分。依产品类型,市场分为径向型和层压型。层压型细分市场预计将在 2022 年占据市场主导地位,而由于混合电容器在汽车应用中的使用不断增加,径向型预计到 2032 年将占据主要市场占有率。依应用划分,市场分为发电、输电、配电等。由于政府和私人公司对公共领域的投资不断增加,发电业预计将在 2022 年占据市场主导地位,并在 2032 年占据主要市场占有率。
依地区划分,我们有北美(美国、加拿大、墨西哥)、欧洲(德国、英国、法国、西班牙、义大利其他欧洲国家地区)、亚太地区(中国、日本、印度、韩国等亚洲地区)太平洋地区)和LAMEA (巴西)、南非、沙乌地阿拉伯和其他混合地区)进行了分析。
相关人员的主要利益
- 该报告定量分析了 2022 年至 2032 年混合电容器市场分析的细分市场、当前趋势、估计/趋势和动态,并确定了混合电容器市场的强大机会。
- 我们提供市场研究以及与市场驱动因素、市场限制和市场机会相关的资讯。
- 波特的五力分析揭示了买家和供应商的潜力,帮助相关人员做出利润驱动的业务决策并加强供应商和买家网路。
- 对混合电容器市场细分的详细分析有助于识别市场机会。
- 每个地区的主要国家都根据其对全球市场的收益贡献绘製了地图。
- 市场参与者定位有助于基准化分析,并提供对市场参与者当前地位的清晰了解。
- 它包括区域和全球混合电容器市场趋势、主要企业、细分市场、应用领域、市场成长策略等的分析。
可以使用此报告进行定制
- 供应链分析与供应商利润
- 新产品开发/主要企业产品矩阵
- 根据客户兴趣新增其他公司简介
- 导入/汇出分析/资料
- 按世界/地区/国家分類的玩家份额分析
目录
第一章简介
第 2 章执行摘要
第三章市场概况
- 市场定义和范围
- 主要发现
- 影响因素
- 主要投资机会
- 波特五力分析
- 市场动态
- 促进因素
- 抑制因素
- 机会
第四章混合电容器市场:依产品类型
- 概述
- 径向型
- 层压型
第五章混合电容器市场:依应用分类
- 概述
- 发电
- 电力传输
- 电力调配
- 其他的
第六章混合电容器市场:依地区
- 概述
- 北美洲
- 美国
- 加拿大
- 墨西哥
- 欧洲
- 德国
- 英国
- 法国
- 西班牙
- 义大利
- 其他的
- 亚太地区
- 中国
- 日本
- 印度
- 韩国
- 其他的
- 拉丁美洲
- 玻利维亚
- 阿根廷
- 其他拉丁美洲
- 中东/非洲
- 沙乌地阿拉伯
- 非洲
- 其他中东和非洲
第七章 竞争格局
- 介绍
- 关键成功策略
- 10家主要企业产品图谱
- 竞争对手仪表板
- 竞争热图
- 2022年主要企业定位
第八章 公司简介
- JTEKT Corporation
- TAIYO YUDEN CO., LTD.
- Vishay Intertechnology, Inc.
- LICAP Technologies, Inc.
- SOCOMEC GROUP
- EVE Energy Co., Ltd.
- SPEL TECHNOLOGIES PRIVATE LTD.
- Electro Standards Laboratories
- Yunasko
- KEMET Corporation
Hybrid capacitors, also referred to as electrochemical capacitors or supercapacitors, belong to a distinct category of energy storage devices that integrate features from both conventional capacitors and batteries. In contrast to standard capacitors relying on electrode charge separation and batteries involving chemical reactions, hybrid capacitors combine electrostatic double-layer capacitance (EDLC) and pseudo-capacitance mechanisms. This fusion results in a device characterized by high power density, swift charge and discharge capabilities, and an extended cycle life.
Within the automotive sector, hybrid capacitors hold a pivotal role, particularly in electric vehicles (EVs) and hybrid electric vehicles (HEVs). Their elevated power density allows for rapid energy bursts during acceleration, contributing to the overall enhancement of electric vehicle performance. Furthermore, hybrid capacitors play a crucial part in regenerative braking systems, capturing and storing energy during vehicle deceleration. This stored energy, which would otherwise dissipate as heat in traditional braking systems, is efficiently utilized for acceleration, leading to improved energy efficiency and increased range for electric vehicles. The capability of hybrid capacitors to manage rapid charge and discharge cycles proves particularly helpful in addressing the dynamic energy management requirements of automotive applications.
In consumer electronics, hybrid capacitors serve varied purposes, meeting the escalating demand for effective and high-performance energy storage solutions. A primary application lies in portable electronic devices like smartphones, laptops, and tablets. Hybrid capacitors are integrated into these devices due to their balanced attributes between power and energy storage. The swift charging and discharging features of hybrid capacitors contribute to expedited charging times for electronic devices, enhancing user convenience. In addition, their durability and cycle life make them well-suited for applications where frequent charging and discharging are prevalent.
Medical devices also derive benefits from the incorporation of hybrid capacitors, especially those necessitating rapid energy release. Critical medical equipment such as defibrillators and specific monitoring devices rely on the prompt response and energy delivery capabilities of hybrid capacitors, enhancing the efficacy and reliability of essential medical interventions.
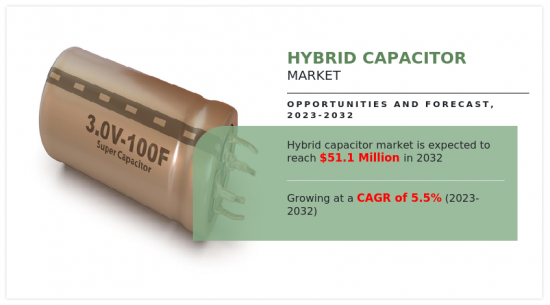
The hybrid capacitor market is expected to witness significant growth, driven by the increase in adoption of radial type hybrid capacitors in automotive applications, coupled with their compact size and compatibility for high-density packaging. Moreover, increase in renewable energy market and improved vibration resistance are expected to provide lucrative opportunities for the growth of the market during the forecast period. On the contrary, low energy density limits the growth of the hybrid capacitor market.
The hybrid capacitor market is segmented into product type, application, and region. On the basis of product type, the market is divided into radial type and laminating type. In 2022, the laminating type segment dominated the market, and radial type is expected to acquire a major market share by 2032 owing to increase in use of hybrid capacitors in automotive application. On the basis of application, the market is categorized into power generation, transmission, distribution, and others. In 2022, the power generation segment dominated the market, and it is expected to acquire a major market share by 2032 due to an increase in investment of government and private companies in utility sector.
On the basis of region, the hybrid capacitor market trends are analyzed across North America (the U.S., Canada, and Mexico), Europe (Germany, UK, France, Spain, Italy, and rest of Europe), Asia-Pacific (China, Japan, India, South Korea, and rest of Asia-Pacific), and LAMEA (Brazil, South Africa, Saudi Arabia, and rest of LAMEA).
Competitive analysis and profiles of the major global Hybrid capacitor market players that have been provided in the report include JTEKT Corporation, TAIYO YUDEN CO., LTD., Vishay Intertechnology, Inc., LICAP Technologies, Inc., SOCOMEC GROUP, EVE Energy Co., Ltd., SPEL TECHNOLOGIES PRIVATE LTD., Electro Standards Laboratories, Yunasko, and KEMET Corporation. The key strategy adopted by the major players of the hybrid capacitor market is product launch.
Key Benefits For Stakeholders
- This report provides a quantitative analysis of the market segments, current trends, estimations, and dynamics of the hybrid capacitor market analysis from 2022 to 2032 to identify the prevailing hybrid capacitor market opportunities.
- The market research is offered along with information related to key drivers, restraints, and opportunities.
- Porter's five forces analysis highlights the potency of buyers and suppliers to enable stakeholders make profit-oriented business decisions and strengthen their supplier-buyer network.
- In-depth analysis of the hybrid capacitor market segmentation assists to determine the prevailing market opportunities.
- Major countries in each region are mapped according to their revenue contribution to the global market.
- Market player positioning facilitates benchmarking and provides a clear understanding of the present position of the market players.
- The report includes the analysis of the regional as well as global hybrid capacitor market trends, key players, market segments, application areas, and market growth strategies.
Additional benefits you will get with this purchase are:
- Quarterly Update and* (only available with a corporate license, on listed price)
- 5 additional Company Profile of client Choice pre- or Post-purchase, as a free update.
- Free Upcoming Version on the Purchase of Five and Enterprise User License.
- 16 analyst hours of support* (post-purchase, if you find additional data requirements upon review of the report, you may receive support amounting to 16 analyst hours to solve questions, and post-sale queries)
- 15% Free Customization* (in case the scope or segment of the report does not match your requirements, 15% is equivalent to 3 working days of free work, applicable once)
- Free data Pack on the Five and Enterprise User License. (Excel version of the report)
- Free Updated report if the report is 6-12 months old or older.
- 24-hour priority response*
- Free Industry updates and white papers.
Possible Customization with this report (with additional cost and timeline, please talk to the sales executive to know more)
- Supply Chain Analysis & Vendor Margins
- New Product Development/ Product Matrix of Key Players
- Additional company profiles with specific to client's interest
- Import Export Analysis/Data
- Market share analysis of players at global/region/country level
Key Market Segments
By Product Type
- Radial Type
- Laminating Type
By Application
- Power Generation
- Transmission
- Distribution
- Others
By Region
- North America
- U.S.
- Canada
- Mexico
- Europe
- Germany
- UK
- France
- Spain
- Italy
- Rest of Europe
- Asia-Pacific
- China
- Japan
- India
- South Korea
- Rest of Asia-Pacific
- Latin America
- Bolivia
- Argentina
- Rest of Latin America
- Middle East and Africa
- Saudi Arabia
- Africa
- Rest of Middle East And Africa
Key Market Players:
- JTEKT Corporation
- TAIYO YUDEN CO., LTD.
- Vishay Intertechnology, Inc.
- LICAP Technologies, Inc.
- SOCOMEC GROUP
- EVE Energy Co., Ltd.
- KEMET Corporation
- SPEL TECHNOLOGIES PRIVATE LTD.
- Yunasko
- Electro Standards Laboratories
TABLE OF CONTENTS
CHAPTER 1: INTRODUCTION
- 1.1. Report description
- 1.2. Key market segments
- 1.3. Key benefits to the stakeholders
- 1.4. Research methodology
- 1.4.1. Primary research
- 1.4.2. Secondary research
- 1.4.3. Analyst tools and models
CHAPTER 2: EXECUTIVE SUMMARY
- 2.1. CXO Perspective
CHAPTER 3: MARKET OVERVIEW
- 3.1. Market definition and scope
- 3.2. Key findings
- 3.2.1. Top impacting factors
- 3.2.2. Top investment pockets
- 3.3. Porter's five forces analysis
- 3.4. Market dynamics
- 3.4.1. Drivers
- 3.4.2. Restraints
- 3.4.3. Opportunities
CHAPTER 4: HYBRID CAPACITOR MARKET, BY PRODUCT TYPE
- 4.1. Overview
- 4.1.1. Market size and forecast
- 4.2. Radial Type
- 4.2.1. Key market trends, growth factors and opportunities
- 4.2.2. Market size and forecast, by region
- 4.2.3. Market share analysis by country
- 4.3. Laminating Type
- 4.3.1. Key market trends, growth factors and opportunities
- 4.3.2. Market size and forecast, by region
- 4.3.3. Market share analysis by country
CHAPTER 5: HYBRID CAPACITOR MARKET, BY APPLICATION
- 5.1. Overview
- 5.1.1. Market size and forecast
- 5.2. Power Generation
- 5.2.1. Key market trends, growth factors and opportunities
- 5.2.2. Market size and forecast, by region
- 5.2.3. Market share analysis by country
- 5.3. Transmission
- 5.3.1. Key market trends, growth factors and opportunities
- 5.3.2. Market size and forecast, by region
- 5.3.3. Market share analysis by country
- 5.4. Distribution
- 5.4.1. Key market trends, growth factors and opportunities
- 5.4.2. Market size and forecast, by region
- 5.4.3. Market share analysis by country
- 5.5. Others
- 5.5.1. Key market trends, growth factors and opportunities
- 5.5.2. Market size and forecast, by region
- 5.5.3. Market share analysis by country
CHAPTER 6: HYBRID CAPACITOR MARKET, BY REGION
- 6.1. Overview
- 6.1.1. Market size and forecast By Region
- 6.2. North America
- 6.2.1. Key market trends, growth factors and opportunities
- 6.2.2. Market size and forecast, by Product Type
- 6.2.3. Market size and forecast, by Application
- 6.2.4. Market size and forecast, by country
- 6.2.4.1. U.S.
- 6.2.4.1.1. Market size and forecast, by Product Type
- 6.2.4.1.2. Market size and forecast, by Application
- 6.2.4.2. Canada
- 6.2.4.2.1. Market size and forecast, by Product Type
- 6.2.4.2.2. Market size and forecast, by Application
- 6.2.4.3. Mexico
- 6.2.4.3.1. Market size and forecast, by Product Type
- 6.2.4.3.2. Market size and forecast, by Application
- 6.3. Europe
- 6.3.1. Key market trends, growth factors and opportunities
- 6.3.2. Market size and forecast, by Product Type
- 6.3.3. Market size and forecast, by Application
- 6.3.4. Market size and forecast, by country
- 6.3.4.1. Germany
- 6.3.4.1.1. Market size and forecast, by Product Type
- 6.3.4.1.2. Market size and forecast, by Application
- 6.3.4.2. UK
- 6.3.4.2.1. Market size and forecast, by Product Type
- 6.3.4.2.2. Market size and forecast, by Application
- 6.3.4.3. France
- 6.3.4.3.1. Market size and forecast, by Product Type
- 6.3.4.3.2. Market size and forecast, by Application
- 6.3.4.4. Spain
- 6.3.4.4.1. Market size and forecast, by Product Type
- 6.3.4.4.2. Market size and forecast, by Application
- 6.3.4.5. Italy
- 6.3.4.5.1. Market size and forecast, by Product Type
- 6.3.4.5.2. Market size and forecast, by Application
- 6.3.4.6. Rest of Europe
- 6.3.4.6.1. Market size and forecast, by Product Type
- 6.3.4.6.2. Market size and forecast, by Application
- 6.4. Asia-Pacific
- 6.4.1. Key market trends, growth factors and opportunities
- 6.4.2. Market size and forecast, by Product Type
- 6.4.3. Market size and forecast, by Application
- 6.4.4. Market size and forecast, by country
- 6.4.4.1. China
- 6.4.4.1.1. Market size and forecast, by Product Type
- 6.4.4.1.2. Market size and forecast, by Application
- 6.4.4.2. Japan
- 6.4.4.2.1. Market size and forecast, by Product Type
- 6.4.4.2.2. Market size and forecast, by Application
- 6.4.4.3. India
- 6.4.4.3.1. Market size and forecast, by Product Type
- 6.4.4.3.2. Market size and forecast, by Application
- 6.4.4.4. South Korea
- 6.4.4.4.1. Market size and forecast, by Product Type
- 6.4.4.4.2. Market size and forecast, by Application
- 6.4.4.5. Rest of Asia-Pacific
- 6.4.4.5.1. Market size and forecast, by Product Type
- 6.4.4.5.2. Market size and forecast, by Application
- 6.5. Latin America
- 6.5.1. Key market trends, growth factors and opportunities
- 6.5.2. Market size and forecast, by Product Type
- 6.5.3. Market size and forecast, by Application
- 6.5.4. Market size and forecast, by country
- 6.5.4.1. Bolivia
- 6.5.4.1.1. Market size and forecast, by Product Type
- 6.5.4.1.2. Market size and forecast, by Application
- 6.5.4.2. Argentina
- 6.5.4.2.1. Market size and forecast, by Product Type
- 6.5.4.2.2. Market size and forecast, by Application
- 6.5.4.3. Rest of Latin America
- 6.5.4.3.1. Market size and forecast, by Product Type
- 6.5.4.3.2. Market size and forecast, by Application
- 6.6. Middle East and Africa
- 6.6.1. Key market trends, growth factors and opportunities
- 6.6.2. Market size and forecast, by Product Type
- 6.6.3. Market size and forecast, by Application
- 6.6.4. Market size and forecast, by country
- 6.6.4.1. Saudi Arabia
- 6.6.4.1.1. Market size and forecast, by Product Type
- 6.6.4.1.2. Market size and forecast, by Application
- 6.6.4.2. Africa
- 6.6.4.2.1. Market size and forecast, by Product Type
- 6.6.4.2.2. Market size and forecast, by Application
- 6.6.4.3. Rest of Middle East And Africa
- 6.6.4.3.1. Market size and forecast, by Product Type
- 6.6.4.3.2. Market size and forecast, by Application
CHAPTER 7: COMPETITIVE LANDSCAPE
- 7.1. Introduction
- 7.2. Top winning strategies
- 7.3. Product mapping of top 10 player
- 7.4. Competitive dashboard
- 7.5. Competitive heatmap
- 7.6. Top player positioning, 2022
CHAPTER 8: COMPANY PROFILES
- 8.1. JTEKT Corporation
- 8.1.1. Company overview
- 8.1.2. Key executives
- 8.1.3. Company snapshot
- 8.1.4. Operating business segments
- 8.1.5. Product portfolio
- 8.1.6. Business performance
- 8.1.7. Key strategic moves and developments
- 8.2. TAIYO YUDEN CO., LTD.
- 8.2.1. Company overview
- 8.2.2. Key executives
- 8.2.3. Company snapshot
- 8.2.4. Operating business segments
- 8.2.5. Product portfolio
- 8.2.6. Business performance
- 8.2.7. Key strategic moves and developments
- 8.3. Vishay Intertechnology, Inc.
- 8.3.1. Company overview
- 8.3.2. Key executives
- 8.3.3. Company snapshot
- 8.3.4. Operating business segments
- 8.3.5. Product portfolio
- 8.3.6. Business performance
- 8.3.7. Key strategic moves and developments
- 8.4. LICAP Technologies, Inc.
- 8.4.1. Company overview
- 8.4.2. Key executives
- 8.4.3. Company snapshot
- 8.4.4. Operating business segments
- 8.4.5. Product portfolio
- 8.4.6. Business performance
- 8.4.7. Key strategic moves and developments
- 8.5. SOCOMEC GROUP
- 8.5.1. Company overview
- 8.5.2. Key executives
- 8.5.3. Company snapshot
- 8.5.4. Operating business segments
- 8.5.5. Product portfolio
- 8.5.6. Business performance
- 8.5.7. Key strategic moves and developments
- 8.6. EVE Energy Co., Ltd.
- 8.6.1. Company overview
- 8.6.2. Key executives
- 8.6.3. Company snapshot
- 8.6.4. Operating business segments
- 8.6.5. Product portfolio
- 8.6.6. Business performance
- 8.6.7. Key strategic moves and developments
- 8.7. SPEL TECHNOLOGIES PRIVATE LTD.
- 8.7.1. Company overview
- 8.7.2. Key executives
- 8.7.3. Company snapshot
- 8.7.4. Operating business segments
- 8.7.5. Product portfolio
- 8.7.6. Business performance
- 8.7.7. Key strategic moves and developments
- 8.8. Electro Standards Laboratories
- 8.8.1. Company overview
- 8.8.2. Key executives
- 8.8.3. Company snapshot
- 8.8.4. Operating business segments
- 8.8.5. Product portfolio
- 8.8.6. Business performance
- 8.8.7. Key strategic moves and developments
- 8.9. Yunasko
- 8.9.1. Company overview
- 8.9.2. Key executives
- 8.9.3. Company snapshot
- 8.9.4. Operating business segments
- 8.9.5. Product portfolio
- 8.9.6. Business performance
- 8.9.7. Key strategic moves and developments
- 8.10. KEMET Corporation
- 8.10.1. Company overview
- 8.10.2. Key executives
- 8.10.3. Company snapshot
- 8.10.4. Operating business segments
- 8.10.5. Product portfolio
- 8.10.6. Business performance
- 8.10.7. Key strategic moves and developments
LIST OF TABLES
- TABLE 01. GLOBAL HYBRID CAPACITOR MARKET, BY PRODUCT TYPE, 2022-2032 ($MILLION)
- TABLE 02. HYBRID CAPACITOR MARKET FOR RADIAL TYPE, BY REGION, 2022-2032 ($MILLION)
- TABLE 03. HYBRID CAPACITOR MARKET FOR LAMINATING TYPE, BY REGION, 2022-2032 ($MILLION)
- TABLE 04. GLOBAL HYBRID CAPACITOR MARKET, BY APPLICATION, 2022-2032 ($MILLION)
- TABLE 05. HYBRID CAPACITOR MARKET FOR POWER GENERATION, BY REGION, 2022-2032 ($MILLION)
- TABLE 06. HYBRID CAPACITOR MARKET FOR TRANSMISSION, BY REGION, 2022-2032 ($MILLION)
- TABLE 07. HYBRID CAPACITOR MARKET FOR DISTRIBUTION, BY REGION, 2022-2032 ($MILLION)
- TABLE 08. HYBRID CAPACITOR MARKET FOR OTHERS, BY REGION, 2022-2032 ($MILLION)
- TABLE 09. HYBRID CAPACITOR MARKET, BY REGION, 2022-2032 ($MILLION)
- TABLE 10. NORTH AMERICA HYBRID CAPACITOR MARKET, BY PRODUCT TYPE, 2022-2032 ($MILLION)
- TABLE 11. NORTH AMERICA HYBRID CAPACITOR MARKET, BY APPLICATION, 2022-2032 ($MILLION)
- TABLE 12. NORTH AMERICA HYBRID CAPACITOR MARKET, BY COUNTRY, 2022-2032 ($MILLION)
- TABLE 13. U.S. HYBRID CAPACITOR MARKET, BY PRODUCT TYPE, 2022-2032 ($MILLION)
- TABLE 14. U.S. HYBRID CAPACITOR MARKET, BY APPLICATION, 2022-2032 ($MILLION)
- TABLE 15. CANADA HYBRID CAPACITOR MARKET, BY PRODUCT TYPE, 2022-2032 ($MILLION)
- TABLE 16. CANADA HYBRID CAPACITOR MARKET, BY APPLICATION, 2022-2032 ($MILLION)
- TABLE 17. MEXICO HYBRID CAPACITOR MARKET, BY PRODUCT TYPE, 2022-2032 ($MILLION)
- TABLE 18. MEXICO HYBRID CAPACITOR MARKET, BY APPLICATION, 2022-2032 ($MILLION)
- TABLE 19. EUROPE HYBRID CAPACITOR MARKET, BY PRODUCT TYPE, 2022-2032 ($MILLION)
- TABLE 20. EUROPE HYBRID CAPACITOR MARKET, BY APPLICATION, 2022-2032 ($MILLION)
- TABLE 21. EUROPE HYBRID CAPACITOR MARKET, BY COUNTRY, 2022-2032 ($MILLION)
- TABLE 22. GERMANY HYBRID CAPACITOR MARKET, BY PRODUCT TYPE, 2022-2032 ($MILLION)
- TABLE 23. GERMANY HYBRID CAPACITOR MARKET, BY APPLICATION, 2022-2032 ($MILLION)
- TABLE 24. UK HYBRID CAPACITOR MARKET, BY PRODUCT TYPE, 2022-2032 ($MILLION)
- TABLE 25. UK HYBRID CAPACITOR MARKET, BY APPLICATION, 2022-2032 ($MILLION)
- TABLE 26. FRANCE HYBRID CAPACITOR MARKET, BY PRODUCT TYPE, 2022-2032 ($MILLION)
- TABLE 27. FRANCE HYBRID CAPACITOR MARKET, BY APPLICATION, 2022-2032 ($MILLION)
- TABLE 28. SPAIN HYBRID CAPACITOR MARKET, BY PRODUCT TYPE, 2022-2032 ($MILLION)
- TABLE 29. SPAIN HYBRID CAPACITOR MARKET, BY APPLICATION, 2022-2032 ($MILLION)
- TABLE 30. ITALY HYBRID CAPACITOR MARKET, BY PRODUCT TYPE, 2022-2032 ($MILLION)
- TABLE 31. ITALY HYBRID CAPACITOR MARKET, BY APPLICATION, 2022-2032 ($MILLION)
- TABLE 32. REST OF EUROPE HYBRID CAPACITOR MARKET, BY PRODUCT TYPE, 2022-2032 ($MILLION)
- TABLE 33. REST OF EUROPE HYBRID CAPACITOR MARKET, BY APPLICATION, 2022-2032 ($MILLION)
- TABLE 34. ASIA-PACIFIC HYBRID CAPACITOR MARKET, BY PRODUCT TYPE, 2022-2032 ($MILLION)
- TABLE 35. ASIA-PACIFIC HYBRID CAPACITOR MARKET, BY APPLICATION, 2022-2032 ($MILLION)
- TABLE 36. ASIA-PACIFIC HYBRID CAPACITOR MARKET, BY COUNTRY, 2022-2032 ($MILLION)
- TABLE 37. CHINA HYBRID CAPACITOR MARKET, BY PRODUCT TYPE, 2022-2032 ($MILLION)
- TABLE 38. CHINA HYBRID CAPACITOR MARKET, BY APPLICATION, 2022-2032 ($MILLION)
- TABLE 39. JAPAN HYBRID CAPACITOR MARKET, BY PRODUCT TYPE, 2022-2032 ($MILLION)
- TABLE 40. JAPAN HYBRID CAPACITOR MARKET, BY APPLICATION, 2022-2032 ($MILLION)
- TABLE 41. INDIA HYBRID CAPACITOR MARKET, BY PRODUCT TYPE, 2022-2032 ($MILLION)
- TABLE 42. INDIA HYBRID CAPACITOR MARKET, BY APPLICATION, 2022-2032 ($MILLION)
- TABLE 43. SOUTH KOREA HYBRID CAPACITOR MARKET, BY PRODUCT TYPE, 2022-2032 ($MILLION)
- TABLE 44. SOUTH KOREA HYBRID CAPACITOR MARKET, BY APPLICATION, 2022-2032 ($MILLION)
- TABLE 45. REST OF ASIA-PACIFIC HYBRID CAPACITOR MARKET, BY PRODUCT TYPE, 2022-2032 ($MILLION)
- TABLE 46. REST OF ASIA-PACIFIC HYBRID CAPACITOR MARKET, BY APPLICATION, 2022-2032 ($MILLION)
- TABLE 47. LATIN AMERICA HYBRID CAPACITOR MARKET, BY PRODUCT TYPE, 2022-2032 ($MILLION)
- TABLE 48. LATIN AMERICA HYBRID CAPACITOR MARKET, BY APPLICATION, 2022-2032 ($MILLION)
- TABLE 49. LATIN AMERICA HYBRID CAPACITOR MARKET, BY COUNTRY, 2022-2032 ($MILLION)
- TABLE 50. BOLIVIA HYBRID CAPACITOR MARKET, BY PRODUCT TYPE, 2022-2032 ($MILLION)
- TABLE 51. BOLIVIA HYBRID CAPACITOR MARKET, BY APPLICATION, 2022-2032 ($MILLION)
- TABLE 52. ARGENTINA HYBRID CAPACITOR MARKET, BY PRODUCT TYPE, 2022-2032 ($MILLION)
- TABLE 53. ARGENTINA HYBRID CAPACITOR MARKET, BY APPLICATION, 2022-2032 ($MILLION)
- TABLE 54. REST OF LATIN AMERICA HYBRID CAPACITOR MARKET, BY PRODUCT TYPE, 2022-2032 ($MILLION)
- TABLE 55. REST OF LATIN AMERICA HYBRID CAPACITOR MARKET, BY APPLICATION, 2022-2032 ($MILLION)
- TABLE 56. MIDDLE EAST AND AFRICA HYBRID CAPACITOR MARKET, BY PRODUCT TYPE, 2022-2032 ($MILLION)
- TABLE 57. MIDDLE EAST AND AFRICA HYBRID CAPACITOR MARKET, BY APPLICATION, 2022-2032 ($MILLION)
- TABLE 58. MIDDLE EAST AND AFRICA HYBRID CAPACITOR MARKET, BY COUNTRY, 2022-2032 ($MILLION)
- TABLE 59. SAUDI ARABIA HYBRID CAPACITOR MARKET, BY PRODUCT TYPE, 2022-2032 ($MILLION)
- TABLE 60. SAUDI ARABIA HYBRID CAPACITOR MARKET, BY APPLICATION, 2022-2032 ($MILLION)
- TABLE 61. AFRICA HYBRID CAPACITOR MARKET, BY PRODUCT TYPE, 2022-2032 ($MILLION)
- TABLE 62. AFRICA HYBRID CAPACITOR MARKET, BY APPLICATION, 2022-2032 ($MILLION)
- TABLE 63. REST OF MIDDLE EAST AND AFRICA HYBRID CAPACITOR MARKET, BY PRODUCT TYPE, 2022-2032 ($MILLION)
- TABLE 64. REST OF MIDDLE EAST AND AFRICA HYBRID CAPACITOR MARKET, BY APPLICATION, 2022-2032 ($MILLION)
- TABLE 65. JTEKT CORPORATION: KEY EXECUTIVES
- TABLE 66. JTEKT CORPORATION: COMPANY SNAPSHOT
- TABLE 67. JTEKT CORPORATION: PRODUCT SEGMENTS
- TABLE 68. JTEKT CORPORATION: SERVICE SEGMENTS
- TABLE 69. JTEKT CORPORATION: PRODUCT PORTFOLIO
- TABLE 70. JTEKT CORPORATION: KEY STRATERGIES
- TABLE 71. TAIYO YUDEN CO., LTD.: KEY EXECUTIVES
- TABLE 72. TAIYO YUDEN CO., LTD.: COMPANY SNAPSHOT
- TABLE 73. TAIYO YUDEN CO., LTD.: PRODUCT SEGMENTS
- TABLE 74. TAIYO YUDEN CO., LTD.: SERVICE SEGMENTS
- TABLE 75. TAIYO YUDEN CO., LTD.: PRODUCT PORTFOLIO
- TABLE 76. TAIYO YUDEN CO., LTD.: KEY STRATERGIES
- TABLE 77. VISHAY INTERTECHNOLOGY, INC.: KEY EXECUTIVES
- TABLE 78. VISHAY INTERTECHNOLOGY, INC.: COMPANY SNAPSHOT
- TABLE 79. VISHAY INTERTECHNOLOGY, INC.: PRODUCT SEGMENTS
- TABLE 80. VISHAY INTERTECHNOLOGY, INC.: SERVICE SEGMENTS
- TABLE 81. VISHAY INTERTECHNOLOGY, INC.: PRODUCT PORTFOLIO
- TABLE 82. VISHAY INTERTECHNOLOGY, INC.: KEY STRATERGIES
- TABLE 83. LICAP TECHNOLOGIES, INC.: KEY EXECUTIVES
- TABLE 84. LICAP TECHNOLOGIES, INC.: COMPANY SNAPSHOT
- TABLE 85. LICAP TECHNOLOGIES, INC.: PRODUCT SEGMENTS
- TABLE 86. LICAP TECHNOLOGIES, INC.: SERVICE SEGMENTS
- TABLE 87. LICAP TECHNOLOGIES, INC.: PRODUCT PORTFOLIO
- TABLE 88. LICAP TECHNOLOGIES, INC.: KEY STRATERGIES
- TABLE 89. SOCOMEC GROUP: KEY EXECUTIVES
- TABLE 90. SOCOMEC GROUP: COMPANY SNAPSHOT
- TABLE 91. SOCOMEC GROUP: PRODUCT SEGMENTS
- TABLE 92. SOCOMEC GROUP: SERVICE SEGMENTS
- TABLE 93. SOCOMEC GROUP: PRODUCT PORTFOLIO
- TABLE 94. SOCOMEC GROUP: KEY STRATERGIES
- TABLE 95. EVE ENERGY CO., LTD.: KEY EXECUTIVES
- TABLE 96. EVE ENERGY CO., LTD.: COMPANY SNAPSHOT
- TABLE 97. EVE ENERGY CO., LTD.: PRODUCT SEGMENTS
- TABLE 98. EVE ENERGY CO., LTD.: SERVICE SEGMENTS
- TABLE 99. EVE ENERGY CO., LTD.: PRODUCT PORTFOLIO
- TABLE 100. EVE ENERGY CO., LTD.: KEY STRATERGIES
- TABLE 101. SPEL TECHNOLOGIES PRIVATE LTD.: KEY EXECUTIVES
- TABLE 102. SPEL TECHNOLOGIES PRIVATE LTD.: COMPANY SNAPSHOT
- TABLE 103. SPEL TECHNOLOGIES PRIVATE LTD.: PRODUCT SEGMENTS
- TABLE 104. SPEL TECHNOLOGIES PRIVATE LTD.: SERVICE SEGMENTS
- TABLE 105. SPEL TECHNOLOGIES PRIVATE LTD.: PRODUCT PORTFOLIO
- TABLE 106. SPEL TECHNOLOGIES PRIVATE LTD.: KEY STRATERGIES
- TABLE 107. ELECTRO STANDARDS LABORATORIES: KEY EXECUTIVES
- TABLE 108. ELECTRO STANDARDS LABORATORIES: COMPANY SNAPSHOT
- TABLE 109. ELECTRO STANDARDS LABORATORIES: PRODUCT SEGMENTS
- TABLE 110. ELECTRO STANDARDS LABORATORIES: SERVICE SEGMENTS
- TABLE 111. ELECTRO STANDARDS LABORATORIES: PRODUCT PORTFOLIO
- TABLE 112. ELECTRO STANDARDS LABORATORIES: KEY STRATERGIES
- TABLE 113. YUNASKO: KEY EXECUTIVES
- TABLE 114. YUNASKO: COMPANY SNAPSHOT
- TABLE 115. YUNASKO: PRODUCT SEGMENTS
- TABLE 116. YUNASKO: SERVICE SEGMENTS
- TABLE 117. YUNASKO: PRODUCT PORTFOLIO
- TABLE 118. YUNASKO: KEY STRATERGIES
- TABLE 119. KEMET CORPORATION: KEY EXECUTIVES
- TABLE 120. KEMET CORPORATION: COMPANY SNAPSHOT
- TABLE 121. KEMET CORPORATION: PRODUCT SEGMENTS
- TABLE 122. KEMET CORPORATION: SERVICE SEGMENTS
- TABLE 123. KEMET CORPORATION: PRODUCT PORTFOLIO
- TABLE 124. KEMET CORPORATION: KEY STRATERGIES
LIST OF FIGURES
- FIGURE 01. HYBRID CAPACITOR MARKET, 2022-2032
- FIGURE 02. SEGMENTATION OF HYBRID CAPACITOR MARKET,2022-2032
- FIGURE 03. TOP IMPACTING FACTORS IN HYBRID CAPACITOR MARKET
- FIGURE 04. TOP INVESTMENT POCKETS IN HYBRID CAPACITOR MARKET (2023-2032)
- FIGURE 05. BARGAINING POWER OF SUPPLIERS
- FIGURE 06. BARGAINING POWER OF BUYERS
- FIGURE 07. THREAT OF SUBSTITUTION
- FIGURE 08. THREAT OF SUBSTITUTION
- FIGURE 09. COMPETITIVE RIVALRY
- FIGURE 10. GLOBAL HYBRID CAPACITOR MARKET:DRIVERS, RESTRAINTS AND OPPORTUNITIES
- FIGURE 11. HYBRID CAPACITOR MARKET, BY PRODUCT TYPE, 2022 AND 2032(%)
- FIGURE 12. COMPARATIVE SHARE ANALYSIS OF HYBRID CAPACITOR MARKET FOR RADIAL TYPE, BY COUNTRY 2022 AND 2032(%)
- FIGURE 13. COMPARATIVE SHARE ANALYSIS OF HYBRID CAPACITOR MARKET FOR LAMINATING TYPE, BY COUNTRY 2022 AND 2032(%)
- FIGURE 14. HYBRID CAPACITOR MARKET, BY APPLICATION, 2022 AND 2032(%)
- FIGURE 15. COMPARATIVE SHARE ANALYSIS OF HYBRID CAPACITOR MARKET FOR POWER GENERATION, BY COUNTRY 2022 AND 2032(%)
- FIGURE 16. COMPARATIVE SHARE ANALYSIS OF HYBRID CAPACITOR MARKET FOR TRANSMISSION, BY COUNTRY 2022 AND 2032(%)
- FIGURE 17. COMPARATIVE SHARE ANALYSIS OF HYBRID CAPACITOR MARKET FOR DISTRIBUTION, BY COUNTRY 2022 AND 2032(%)
- FIGURE 18. COMPARATIVE SHARE ANALYSIS OF HYBRID CAPACITOR MARKET FOR OTHERS, BY COUNTRY 2022 AND 2032(%)
- FIGURE 19. HYBRID CAPACITOR MARKET BY REGION, 2022 AND 2032(%)
- FIGURE 20. U.S. HYBRID CAPACITOR MARKET, 2022-2032 ($MILLION)
- FIGURE 21. CANADA HYBRID CAPACITOR MARKET, 2022-2032 ($MILLION)
- FIGURE 22. MEXICO HYBRID CAPACITOR MARKET, 2022-2032 ($MILLION)
- FIGURE 23. GERMANY HYBRID CAPACITOR MARKET, 2022-2032 ($MILLION)
- FIGURE 24. UK HYBRID CAPACITOR MARKET, 2022-2032 ($MILLION)
- FIGURE 25. FRANCE HYBRID CAPACITOR MARKET, 2022-2032 ($MILLION)
- FIGURE 26. SPAIN HYBRID CAPACITOR MARKET, 2022-2032 ($MILLION)
- FIGURE 27. ITALY HYBRID CAPACITOR MARKET, 2022-2032 ($MILLION)
- FIGURE 28. REST OF EUROPE HYBRID CAPACITOR MARKET, 2022-2032 ($MILLION)
- FIGURE 29. CHINA HYBRID CAPACITOR MARKET, 2022-2032 ($MILLION)
- FIGURE 30. JAPAN HYBRID CAPACITOR MARKET, 2022-2032 ($MILLION)
- FIGURE 31. INDIA HYBRID CAPACITOR MARKET, 2022-2032 ($MILLION)
- FIGURE 32. SOUTH KOREA HYBRID CAPACITOR MARKET, 2022-2032 ($MILLION)
- FIGURE 33. REST OF ASIA-PACIFIC HYBRID CAPACITOR MARKET, 2022-2032 ($MILLION)
- FIGURE 34. BOLIVIA HYBRID CAPACITOR MARKET, 2022-2032 ($MILLION)
- FIGURE 35. ARGENTINA HYBRID CAPACITOR MARKET, 2022-2032 ($MILLION)
- FIGURE 36. REST OF LATIN AMERICA HYBRID CAPACITOR MARKET, 2022-2032 ($MILLION)
- FIGURE 37. SAUDI ARABIA HYBRID CAPACITOR MARKET, 2022-2032 ($MILLION)
- FIGURE 38. AFRICA HYBRID CAPACITOR MARKET, 2022-2032 ($MILLION)
- FIGURE 39. REST OF MIDDLE EAST AND AFRICA HYBRID CAPACITOR MARKET, 2022-2032 ($MILLION)
- FIGURE 40. TOP WINNING STRATEGIES, BY YEAR
- FIGURE 41. TOP WINNING STRATEGIES, BY DEVELOPMENT
- FIGURE 42. TOP WINNING STRATEGIES, BY COMPANY
- FIGURE 43. PRODUCT MAPPING OF TOP 10 PLAYERS
- FIGURE 44. COMPETITIVE DASHBOARD
- FIGURE 45. COMPETITIVE HEATMAP: HYBRID CAPACITOR MARKET
- FIGURE 46. TOP PLAYER POSITIONING, 2022


