


 |
市场调查报告书
商品编码
1472323
纸托盘市场:按类型、负载容量、最终用户划分:2023-2032 年全球机会分析与产业预测Paper Pallet Market By Type, By Load Capacity, By End User : Global Opportunity Analysis and Industry Forecast, 2023-2032 |
||||||
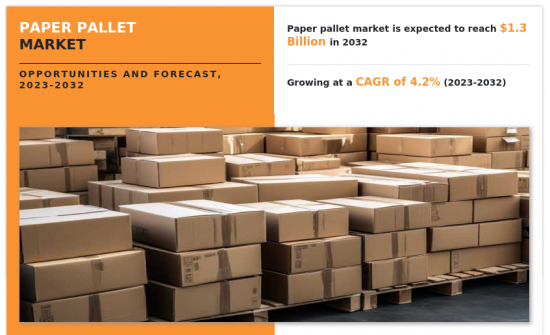
2022年纸托盘市场规模为8.682亿美元,预计2023年至2032年复合年增长率为4.2%,2032年达到12.909亿美元。
纸托盘是一种主要由纸基材料製成的托盘,被设计为传统木栈板或塑胶托盘的多功能且环保的替代品。纸托盘由各种形式的纸张製成,例如纸板或再生纸纤维,与黏剂和有时额外的加固相结合。纸托盘分为瓦楞板、蜂巢纸板、再生纸纤维。这些托盘用于运输、物流和零售,符合国际运输标准,同时为各种负载容量提供轻质且坚固的解决方案。
供应链效率的提升是纸托盘市场需求扩大的主要因素。纸托盘重量轻,易于搬运、装卸,有助于简化供应链。它比木材、塑胶等传统托盘材料重量更轻,这直接导致节省燃料并提高运输效率。企业越来越意识到供应链效率对整体营运成本的影响,而纸托盘的采用可以透过提供符合目标的经济高效且物流友好的解决方案来帮助实现这一策略。
此外,使用纸托盘带来的效率提升也延伸到了供应链的其他方面,例如储存和仓储。纸托盘凭藉其轻量化和标准化的设计,可以有效利用储存空间,有助于仓库组织和改善库存管理。这对于处理大量高速移动货物的行业尤其重要,优化储存和运输流程直接影响业务的整体生产力,并有助于纸托盘市场的成长。
通常认为纸托盘比塑胶或金属托盘等替代品更具成本效益。它们面临成本竞争的挑战,特别是与木栈板等广泛使用的材料相比。营运商认为纸托盘不太耐用,承载能力能力的担忧影响了其感知价值,并阻止营运商选择更传统、经过验证的材料。此外,与过渡到纸托盘相关的初始投资和营运成本(包括维修现有系统的可能性)限制了更广泛的市场采用。优先考虑托盘解决方案的长期耐用性和弹性的行业可能不会意识到纸托盘的成本竞争。此外,托盘使用条件要求较高的领域,如製造、建设业和重工业,需要频繁更换,这可能会限制纸托盘市场的成长。
致力于提高纸托盘的强度、耐用性和弹性的持续研究和开发努力,有助于其在各个行业中得到更广泛的接受。材料成分和製造流程的创新催生了高性能纸托盘,可以满足重型应用的需求,其应用范围超出了重量较轻和活动较少的环境。这使得纸托盘製造商能够将其产品定位为传统托盘材料的可靠且耐用的替代品,从而进入优先考虑永续性和耐用包装解决方案的行业。此外,材料技术的进步使得能够创建专门的纸托盘来满足特定行业的需求,从而为纸托盘市场创造成长机会。
纸托盘市场按类型、负载容量、最终用户和地区细分。按类型划分,市场分为纸板托盘、纸板托盘和蜂巢式托盘。以负载容量划分,市场分为1吨以下、1-2吨、2吨以上。依最终用户划分,产品分为运输/物流、食品和饮料、药品和个人护理/化妆品。依地区划分,北美(美国、加拿大、墨西哥)、欧洲(法国、德国、英国、义大利、西班牙、俄罗斯、其他欧洲地区)、亚太地区(中国、日本、印度、澳洲、韩国、东协、欧洲其他地区)、亚太地区)、中东美洲(巴西、阿根廷、哥伦比亚等拉丁美洲地区)、东亚非洲(非洲、韩国、沙乌地阿拉伯、阿联酋等拉丁美洲地区) 。
相关人员的主要利益
- 本报告定量分析了 2022 年至 2032 年纸托盘市场分析的细分市场、当前趋势、估计/趋势和动态,并确定了纸托盘市场的强大机会。
- 它提供市场研究以及与市场驱动因素、市场限制和市场机会相关的资讯。
- 波特的五力分析强调买家和供应商帮助相关人员做出利润驱动的商业决策并加强供应商-买家网路的潜力。
- 对纸托盘市场细分的详细分析有助于识别市场机会。
- 每个地区的主要国家都根据其对全球市场的收益贡献绘製了地图。
- 市场参与企业定位有助于进行基准比较,并提供对市场参与企业当前地位的清晰了解。
- 该报告包括对区域和全球纸托盘市场趋势、主要企业、细分市场、应用细分和市场成长策略的分析。
可使用此报告进行客製化(需要额外费用和时间表)
- 产品基准/产品规格及应用
- 新产品开发/主要企业产品矩阵
- 根据客户兴趣加入公司简介
- 扩大公司简介列表
- 主要参与企业的详细资料(Excel格式,包括位置、联络资讯、供应商/供应商网路等)
- 全球/区域/国家层级参与企业的市场占有率分析
- SWOT分析
目录
第一章简介
第 2 章执行摘要
第三章市场概况
- 市场定义和范围
- 主要发现
- 影响因素
- 关键投资机会
- 波特五力分析
- 市场动态
- 促进因素
- 抑制因素
- 机会
第四章纸托盘市场:依类型
- 概述
- 纸板托盘
- 纸板托盘
- 蜂巢托盘
第五章纸托盘市场:依负载容量分类
- 概述
- 1吨以下
- 1-2吨
- 2吨以上
第六章纸托盘市场:依最终用户分类
- 概述
- 运输和物流
- 饮食
- 药品
- 个人护理和化妆品
第七章纸托盘市场:按地区
- 概述
- 北美洲
- 美国
- 加拿大
- 墨西哥
- 欧洲
- 德国
- 法国
- 英国
- 义大利
- 西班牙
- 其他的
- 亚太地区
- 中国
- 日本
- 印度
- 韩国
- 澳洲
- 其他的
- 拉丁美洲
- 巴西
- 阿根廷
- 哥伦比亚
- 其他拉丁美洲
- 中东/非洲
- 南非
- 沙乌地阿拉伯
- 阿拉伯聯合大公国
- 其他中东/非洲
第八章 竞争格局
- 介绍
- 关键成功策略
- 10家主要企业产品图谱
- 竞争对手仪表板
- 竞争热图
- 2022年主要企业定位
第九章 公司简介
- Conitex Sonoco
- DS Smith Plc
- Kimmo(Pty)Ltd.
- KraftPal Technologies Ltd.
- Interpak Industries Pte. Ltd.
- Oji Holdings Corporation
- Mondi Group
- The Alternative Pallet Company Ltd.
- The Corrugated Pallet Company
- Smurfit Kappa Group
The paper pallet market size was valued at $868.2 million in 2022 and is projected to reach $1,290.9 million by 2032, growing at a CAGR of 4.2% from 2023 to 2032.
Paper pallet is a type of pallet made primarily from paper-based materials, designed to serve as a versatile and environmentally friendly alternative for traditional wooden or plastic pallets. Paper pallets are constructed using various forms of paper, such as corrugated cardboard or recycled paper fibers, combined with adhesives and sometimes additional strengthening materials. Paper pallets are categorized in corrugated cardboard sheets, honeycomb paperboard, and recycled paper fibers. These pallets are used in shipping, logistics, and retailing, meeting international standards for transportation while providing a lightweight and powerful solution for various load capacities.
Enhanced supply chain efficiency is a significant driver behind the growing market demand for paper pallets. Paper pallets contribute to a streamlined supply chain due to their lightweight nature, which facilitates easier handling, loading, and unloading of goods. The reduction in weight compared to traditional pallet materials, such as wood or plastic, translates directly to fuel savings and improved transportation efficiency. Businesses are increasingly recognizing the impact of supply chain efficiency on their overall operational costs, and the adoption of paper pallets aligns with this strategic goal by offering a cost-effective and logistics-friendly solution.
Furthermore, the efficiency gains from using paper pallets extend to other aspects of the supply chain, including storage and warehousing. The lightweight and standardized design of paper pallets enables efficient use of storage space which contributes to better warehouse organization and inventory management. This becomes particularly crucial in industries with high-volume, fast-moving goods, where optimizing storage and transportation processes directly impacts overall operational productivity and helps in the growth of paper pallet market.
Paper pallets are generally considered cost-effective compared to certain alternatives, such as plastic or metal pallets. They face challenges in terms of cost competitiveness, especially when compared to widely established materials like wooden pallets. The perception of paper pallets as a less durable option among the business companies and concerns about their load-bearing capacity impact the perceived value and discourage businesses to opt for more traditional and proven materials. Moreover, the initial investment and operational costs linked with transitioning to paper pallets, including potential retrofitting of existing systems limit broader market adoption. Industries which prioritize long-term durability and resilience in their pallet solutions may view the cost competitiveness of paper pallets less favorably. Furthermore, businesses in sectors such as manufacturing, construction, or heavy industry, where pallets are demanding conditions, may find frequent replacements and limit the growth of paper pallet market.
Ongoing research and development efforts focused on enhancing the strength, durability, and resilience of paper pallets contribute to their broader acceptance across various industries. Innovations in material composition and manufacturing processes lead to the creation of high-performance paper pallets capable of meeting the demands of heavy-duty applications, expanding their usage beyond lighter and less active environments. This opens opportunities for paper pallet manufacturers to position their products as reliable and durable alternatives to traditional pallet materials, tapping into industries which prioritize both sustainability and durable packaging solutions. Furthermore, advancements in material technology allow for the creation of specialized paper pallets designed to cater to specific industry needs and presents growth opportunities for paper pallet market.
The paper pallet market is segmented into type, load capacity, end user, and region. By type, the market is classified into corrugated pallets, cardboard pallets, and honeycomb pallets. As per load capacity, the market is classified into up to 1 ton, 1-2 tons, and above 2 tons. By end user, the market is classified into shipping & logistics, food & beverages, pharmaceuticals, and personal care & cosmetics. Region-wise, the market is analyzed across North America (the U.S., Canada, and Mexico), Europe (France, Germany, the UK, Italy, Spain, Russia, and the Rest of Europe), Asia-Pacific (China, Japan, India, Australia, South Korea, ASEAN, and the rest of Asia-Pacific), and Latin America (Brazil, Argentina, Colombia and Rest of Latin America), and Middle East & Africa (South Africa, Saudi Arabia, UAE and Rest of MEA).
Players operating in the global paper pallet market have adopted various developmental strategies to expand their paper pallet market share, increase profitability, and remain competitive in the market. Key players profiled in this report include Conitex Sonoco, DS Smith Plc, Kimmo (Pty) Ltd., Kraft Pal Technologies Ltd., Interpak Industries Pte. Ltd., Oji Holdings Corporation, Mondi Group, The Alternative Pallet Company Ltd., The Corrugated Pallet Company, and Smurfit Kappa Group.
Key Benefits For Stakeholders
- This report provides a quantitative analysis of the market segments, current trends, estimations, and dynamics of the paper pallet market analysis from 2022 to 2032 to identify the prevailing paper pallet market opportunities.
- The market research is offered along with information related to key drivers, restraints, and opportunities.
- Porter's five forces analysis highlights the potency of buyers and suppliers to enable stakeholders make profit-oriented business decisions and strengthen their supplier-buyer network.
- In-depth analysis of the paper pallet market segmentation assists to determine the prevailing market opportunities.
- Major countries in each region are mapped according to their revenue contribution to the global market.
- Market player positioning facilitates benchmarking and provides a clear understanding of the present position of the market players.
- The report includes the analysis of the regional as well as global paper pallet market trends, key players, market segments, application areas, and market growth strategies.
Additional benefits you will get with this purchase are:
- Quarterly Update and* (only available with a corporate license, on listed price)
- 5 additional Company Profile of client Choice pre- or Post-purchase, as a free update.
- Free Upcoming Version on the Purchase of Five and Enterprise User License.
- 16 analyst hours of support* (post-purchase, if you find additional data requirements upon review of the report, you may receive support amounting to 16 analyst hours to solve questions, and post-sale queries)
- 15% Free Customization* (in case the scope or segment of the report does not match your requirements, 15% is equivalent to 3 working days of free work, applicable once)
- Free data Pack on the Five and Enterprise User License. (Excel version of the report)
- Free Updated report if the report is 6-12 months old or older.
- 24-hour priority response*
- Free Industry updates and white papers.
Possible Customization with this report (with additional cost and timeline, please talk to the sales executive to know more)
- Product Benchmarking / Product specification and applications
- New Product Development/ Product Matrix of Key Players
- Additional company profiles with specific to client's interest
- Expanded list for Company Profiles
- Key player details (including location, contact details, supplier/vendor network etc. in excel format)
- Market share analysis of players at global/region/country level
- SWOT Analysis
Key Market Segments
By Type
- Corrugated pallets
- Cardboard pallets
- Honeycomb pallets
By Load Capacity
- Up to 1 ton
- 1-2 tons
- Above 2 tons
By End User
- Shipping and logistics
- Food and beverages
- Pharmaceuticals
- Personal care and cosmetics
By Region
- North America
- U.S.
- Canada
- Mexico
- Europe
- Germany
- France
- UK
- Italy
- Spain
- Rest of Europe
- Asia-Pacific
- China
- Japan
- India
- South Korea
- Australia
- Rest of Asia-Pacific
- Latin America
- Brazil
- Argentina
- Colombia
- Rest of Latin America
- Middle East and Africa
- South Africa
- Saudi Arabia
- UAE
- Rest of Middle East And Africa
Key Market Players:
- Conitex Sonoco
- DS Smith Plc
- Kimmo (Pty) Ltd.
- KraftPal Technologies Ltd.
- Interpak Industries Pte. Ltd.
- Oji Holdings Corporation
- Mondi Group
- The Alternative Pallet Company Ltd.
- The Corrugated Pallet Company
- Smurfit Kappa Group
TABLE OF CONTENTS
CHAPTER 1: INTRODUCTION
- 1.1. Report description
- 1.2. Key market segments
- 1.3. Key benefits to the stakeholders
- 1.4. Research methodology
- 1.4.1. Primary research
- 1.4.2. Secondary research
- 1.4.3. Analyst tools and models
CHAPTER 2: EXECUTIVE SUMMARY
- 2.1. CXO perspective
CHAPTER 3: MARKET OVERVIEW
- 3.1. Market definition and scope
- 3.2. Key findings
- 3.2.1. Top impacting factors
- 3.2.2. Top investment pockets
- 3.3. Porter's five forces analysis
- 3.4. Market dynamics
- 3.4.1. Drivers
- 3.4.2. Restraints
- 3.4.3. Opportunities
CHAPTER 4: PAPER PALLET MARKET, BY TYPE
- 4.1. Overview
- 4.1.1. Market size and forecast
- 4.2. Corrugated pallets
- 4.2.1. Key market trends, growth factors and opportunities
- 4.2.2. Market size and forecast, by region
- 4.2.3. Market share analysis by country
- 4.3. Cardboard pallets
- 4.3.1. Key market trends, growth factors and opportunities
- 4.3.2. Market size and forecast, by region
- 4.3.3. Market share analysis by country
- 4.4. Honeycomb pallets
- 4.4.1. Key market trends, growth factors and opportunities
- 4.4.2. Market size and forecast, by region
- 4.4.3. Market share analysis by country
CHAPTER 5: PAPER PALLET MARKET, BY LOAD CAPACITY
- 5.1. Overview
- 5.1.1. Market size and forecast
- 5.2. Up to 1 ton
- 5.2.1. Key market trends, growth factors and opportunities
- 5.2.2. Market size and forecast, by region
- 5.2.3. Market share analysis by country
- 5.3. 1-2 tons
- 5.3.1. Key market trends, growth factors and opportunities
- 5.3.2. Market size and forecast, by region
- 5.3.3. Market share analysis by country
- 5.4. Above 2 tons
- 5.4.1. Key market trends, growth factors and opportunities
- 5.4.2. Market size and forecast, by region
- 5.4.3. Market share analysis by country
CHAPTER 6: PAPER PALLET MARKET, BY END USER
- 6.1. Overview
- 6.1.1. Market size and forecast
- 6.2. Shipping and logistics
- 6.2.1. Key market trends, growth factors and opportunities
- 6.2.2. Market size and forecast, by region
- 6.2.3. Market share analysis by country
- 6.3. Food and beverages
- 6.3.1. Key market trends, growth factors and opportunities
- 6.3.2. Market size and forecast, by region
- 6.3.3. Market share analysis by country
- 6.4. Pharmaceuticals
- 6.4.1. Key market trends, growth factors and opportunities
- 6.4.2. Market size and forecast, by region
- 6.4.3. Market share analysis by country
- 6.5. Personal care and cosmetics
- 6.5.1. Key market trends, growth factors and opportunities
- 6.5.2. Market size and forecast, by region
- 6.5.3. Market share analysis by country
CHAPTER 7: PAPER PALLET MARKET, BY REGION
- 7.1. Overview
- 7.1.1. Market size and forecast By Region
- 7.2. North America
- 7.2.1. Key market trends, growth factors and opportunities
- 7.2.2. Market size and forecast, by Type
- 7.2.3. Market size and forecast, by Load Capacity
- 7.2.4. Market size and forecast, by End User
- 7.2.5. Market size and forecast, by country
- 7.2.5.1. U.S.
- 7.2.5.1.1. Market size and forecast, by Type
- 7.2.5.1.2. Market size and forecast, by Load Capacity
- 7.2.5.1.3. Market size and forecast, by End User
- 7.2.5.2. Canada
- 7.2.5.2.1. Market size and forecast, by Type
- 7.2.5.2.2. Market size and forecast, by Load Capacity
- 7.2.5.2.3. Market size and forecast, by End User
- 7.2.5.3. Mexico
- 7.2.5.3.1. Market size and forecast, by Type
- 7.2.5.3.2. Market size and forecast, by Load Capacity
- 7.2.5.3.3. Market size and forecast, by End User
- 7.3. Europe
- 7.3.1. Key market trends, growth factors and opportunities
- 7.3.2. Market size and forecast, by Type
- 7.3.3. Market size and forecast, by Load Capacity
- 7.3.4. Market size and forecast, by End User
- 7.3.5. Market size and forecast, by country
- 7.3.5.1. Germany
- 7.3.5.1.1. Market size and forecast, by Type
- 7.3.5.1.2. Market size and forecast, by Load Capacity
- 7.3.5.1.3. Market size and forecast, by End User
- 7.3.5.2. France
- 7.3.5.2.1. Market size and forecast, by Type
- 7.3.5.2.2. Market size and forecast, by Load Capacity
- 7.3.5.2.3. Market size and forecast, by End User
- 7.3.5.3. UK
- 7.3.5.3.1. Market size and forecast, by Type
- 7.3.5.3.2. Market size and forecast, by Load Capacity
- 7.3.5.3.3. Market size and forecast, by End User
- 7.3.5.4. Italy
- 7.3.5.4.1. Market size and forecast, by Type
- 7.3.5.4.2. Market size and forecast, by Load Capacity
- 7.3.5.4.3. Market size and forecast, by End User
- 7.3.5.5. Spain
- 7.3.5.5.1. Market size and forecast, by Type
- 7.3.5.5.2. Market size and forecast, by Load Capacity
- 7.3.5.5.3. Market size and forecast, by End User
- 7.3.5.6. Rest of Europe
- 7.3.5.6.1. Market size and forecast, by Type
- 7.3.5.6.2. Market size and forecast, by Load Capacity
- 7.3.5.6.3. Market size and forecast, by End User
- 7.4. Asia-Pacific
- 7.4.1. Key market trends, growth factors and opportunities
- 7.4.2. Market size and forecast, by Type
- 7.4.3. Market size and forecast, by Load Capacity
- 7.4.4. Market size and forecast, by End User
- 7.4.5. Market size and forecast, by country
- 7.4.5.1. China
- 7.4.5.1.1. Market size and forecast, by Type
- 7.4.5.1.2. Market size and forecast, by Load Capacity
- 7.4.5.1.3. Market size and forecast, by End User
- 7.4.5.2. Japan
- 7.4.5.2.1. Market size and forecast, by Type
- 7.4.5.2.2. Market size and forecast, by Load Capacity
- 7.4.5.2.3. Market size and forecast, by End User
- 7.4.5.3. India
- 7.4.5.3.1. Market size and forecast, by Type
- 7.4.5.3.2. Market size and forecast, by Load Capacity
- 7.4.5.3.3. Market size and forecast, by End User
- 7.4.5.4. South Korea
- 7.4.5.4.1. Market size and forecast, by Type
- 7.4.5.4.2. Market size and forecast, by Load Capacity
- 7.4.5.4.3. Market size and forecast, by End User
- 7.4.5.5. Australia
- 7.4.5.5.1. Market size and forecast, by Type
- 7.4.5.5.2. Market size and forecast, by Load Capacity
- 7.4.5.5.3. Market size and forecast, by End User
- 7.4.5.6. Rest of Asia-Pacific
- 7.4.5.6.1. Market size and forecast, by Type
- 7.4.5.6.2. Market size and forecast, by Load Capacity
- 7.4.5.6.3. Market size and forecast, by End User
- 7.5. Latin America
- 7.5.1. Key market trends, growth factors and opportunities
- 7.5.2. Market size and forecast, by Type
- 7.5.3. Market size and forecast, by Load Capacity
- 7.5.4. Market size and forecast, by End User
- 7.5.5. Market size and forecast, by country
- 7.5.5.1. Brazil
- 7.5.5.1.1. Market size and forecast, by Type
- 7.5.5.1.2. Market size and forecast, by Load Capacity
- 7.5.5.1.3. Market size and forecast, by End User
- 7.5.5.2. Argentina
- 7.5.5.2.1. Market size and forecast, by Type
- 7.5.5.2.2. Market size and forecast, by Load Capacity
- 7.5.5.2.3. Market size and forecast, by End User
- 7.5.5.3. Colombia
- 7.5.5.3.1. Market size and forecast, by Type
- 7.5.5.3.2. Market size and forecast, by Load Capacity
- 7.5.5.3.3. Market size and forecast, by End User
- 7.5.5.4. Rest of Latin America
- 7.5.5.4.1. Market size and forecast, by Type
- 7.5.5.4.2. Market size and forecast, by Load Capacity
- 7.5.5.4.3. Market size and forecast, by End User
- 7.6. Middle East and Africa
- 7.6.1. Key market trends, growth factors and opportunities
- 7.6.2. Market size and forecast, by Type
- 7.6.3. Market size and forecast, by Load Capacity
- 7.6.4. Market size and forecast, by End User
- 7.6.5. Market size and forecast, by country
- 7.6.5.1. South Africa
- 7.6.5.1.1. Market size and forecast, by Type
- 7.6.5.1.2. Market size and forecast, by Load Capacity
- 7.6.5.1.3. Market size and forecast, by End User
- 7.6.5.2. Saudi Arabia
- 7.6.5.2.1. Market size and forecast, by Type
- 7.6.5.2.2. Market size and forecast, by Load Capacity
- 7.6.5.2.3. Market size and forecast, by End User
- 7.6.5.3. UAE
- 7.6.5.3.1. Market size and forecast, by Type
- 7.6.5.3.2. Market size and forecast, by Load Capacity
- 7.6.5.3.3. Market size and forecast, by End User
- 7.6.5.4. Rest of Middle East And Africa
- 7.6.5.4.1. Market size and forecast, by Type
- 7.6.5.4.2. Market size and forecast, by Load Capacity
- 7.6.5.4.3. Market size and forecast, by End User
CHAPTER 8: COMPETITIVE LANDSCAPE
- 8.1. Introduction
- 8.2. Top winning strategies
- 8.3. Product mapping of top 10 player
- 8.4. Competitive dashboard
- 8.5. Competitive heatmap
- 8.6. Top player positioning, 2022
CHAPTER 9: COMPANY PROFILES
- 9.1. Conitex Sonoco
- 9.1.1. Company overview
- 9.1.2. Key executives
- 9.1.3. Company snapshot
- 9.1.4. Operating business segments
- 9.1.5. Product portfolio
- 9.1.6. Business performance
- 9.1.7. Key strategic moves and developments
- 9.2. DS Smith Plc
- 9.2.1. Company overview
- 9.2.2. Key executives
- 9.2.3. Company snapshot
- 9.2.4. Operating business segments
- 9.2.5. Product portfolio
- 9.2.6. Business performance
- 9.2.7. Key strategic moves and developments
- 9.3. Kimmo (Pty) Ltd.
- 9.3.1. Company overview
- 9.3.2. Key executives
- 9.3.3. Company snapshot
- 9.3.4. Operating business segments
- 9.3.5. Product portfolio
- 9.3.6. Business performance
- 9.3.7. Key strategic moves and developments
- 9.4. KraftPal Technologies Ltd.
- 9.4.1. Company overview
- 9.4.2. Key executives
- 9.4.3. Company snapshot
- 9.4.4. Operating business segments
- 9.4.5. Product portfolio
- 9.4.6. Business performance
- 9.4.7. Key strategic moves and developments
- 9.5. Interpak Industries Pte. Ltd.
- 9.5.1. Company overview
- 9.5.2. Key executives
- 9.5.3. Company snapshot
- 9.5.4. Operating business segments
- 9.5.5. Product portfolio
- 9.5.6. Business performance
- 9.5.7. Key strategic moves and developments
- 9.6. Oji Holdings Corporation
- 9.6.1. Company overview
- 9.6.2. Key executives
- 9.6.3. Company snapshot
- 9.6.4. Operating business segments
- 9.6.5. Product portfolio
- 9.6.6. Business performance
- 9.6.7. Key strategic moves and developments
- 9.7. Mondi Group
- 9.7.1. Company overview
- 9.7.2. Key executives
- 9.7.3. Company snapshot
- 9.7.4. Operating business segments
- 9.7.5. Product portfolio
- 9.7.6. Business performance
- 9.7.7. Key strategic moves and developments
- 9.8. The Alternative Pallet Company Ltd.
- 9.8.1. Company overview
- 9.8.2. Key executives
- 9.8.3. Company snapshot
- 9.8.4. Operating business segments
- 9.8.5. Product portfolio
- 9.8.6. Business performance
- 9.8.7. Key strategic moves and developments
- 9.9. The Corrugated Pallet Company
- 9.9.1. Company overview
- 9.9.2. Key executives
- 9.9.3. Company snapshot
- 9.9.4. Operating business segments
- 9.9.5. Product portfolio
- 9.9.6. Business performance
- 9.9.7. Key strategic moves and developments
- 9.10. Smurfit Kappa Group
- 9.10.1. Company overview
- 9.10.2. Key executives
- 9.10.3. Company snapshot
- 9.10.4. Operating business segments
- 9.10.5. Product portfolio
- 9.10.6. Business performance
- 9.10.7. Key strategic moves and developments
LIST OF TABLES
- TABLE 01. GLOBAL PAPER PALLET MARKET, BY TYPE, 2022-2032 ($MILLION)
- TABLE 02. PAPER PALLET MARKET FOR CORRUGATED PALLETS , BY REGION, 2022-2032 ($MILLION)
- TABLE 03. PAPER PALLET MARKET FOR CARDBOARD PALLETS, BY REGION, 2022-2032 ($MILLION)
- TABLE 04. PAPER PALLET MARKET FOR HONEYCOMB PALLETS, BY REGION, 2022-2032 ($MILLION)
- TABLE 05. GLOBAL PAPER PALLET MARKET, BY LOAD CAPACITY, 2022-2032 ($MILLION)
- TABLE 06. PAPER PALLET MARKET FOR UP TO 1 TON, BY REGION, 2022-2032 ($MILLION)
- TABLE 07. PAPER PALLET MARKET FOR 1-2 TONS, BY REGION, 2022-2032 ($MILLION)
- TABLE 08. PAPER PALLET MARKET FOR ABOVE 2 TONS, BY REGION, 2022-2032 ($MILLION)
- TABLE 09. GLOBAL PAPER PALLET MARKET, BY END USER, 2022-2032 ($MILLION)
- TABLE 10. PAPER PALLET MARKET FOR SHIPPING AND LOGISTICS, BY REGION, 2022-2032 ($MILLION)
- TABLE 11. PAPER PALLET MARKET FOR FOOD AND BEVERAGES, BY REGION, 2022-2032 ($MILLION)
- TABLE 12. PAPER PALLET MARKET FOR PHARMACEUTICALS, BY REGION, 2022-2032 ($MILLION)
- TABLE 13. PAPER PALLET MARKET FOR PERSONAL CARE AND COSMETICS, BY REGION, 2022-2032 ($MILLION)
- TABLE 14. PAPER PALLET MARKET, BY REGION, 2022-2032 ($MILLION)
- TABLE 15. NORTH AMERICA PAPER PALLET MARKET, BY TYPE, 2022-2032 ($MILLION)
- TABLE 16. NORTH AMERICA PAPER PALLET MARKET, BY LOAD CAPACITY, 2022-2032 ($MILLION)
- TABLE 17. NORTH AMERICA PAPER PALLET MARKET, BY END USER, 2022-2032 ($MILLION)
- TABLE 18. NORTH AMERICA PAPER PALLET MARKET, BY COUNTRY, 2022-2032 ($MILLION)
- TABLE 19. U.S. PAPER PALLET MARKET, BY TYPE, 2022-2032 ($MILLION)
- TABLE 20. U.S. PAPER PALLET MARKET, BY LOAD CAPACITY, 2022-2032 ($MILLION)
- TABLE 21. U.S. PAPER PALLET MARKET, BY END USER, 2022-2032 ($MILLION)
- TABLE 22. CANADA PAPER PALLET MARKET, BY TYPE, 2022-2032 ($MILLION)
- TABLE 23. CANADA PAPER PALLET MARKET, BY LOAD CAPACITY, 2022-2032 ($MILLION)
- TABLE 24. CANADA PAPER PALLET MARKET, BY END USER, 2022-2032 ($MILLION)
- TABLE 25. MEXICO PAPER PALLET MARKET, BY TYPE, 2022-2032 ($MILLION)
- TABLE 26. MEXICO PAPER PALLET MARKET, BY LOAD CAPACITY, 2022-2032 ($MILLION)
- TABLE 27. MEXICO PAPER PALLET MARKET, BY END USER, 2022-2032 ($MILLION)
- TABLE 28. EUROPE PAPER PALLET MARKET, BY TYPE, 2022-2032 ($MILLION)
- TABLE 29. EUROPE PAPER PALLET MARKET, BY LOAD CAPACITY, 2022-2032 ($MILLION)
- TABLE 30. EUROPE PAPER PALLET MARKET, BY END USER, 2022-2032 ($MILLION)
- TABLE 31. EUROPE PAPER PALLET MARKET, BY COUNTRY, 2022-2032 ($MILLION)
- TABLE 32. GERMANY PAPER PALLET MARKET, BY TYPE, 2022-2032 ($MILLION)
- TABLE 33. GERMANY PAPER PALLET MARKET, BY LOAD CAPACITY, 2022-2032 ($MILLION)
- TABLE 34. GERMANY PAPER PALLET MARKET, BY END USER, 2022-2032 ($MILLION)
- TABLE 35. FRANCE PAPER PALLET MARKET, BY TYPE, 2022-2032 ($MILLION)
- TABLE 36. FRANCE PAPER PALLET MARKET, BY LOAD CAPACITY, 2022-2032 ($MILLION)
- TABLE 37. FRANCE PAPER PALLET MARKET, BY END USER, 2022-2032 ($MILLION)
- TABLE 38. UK PAPER PALLET MARKET, BY TYPE, 2022-2032 ($MILLION)
- TABLE 39. UK PAPER PALLET MARKET, BY LOAD CAPACITY, 2022-2032 ($MILLION)
- TABLE 40. UK PAPER PALLET MARKET, BY END USER, 2022-2032 ($MILLION)
- TABLE 41. ITALY PAPER PALLET MARKET, BY TYPE, 2022-2032 ($MILLION)
- TABLE 42. ITALY PAPER PALLET MARKET, BY LOAD CAPACITY, 2022-2032 ($MILLION)
- TABLE 43. ITALY PAPER PALLET MARKET, BY END USER, 2022-2032 ($MILLION)
- TABLE 44. SPAIN PAPER PALLET MARKET, BY TYPE, 2022-2032 ($MILLION)
- TABLE 45. SPAIN PAPER PALLET MARKET, BY LOAD CAPACITY, 2022-2032 ($MILLION)
- TABLE 46. SPAIN PAPER PALLET MARKET, BY END USER, 2022-2032 ($MILLION)
- TABLE 47. REST OF EUROPE PAPER PALLET MARKET, BY TYPE, 2022-2032 ($MILLION)
- TABLE 48. REST OF EUROPE PAPER PALLET MARKET, BY LOAD CAPACITY, 2022-2032 ($MILLION)
- TABLE 49. REST OF EUROPE PAPER PALLET MARKET, BY END USER, 2022-2032 ($MILLION)
- TABLE 50. ASIA-PACIFIC PAPER PALLET MARKET, BY TYPE, 2022-2032 ($MILLION)
- TABLE 51. ASIA-PACIFIC PAPER PALLET MARKET, BY LOAD CAPACITY, 2022-2032 ($MILLION)
- TABLE 52. ASIA-PACIFIC PAPER PALLET MARKET, BY END USER, 2022-2032 ($MILLION)
- TABLE 53. ASIA-PACIFIC PAPER PALLET MARKET, BY COUNTRY, 2022-2032 ($MILLION)
- TABLE 54. CHINA PAPER PALLET MARKET, BY TYPE, 2022-2032 ($MILLION)
- TABLE 55. CHINA PAPER PALLET MARKET, BY LOAD CAPACITY, 2022-2032 ($MILLION)
- TABLE 56. CHINA PAPER PALLET MARKET, BY END USER, 2022-2032 ($MILLION)
- TABLE 57. JAPAN PAPER PALLET MARKET, BY TYPE, 2022-2032 ($MILLION)
- TABLE 58. JAPAN PAPER PALLET MARKET, BY LOAD CAPACITY, 2022-2032 ($MILLION)
- TABLE 59. JAPAN PAPER PALLET MARKET, BY END USER, 2022-2032 ($MILLION)
- TABLE 60. INDIA PAPER PALLET MARKET, BY TYPE, 2022-2032 ($MILLION)
- TABLE 61. INDIA PAPER PALLET MARKET, BY LOAD CAPACITY, 2022-2032 ($MILLION)
- TABLE 62. INDIA PAPER PALLET MARKET, BY END USER, 2022-2032 ($MILLION)
- TABLE 63. SOUTH KOREA PAPER PALLET MARKET, BY TYPE, 2022-2032 ($MILLION)
- TABLE 64. SOUTH KOREA PAPER PALLET MARKET, BY LOAD CAPACITY, 2022-2032 ($MILLION)
- TABLE 65. SOUTH KOREA PAPER PALLET MARKET, BY END USER, 2022-2032 ($MILLION)
- TABLE 66. AUSTRALIA PAPER PALLET MARKET, BY TYPE, 2022-2032 ($MILLION)
- TABLE 67. AUSTRALIA PAPER PALLET MARKET, BY LOAD CAPACITY, 2022-2032 ($MILLION)
- TABLE 68. AUSTRALIA PAPER PALLET MARKET, BY END USER, 2022-2032 ($MILLION)
- TABLE 69. REST OF ASIA-PACIFIC PAPER PALLET MARKET, BY TYPE, 2022-2032 ($MILLION)
- TABLE 70. REST OF ASIA-PACIFIC PAPER PALLET MARKET, BY LOAD CAPACITY, 2022-2032 ($MILLION)
- TABLE 71. REST OF ASIA-PACIFIC PAPER PALLET MARKET, BY END USER, 2022-2032 ($MILLION)
- TABLE 72. LATIN AMERICA PAPER PALLET MARKET, BY TYPE, 2022-2032 ($MILLION)
- TABLE 73. LATIN AMERICA PAPER PALLET MARKET, BY LOAD CAPACITY, 2022-2032 ($MILLION)
- TABLE 74. LATIN AMERICA PAPER PALLET MARKET, BY END USER, 2022-2032 ($MILLION)
- TABLE 75. LATIN AMERICA PAPER PALLET MARKET, BY COUNTRY, 2022-2032 ($MILLION)
- TABLE 76. BRAZIL PAPER PALLET MARKET, BY TYPE, 2022-2032 ($MILLION)
- TABLE 77. BRAZIL PAPER PALLET MARKET, BY LOAD CAPACITY, 2022-2032 ($MILLION)
- TABLE 78. BRAZIL PAPER PALLET MARKET, BY END USER, 2022-2032 ($MILLION)
- TABLE 79. ARGENTINA PAPER PALLET MARKET, BY TYPE, 2022-2032 ($MILLION)
- TABLE 80. ARGENTINA PAPER PALLET MARKET, BY LOAD CAPACITY, 2022-2032 ($MILLION)
- TABLE 81. ARGENTINA PAPER PALLET MARKET, BY END USER, 2022-2032 ($MILLION)
- TABLE 82. COLOMBIA PAPER PALLET MARKET, BY TYPE, 2022-2032 ($MILLION)
- TABLE 83. COLOMBIA PAPER PALLET MARKET, BY LOAD CAPACITY, 2022-2032 ($MILLION)
- TABLE 84. COLOMBIA PAPER PALLET MARKET, BY END USER, 2022-2032 ($MILLION)
- TABLE 85. REST OF LATIN AMERICA PAPER PALLET MARKET, BY TYPE, 2022-2032 ($MILLION)
- TABLE 86. REST OF LATIN AMERICA PAPER PALLET MARKET, BY LOAD CAPACITY, 2022-2032 ($MILLION)
- TABLE 87. REST OF LATIN AMERICA PAPER PALLET MARKET, BY END USER, 2022-2032 ($MILLION)
- TABLE 88. MIDDLE EAST AND AFRICA PAPER PALLET MARKET, BY TYPE, 2022-2032 ($MILLION)
- TABLE 89. MIDDLE EAST AND AFRICA PAPER PALLET MARKET, BY LOAD CAPACITY, 2022-2032 ($MILLION)
- TABLE 90. MIDDLE EAST AND AFRICA PAPER PALLET MARKET, BY END USER, 2022-2032 ($MILLION)
- TABLE 91. MIDDLE EAST AND AFRICA PAPER PALLET MARKET, BY COUNTRY, 2022-2032 ($MILLION)
- TABLE 92. SOUTH AFRICA PAPER PALLET MARKET, BY TYPE, 2022-2032 ($MILLION)
- TABLE 93. SOUTH AFRICA PAPER PALLET MARKET, BY LOAD CAPACITY, 2022-2032 ($MILLION)
- TABLE 94. SOUTH AFRICA PAPER PALLET MARKET, BY END USER, 2022-2032 ($MILLION)
- TABLE 95. SAUDI ARABIA PAPER PALLET MARKET, BY TYPE, 2022-2032 ($MILLION)
- TABLE 96. SAUDI ARABIA PAPER PALLET MARKET, BY LOAD CAPACITY, 2022-2032 ($MILLION)
- TABLE 97. SAUDI ARABIA PAPER PALLET MARKET, BY END USER, 2022-2032 ($MILLION)
- TABLE 98. UAE PAPER PALLET MARKET, BY TYPE, 2022-2032 ($MILLION)
- TABLE 99. UAE PAPER PALLET MARKET, BY LOAD CAPACITY, 2022-2032 ($MILLION)
- TABLE 100. UAE PAPER PALLET MARKET, BY END USER, 2022-2032 ($MILLION)
- TABLE 101. REST OF MIDDLE EAST AND AFRICA PAPER PALLET MARKET, BY TYPE, 2022-2032 ($MILLION)
- TABLE 102. REST OF MIDDLE EAST AND AFRICA PAPER PALLET MARKET, BY LOAD CAPACITY, 2022-2032 ($MILLION)
- TABLE 103. REST OF MIDDLE EAST AND AFRICA PAPER PALLET MARKET, BY END USER, 2022-2032 ($MILLION)
- TABLE 104. CONITEX SONOCO: KEY EXECUTIVES
- TABLE 105. CONITEX SONOCO: COMPANY SNAPSHOT
- TABLE 106. CONITEX SONOCO: PRODUCT SEGMENTS
- TABLE 107. CONITEX SONOCO: SERVICE SEGMENTS
- TABLE 108. CONITEX SONOCO: PRODUCT PORTFOLIO
- TABLE 109. CONITEX SONOCO: KEY STRATERGIES
- TABLE 110. DS SMITH PLC: KEY EXECUTIVES
- TABLE 111. DS SMITH PLC: COMPANY SNAPSHOT
- TABLE 112. DS SMITH PLC: PRODUCT SEGMENTS
- TABLE 113. DS SMITH PLC: SERVICE SEGMENTS
- TABLE 114. DS SMITH PLC: PRODUCT PORTFOLIO
- TABLE 115. DS SMITH PLC: KEY STRATERGIES
- TABLE 116. KIMMO (PTY) LTD.: KEY EXECUTIVES
- TABLE 117. KIMMO (PTY) LTD.: COMPANY SNAPSHOT
- TABLE 118. KIMMO (PTY) LTD.: PRODUCT SEGMENTS
- TABLE 119. KIMMO (PTY) LTD.: SERVICE SEGMENTS
- TABLE 120. KIMMO (PTY) LTD.: PRODUCT PORTFOLIO
- TABLE 121. KIMMO (PTY) LTD.: KEY STRATERGIES
- TABLE 122. KRAFTPAL TECHNOLOGIES LTD.: KEY EXECUTIVES
- TABLE 123. KRAFTPAL TECHNOLOGIES LTD.: COMPANY SNAPSHOT
- TABLE 124. KRAFTPAL TECHNOLOGIES LTD.: PRODUCT SEGMENTS
- TABLE 125. KRAFTPAL TECHNOLOGIES LTD.: SERVICE SEGMENTS
- TABLE 126. KRAFTPAL TECHNOLOGIES LTD.: PRODUCT PORTFOLIO
- TABLE 127. KRAFTPAL TECHNOLOGIES LTD.: KEY STRATERGIES
- TABLE 128. INTERPAK INDUSTRIES PTE. LTD.: KEY EXECUTIVES
- TABLE 129. INTERPAK INDUSTRIES PTE. LTD.: COMPANY SNAPSHOT
- TABLE 130. INTERPAK INDUSTRIES PTE. LTD.: PRODUCT SEGMENTS
- TABLE 131. INTERPAK INDUSTRIES PTE. LTD.: SERVICE SEGMENTS
- TABLE 132. INTERPAK INDUSTRIES PTE. LTD.: PRODUCT PORTFOLIO
- TABLE 133. INTERPAK INDUSTRIES PTE. LTD.: KEY STRATERGIES
- TABLE 134. OJI HOLDINGS CORPORATION: KEY EXECUTIVES
- TABLE 135. OJI HOLDINGS CORPORATION: COMPANY SNAPSHOT
- TABLE 136. OJI HOLDINGS CORPORATION: PRODUCT SEGMENTS
- TABLE 137. OJI HOLDINGS CORPORATION: SERVICE SEGMENTS
- TABLE 138. OJI HOLDINGS CORPORATION: PRODUCT PORTFOLIO
- TABLE 139. OJI HOLDINGS CORPORATION: KEY STRATERGIES
- TABLE 140. MONDI GROUP: KEY EXECUTIVES
- TABLE 141. MONDI GROUP: COMPANY SNAPSHOT
- TABLE 142. MONDI GROUP: PRODUCT SEGMENTS
- TABLE 143. MONDI GROUP: SERVICE SEGMENTS
- TABLE 144. MONDI GROUP: PRODUCT PORTFOLIO
- TABLE 145. MONDI GROUP: KEY STRATERGIES
- TABLE 146. THE ALTERNATIVE PALLET COMPANY LTD.: KEY EXECUTIVES
- TABLE 147. THE ALTERNATIVE PALLET COMPANY LTD.: COMPANY SNAPSHOT
- TABLE 148. THE ALTERNATIVE PALLET COMPANY LTD.: PRODUCT SEGMENTS
- TABLE 149. THE ALTERNATIVE PALLET COMPANY LTD.: SERVICE SEGMENTS
- TABLE 150. THE ALTERNATIVE PALLET COMPANY LTD.: PRODUCT PORTFOLIO
- TABLE 151. THE ALTERNATIVE PALLET COMPANY LTD.: KEY STRATERGIES
- TABLE 152. THE CORRUGATED PALLET COMPANY: KEY EXECUTIVES
- TABLE 153. THE CORRUGATED PALLET COMPANY: COMPANY SNAPSHOT
- TABLE 154. THE CORRUGATED PALLET COMPANY: PRODUCT SEGMENTS
- TABLE 155. THE CORRUGATED PALLET COMPANY: SERVICE SEGMENTS
- TABLE 156. THE CORRUGATED PALLET COMPANY: PRODUCT PORTFOLIO
- TABLE 157. THE CORRUGATED PALLET COMPANY: KEY STRATERGIES
- TABLE 158. SMURFIT KAPPA GROUP: KEY EXECUTIVES
- TABLE 159. SMURFIT KAPPA GROUP: COMPANY SNAPSHOT
- TABLE 160. SMURFIT KAPPA GROUP: PRODUCT SEGMENTS
- TABLE 161. SMURFIT KAPPA GROUP: SERVICE SEGMENTS
- TABLE 162. SMURFIT KAPPA GROUP: PRODUCT PORTFOLIO
- TABLE 163. SMURFIT KAPPA GROUP: KEY STRATERGIES
LIST OF FIGURES
- FIGURE 01. PAPER PALLET MARKET, 2022-2032
- FIGURE 02. SEGMENTATION OF PAPER PALLET MARKET,2022-2032
- FIGURE 03. TOP IMPACTING FACTORS IN PAPER PALLET MARKET
- FIGURE 04. TOP INVESTMENT POCKETS IN PAPER PALLET MARKET (2023-2032)
- FIGURE 05. BARGAINING POWER OF SUPPLIERS
- FIGURE 06. BARGAINING POWER OF BUYERS
- FIGURE 07. THREAT OF SUBSTITUTION
- FIGURE 08. THREAT OF SUBSTITUTION
- FIGURE 09. COMPETITIVE RIVALRY
- FIGURE 10. GLOBAL PAPER PALLET MARKET:DRIVERS, RESTRAINTS AND OPPORTUNITIES
- FIGURE 11. PAPER PALLET MARKET, BY TYPE, 2022 AND 2032(%)
- FIGURE 12. COMPARATIVE SHARE ANALYSIS OF PAPER PALLET MARKET FOR CORRUGATED PALLETS , BY COUNTRY 2022 AND 2032(%)
- FIGURE 13. COMPARATIVE SHARE ANALYSIS OF PAPER PALLET MARKET FOR CARDBOARD PALLETS, BY COUNTRY 2022 AND 2032(%)
- FIGURE 14. COMPARATIVE SHARE ANALYSIS OF PAPER PALLET MARKET FOR HONEYCOMB PALLETS, BY COUNTRY 2022 AND 2032(%)
- FIGURE 15. PAPER PALLET MARKET, BY LOAD CAPACITY, 2022 AND 2032(%)
- FIGURE 16. COMPARATIVE SHARE ANALYSIS OF PAPER PALLET MARKET FOR UP TO 1 TON, BY COUNTRY 2022 AND 2032(%)
- FIGURE 17. COMPARATIVE SHARE ANALYSIS OF PAPER PALLET MARKET FOR 1-2 TONS, BY COUNTRY 2022 AND 2032(%)
- FIGURE 18. COMPARATIVE SHARE ANALYSIS OF PAPER PALLET MARKET FOR ABOVE 2 TONS, BY COUNTRY 2022 AND 2032(%)
- FIGURE 19. PAPER PALLET MARKET, BY END USER, 2022 AND 2032(%)
- FIGURE 20. COMPARATIVE SHARE ANALYSIS OF PAPER PALLET MARKET FOR SHIPPING AND LOGISTICS, BY COUNTRY 2022 AND 2032(%)
- FIGURE 21. COMPARATIVE SHARE ANALYSIS OF PAPER PALLET MARKET FOR FOOD AND BEVERAGES, BY COUNTRY 2022 AND 2032(%)
- FIGURE 22. COMPARATIVE SHARE ANALYSIS OF PAPER PALLET MARKET FOR PHARMACEUTICALS, BY COUNTRY 2022 AND 2032(%)
- FIGURE 23. COMPARATIVE SHARE ANALYSIS OF PAPER PALLET MARKET FOR PERSONAL CARE AND COSMETICS, BY COUNTRY 2022 AND 2032(%)
- FIGURE 24. PAPER PALLET MARKET BY REGION, 2022 AND 2032(%)
- FIGURE 25. U.S. PAPER PALLET MARKET, 2022-2032 ($MILLION)
- FIGURE 26. CANADA PAPER PALLET MARKET, 2022-2032 ($MILLION)
- FIGURE 27. MEXICO PAPER PALLET MARKET, 2022-2032 ($MILLION)
- FIGURE 28. GERMANY PAPER PALLET MARKET, 2022-2032 ($MILLION)
- FIGURE 29. FRANCE PAPER PALLET MARKET, 2022-2032 ($MILLION)
- FIGURE 30. UK PAPER PALLET MARKET, 2022-2032 ($MILLION)
- FIGURE 31. ITALY PAPER PALLET MARKET, 2022-2032 ($MILLION)
- FIGURE 32. SPAIN PAPER PALLET MARKET, 2022-2032 ($MILLION)
- FIGURE 33. REST OF EUROPE PAPER PALLET MARKET, 2022-2032 ($MILLION)
- FIGURE 34. CHINA PAPER PALLET MARKET, 2022-2032 ($MILLION)
- FIGURE 35. JAPAN PAPER PALLET MARKET, 2022-2032 ($MILLION)
- FIGURE 36. INDIA PAPER PALLET MARKET, 2022-2032 ($MILLION)
- FIGURE 37. SOUTH KOREA PAPER PALLET MARKET, 2022-2032 ($MILLION)
- FIGURE 38. AUSTRALIA PAPER PALLET MARKET, 2022-2032 ($MILLION)
- FIGURE 39. REST OF ASIA-PACIFIC PAPER PALLET MARKET, 2022-2032 ($MILLION)
- FIGURE 40. BRAZIL PAPER PALLET MARKET, 2022-2032 ($MILLION)
- FIGURE 41. ARGENTINA PAPER PALLET MARKET, 2022-2032 ($MILLION)
- FIGURE 42. COLOMBIA PAPER PALLET MARKET, 2022-2032 ($MILLION)
- FIGURE 43. REST OF LATIN AMERICA PAPER PALLET MARKET, 2022-2032 ($MILLION)
- FIGURE 44. SOUTH AFRICA PAPER PALLET MARKET, 2022-2032 ($MILLION)
- FIGURE 45. SAUDI ARABIA PAPER PALLET MARKET, 2022-2032 ($MILLION)
- FIGURE 46. UAE PAPER PALLET MARKET, 2022-2032 ($MILLION)
- FIGURE 47. REST OF MIDDLE EAST AND AFRICA PAPER PALLET MARKET, 2022-2032 ($MILLION)
- FIGURE 48. TOP WINNING STRATEGIES, BY YEAR
- FIGURE 49. TOP WINNING STRATEGIES, BY DEVELOPMENT
- FIGURE 50. TOP WINNING STRATEGIES, BY COMPANY
- FIGURE 51. PRODUCT MAPPING OF TOP 10 PLAYERS
- FIGURE 52. COMPETITIVE DASHBOARD
- FIGURE 53. COMPETITIVE HEATMAP: PAPER PALLET MARKET
- FIGURE 54. TOP PLAYER POSITIONING, 2022
 瓦楞机市场-全球产业规模、份额、趋势、机会和预测,按类型、生产能力、应用、地区和竞争细分,2020-2030 年
 2034 年箱板纸市场分析与预测:类型、产品、应用、材料类型、技术、组件、製程、最终用户瓦楞折迭包装市场机会、成长动力、产业趋势分析及 2025 - 2034 年预测
 2032 年纸托盘市场预测:按产品类型、负载容量、应用、最终用户和地区进行的全球分析
 2025年全球瓦楞纸板市场报告
 瓦楞包装市场(按瓦楞类型、产品类型、最终用途产业和分销管道)—2025-2030 年全球预测箱板纸市场按产品类型、材料、纸板等级、纸张重量和最终用途产业划分-2025-2030 年全球预测
 纸箱板-市场占有率分析、产业趋势与统计、成长预测(2025-2030)纸托盘市场机会、成长动力、产业趋势分析及 2025 - 2034 年预测2025 年全球微瓦楞纸市场报告