


 |
市场调查报告书
商品编码
1472357
永久磁铁市场:按产品类型、按应用划分:2023-2032 年全球机会分析与产业预测Permanent Magnet Market By Product Type (Neodymium-Iron-Boron Magnet, Ferrite Magnet, Samarium Cobalt Magnet, Others), By End-Use : Global Opportunity Analysis and Industry Forecast, 2023-2032 |
||||||
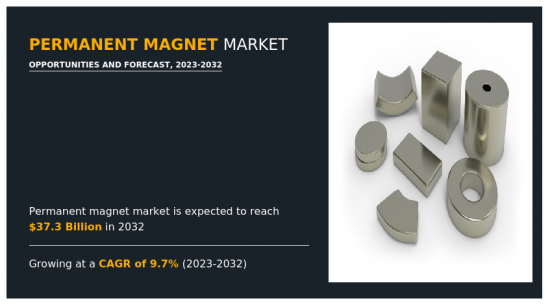
2022年全球永久磁铁市场价值为150亿美元,预计2023年至2032年复合年增长率为9.7%,到2032年达到373亿美元。
介绍
永久磁铁根据其成分和磁性能分为几种类型。最常见的类型包括铁氧体磁铁、钕磁铁、钐钴磁铁和铝镍钴磁铁。铁氧体磁铁,又称陶瓷磁铁,是由氧化铁与钡、锶、铅等混合而成,特征是抗退磁能力强。钕磁铁由钕、铁和硼组成,被认为是极强的磁铁。钐钴磁铁具有较高的耐温性和耐腐蚀性,使其适用于恶劣的环境。铝镍钴磁铁由铝、镍和钴组成,具有出色的温度稳定性和磁强度。
主要优点之一是高磁力与尺寸比,可实现电子设备、马达、发电机等的紧凑设计。尤其是钕磁铁,具有无与伦比的磁场强度,可以在保持性能的同时使组件变得更小。永久磁铁也提供长期的可靠性和稳定性,有助于提高产品的耐用性和使用寿命。抗退磁,在应用的整个生命週期中提供稳定的性能。此外,永久磁铁是一种经济高效的解决方案,因为它们有效地利用材料和能源,从而降低营运成本。
永久磁铁应用涵盖广泛的产业,是其持续成长和创新的驱动力。在汽车领域,永久磁铁是电动车 (EV)马达和混合动力汽车的重要组件,有助于实现高效的能量转换和推进系统。交通运输电动的转变导致对永久磁铁的需求增加,刺激了磁铁製造和马达设计的进步。此外,风力发电机和水力发电机等可再生能源发电技术利用永久磁铁发电。永磁发电机的轻量化和高效特性使其成为可再生能源应用的理想选择,并有助于清洁能源基础设施的扩张。
在电子产业,永磁体对于智慧型手机、电脑和音讯扬声器等家用电器的生产至关重要。电子产品小型化的趋势需要更小、更强大的磁体,这推动了增强磁性和製造技术的研究和开发工作。此外,永久磁铁在磁振造影(MRI) 和磁疗产品等医疗设备中发挥重要作用。生物医学领域不断探索永久磁铁在诊断、治疗和义肢假体方面的新应用,突显了它们在医疗保健应用中的多功能性和有效性。
市场动态
医疗设备的进步预计将推动永久磁铁市场的成长。磁振造影(MRI) 使用强大的磁铁产生强大的磁场,这对于创建人体内部结构的详细图像至关重要。高场MRI系统和先进成像技术的发展需要永久磁铁具有优异的磁性能,如高磁通密度和稳定性,以提高影像品质、解析度和诊断准确性。此外,MRI 在各种医疗应用中的日益普及,包括神经成像、肿瘤学和心血管成像,进一步推动了核磁共振造影系统对高性能永久磁铁的需求。 2022 年 9 月,新德里的大学间加速器中心 (IUAC) 安装了印度首创的本土核磁共振造影系统之一。创新系统配备 1.5 特斯拉超导性MRI 磁体,可进行全面的全身临床扫描。
心律调节器、心臟去颤器、人工电子耳和人工关节等植入式医疗设备通常采用永久磁铁来实现感测、驱动和固定目的。这些磁铁具有生物相容性、耐腐蚀,并且必须在体内表现出长期稳定性,以确保安全可靠的操作。更小、更节能的植入式设备的开发以及磁性药物传输和神经刺激等新应用正在推动对高性能永久磁铁的需求,以满足植入式医疗设备。
对环境问题的担忧预计将限制永磁体市场的成长。稀土元素(REE) 的提取通常采用对环境有害的采矿方法,例如露天采矿,这会导致栖息地破坏、水土流失以及有毒物质污染水源。此外,一些稀土矿床含有钍、铀等放射性元素,如果管理不当,会带来辐射暴露和环境污染的风险。稀土加工设施的各个加工步骤需要大量的水,导致水的消耗以及提取和精製步骤中使用的化学物质可能污染淡水来源。含有重金属、酸和其他污染物的废水会降低水质,损害水生生态系统,并对人类健康和生物多样性构成风险。
分部概览
永久磁铁市场按类型、最终用途和地区细分。依类型划分,市场分为钕铁硼磁铁、铁氧体磁铁、钐钴磁铁等。根据最终用途,市场分为消费性电子、汽车、医疗技术、能源等。按地区划分,我们研究了北美、欧洲、亚太地区和拉丁美洲地区 (LAMEA) 的市场。
按类型划分,钕铁硼 (NdFeB) 磁体在永久磁铁市场中占据主导地位。钕铁硼(NdFeB)磁铁广泛应用于电脑硬碟、扬声器、耳机和磁振造影(MRI)机等电子设备。钕铁硼磁体体积小且磁性强,非常适合注重紧凑性和效率的应用。此外,钕磁铁也用于马达、发电机、磁选机、磁振造影(MRI) 以及许多其他工业和科学应用。
从最终用途来看,能源是永久磁铁中成长最快的部分,在预测期内复合年增长率为 10.4%。永久磁铁对于波浪能和潮汐能等可再生能源技术的发展至关重要。在这些系统中,磁铁通常用于线性发电机和线性马达中,将海浪和潮汐流的机械能直接转换为电能。永久磁铁结构紧凑、耐用,适用于恶劣的海洋环境,其中可靠性和使用寿命是永续能源生产的关键因素。
按地区划分,亚太地区是永久磁铁市场最受青睐的部分。中国在永久磁铁生产和应用方面处于世界领先地位。中国拥有特别大量的钕和钐等稀土元素矿物蕴藏量,透过供应电子、汽车和可再生能源等行业必需的磁铁,在全球市场上占据主导地位。日本是亚太地区的另一个强国,以其在磁铁应用方面的先进技术和创新而闻名。日本电子工业从家用电器到工业机械等各个领域都严重依赖永久磁铁。此外,日本汽车工业在电动车 (EV)马达和其他汽车零件中广泛使用磁铁,以推动交通技术的创新和效率。日本企业也积极致力于研究开发,以提高磁铁的性能,开拓各行业的新应用。
竞争分析
永磁产业近期主要发展
2023 年 12 月,Advanced Magnet Lab, Inc. (AML) 宣布了一项创新计划,旨在彻底改变美国的永久磁铁生产。为了深入研究烧结和非烧结磁体的新材料成分,AML 将利用位于佛罗里达州布里瓦德县的两座大型设施(每座约 10,000 平方英尺)。这些设施仍然是公司在尖端合金和磁铁的原型製作、研发方面的重要中心。
主要市场趋势:
- 按类型划分,铝镍钴、柔性磁铁、铽等成长最快,预测期内复合年增长率为 9.7%。
- 以终端用途划分,家用电子电器产业对收益的贡献最大,占市场占有率的三分之一。
- 按地区划分,亚太地区占全球永久磁铁市场占有率的三分之一。
相关人员的主要利益
- 本报告对 2022 年至 2032 年永久磁铁市场分析的细分市场、当前趋势、估计/趋势分析和动态进行了定量分析,以确定当前的永久磁铁市场机会。
- 我们提供市场研究以及与市场驱动因素、市场限制和市场机会相关的资讯。
- 波特的五力分析强调买家和供应商帮助相关人员做出利润驱动的商业决策并加强供应商-买家网路的潜力。
- 对永久磁铁市场细分的详细分析有助于识别市场机会。
- 每个地区的主要国家都根据其对全球市场的收益贡献绘製了地图。
- 市场参与者定位有助于基准化分析,并提供对市场参与者当前位置的清晰了解。
- 该报告包括对区域和全球永久磁铁市场趋势、主要企业、细分市场、应用领域和市场成长策略的分析。
可以使用此报告进行客製化(需要额外费用和时间表)
- 製造能力
- 最终用户偏好和痛点
- 投资机会
- 按地区分類的新参与企业
- 科技趋势分析
- 新产品开发/主要企业产品矩阵
- 国家、区域和全球各级的患者/流行病学资料
- 针对客户兴趣的其他公司简介
- 公司简介的扩充列表
- 历史市场资料
- 导入/汇出分析/资料
- 主要参与者的详细资料(Excel格式,包括位置、联络资讯、供应商/供应商网路等)
- 客户/消费者/原料供应商名单 - 价值链分析
- SWOT分析
- 销售市场规模及预测
目录
第一章简介
第 2 章执行摘要
第三章市场概况
- 市场定义和范围
- 主要发现
- 影响因素
- 主要投资机会
- 波特五力分析
- 市场动态
- 促进因素
- 抑制因素
- 机会
- 价值链分析
- 关键监管分析
- 价格分析
- 专利情况
第四章永磁体市场:依产品类型
- 概述
- 钕铁硼 (NdFeB) 磁铁
- 铁氧体磁铁
- 钐钴磁铁
- 其他的
第五章永磁体市场:依应用分类
- 概述
- 家用电子电器
- 车
- 医疗技术
- 活力
- 其他的
第六章永磁体市场:依地区
- 概述
- 北美洲
- 美国
- 加拿大
- 墨西哥
- 欧洲
- 德国
- 法国
- 英国
- 西班牙
- 义大利
- 其他的
- 亚太地区
- 中国
- 印度
- 日本
- 韩国
- 澳洲
- 其他的
- 拉丁美洲/中东/非洲
- 巴西
- 南非
- 沙乌地阿拉伯
- 其他的
第七章 竞争格局
- 介绍
- 关键成功策略
- 10家主要企业产品图谱
- 竞争对手仪表板
- 竞争热图
- 2022年主要企业定位
第八章 公司简介
- Arnold Magnetic Technologies
- Adams Magnetic Products, LLC
- Dexter Magnetic Technologies
- Electron Energy Corporation
- Lynas Rare Earths Ltd
- Bunting
- Stanford Magnets
- TDK Corporation
- vacuumschmelze gmbh & co. kg
- Magnequench International, LLC
The global permanent magnet market was valued at $15.0 billion in 2022, and is projected to reach $37.3 billion by 2032, growing at a CAGR of 9.7% from 2023 to 2032.
Introduction
Permanent magnets are classified into several types on the basis of their composition and magnetic properties. The most common type includes ferrite magnets, neodymium magnets, samarium-cobalt magnets, and alnico magnets. Ferrite magnets, also known as ceramic magnets, are made from iron oxide mixed with barium, strontium, or lead, offering good resistance to demagnetization. Neodymium magnets, known for their exceptional strength, are composed of neodymium, iron, and boron. Samarium-cobalt magnets exhibit high resistance to temperature and corrosion, making them suitable for demanding environments. Alnico magnets, composed of aluminum, nickel, and cobalt, provide excellent temperature stability and magnetic strength.
One of the key advantages is their high magnetic strength-to-size ratio, allowing for compact designs in electronic devices, motors, and generators. Neodymium magnets, in particular, provide unparalleled magnetic strength, enabling the miniaturization of components while maintaining performance. Additionally, permanent magnets offer long-term reliability and stability, contributing to the durability and longevity of products. Their resistance to demagnetization ensures consistent performance throughout the lifespan of the application. Moreover, permanent magnets are cost-effective solutions due to their efficient use of materials and energy, resulting in reduced operational expenses.
The applications of permanent magnets span a wide range of industries, driving their continuous growth and innovation. In the automotive sector, permanent magnets are essential components in electric vehicle (EV) motors and hybrid vehicles, facilitating efficient energy conversion and propulsion systems. The shift towards electrification in transportation has led to increased demand for permanent magnets, stimulating advancements in magnet manufacturing and motor design. Furthermore, renewable energy technologies such as wind turbines and hydroelectric generators rely on permanent magnets for power generation. The lightweight and high-efficiency characteristics of permanent magnet generators make them ideal for renewable energy applications, contributing to the expansion of clean energy infrastructure.
In the electronics industry, permanent magnets are integral to the production of consumer electronics, including smartphones, computers, and audio speakers. The miniaturization trend in electronics necessitates smaller yet more powerful magnets, driving research and development efforts towards enhancing magnetic properties and manufacturing techniques. Additionally, permanent magnets play a crucial role in medical devices such as magnetic resonance imaging (MRI) machines and magnetic therapy products. The biomedical sector continues to explore novel applications of permanent magnets in diagnostics, treatments, and prosthetics, highlighting their versatility and effectiveness in healthcare applications.
Market Dynamics
Advancements in medical devices are expected to drive the growth of the permanent magnet market. Magnetic Resonance Imaging (MRI) machines utilize powerful magnets to generate strong magnetic fields, which are essential for producing detailed images of the internal structures of the body. The development of high-field MRI systems and advanced imaging techniques requires permanent magnets with superior magnetic properties, such as high magnetic flux density and stability, to enhance image quality, resolution, and diagnostic accuracy. Additionally, the increasing adoption of MRI in various medical applications, including neuroimaging, oncology, and cardiovascular imaging, further drives the demand for high-performance permanent magnets in MRI machines. In September 2022, the Inter-University Accelerator Centre (IUAC) in New Delhi introduced one of India's pioneering indigenous MRI machines. This innovative system features a 1.5 Tesla superconducting MRI magnet, enabling comprehensive full-body clinical scans.
Implantable medical devices, such as pacemakers, defibrillators, cochlear implants, and artificial joints, often incorporate permanent magnets for sensing, actuation, and fixation purposes. These magnets must exhibit biocompatibility, corrosion resistance, and long-term stability within the body to ensure safe and reliable operation. The development of miniaturized and power-efficient implantable devices, as well as novel applications such as magnetic drug delivery and neural stimulation, drives the demand for high-performance permanent magnets tailored to meet the specific requirements of implantable medical devices.
Environmental concerns are expected to restrain the growth of the permanent magnet market. The extraction of rare earth elements (REEs) often involves environmentally disruptive mining practices, such as open-pit mining, which can lead to habitat destruction, soil erosion, and contamination of water sources with toxic substances. Additionally, the presence of radioactive elements, such as thorium and uranium, in some REE deposits poses risks of radiation exposure and environmental contamination if not properly managed. REE processing facilities require significant quantities of water for various processing steps, leading to water consumption and potential contamination of freshwater sources with chemicals used in the extraction and purification processes. Effluent discharge containing heavy metals, acids, and other pollutants can degrade water quality and harm aquatic ecosystems, posing risks to human health and biodiversity.
Segments Overview
The permanent magnet market is segmented into type, end-use, and region. On the basis of type, the market is classified into neodymium iron boron magnet, ferrite magnet, samarium cobalt magnet, and others. On the basis of the end-use, the market is divided into consumer electronics, automotive, medical technology, energy, and others. Region-wise, the market is studied across North America, Europe, Asia-Pacific, and LAMEA.
On the basis of type Neodymium-Iron-Boron (NdFeB) magnet is dominated the permanent magnet market. NdFeB magnets find extensive use in electronic devices, such as computer hard drives, speakers, headphones, and magnetic resonance imaging (MRI) machines. Their small size and high magnetic strength make them ideal for such applications where compactness and efficiency are crucial. Additionally, NdFeB magnets are employed in motors, generators, magnetic separators, and magnetic resonance imaging (MRI) machines, among many other industrial and scientific applications.
On the basis of end-use energy is the fastest growing segment in permanent magnet growing with the CAGR of 10.4% during the forecast period. Permanent magnets are integral to the development of renewable energy technologies like wave and tidal power. In these systems, magnets are often utilized in linear generators or linear motors to convert the mechanical energy of ocean waves or tidal currents directly into electricity. The compact and durable nature of permanent magnets makes them well-suited for harsh marine environments, where reliability and longevity are critical factors for sustainable energy production.
Region wise Asia-Pacific is the most lucrative segment of the permanent magnet market. China stands out as a global leader in permanent magnet production and application. With its significant rare earth mineral reserves, particularly neodymium and samarium, China dominates the global market, supplying magnets crucial for industries like electronics, automotive, and renewable energy. Japan is another prominent player in the Asia-Pacific region known for its advanced technology and innovation in magnet applications. The Japanese electronics industry heavily relies on permanent magnets for products ranging from consumer electronics to industrial machinery. Moreover, Japan's automotive sector utilizes magnets extensively in electric vehicle (EV) motors and other automotive components, driving innovation and efficiency in transportation technology. Japanese companies are also actively involved in research and development to enhance magnet performance and explore new applications across various industries.
Competitive Analysis
In addition, the report covers profiles of key industry participants such as Arnold Magnetic Technologies, Adams Magnetic Products, LLC, Dexter Magnetic Technologies, Electron Energy Corporation, Lynas Rare Earths Ltd, Bunting, Stanford Magnets, TDK Corporation, VACUUMSCHMELZE GmbH & Co. KG, and Magnequench International, LLC.
Recent key developments in the permanent magnet industry
In December 2023, Advanced Magnet Lab, Inc. (AML) unveiled its innovative plan to revolutionize permanent magnet production in the U.S. By delving into novel material compositions for both sintered and non-sintered magnets, AML is set to utilize its two expansive facilities in Brevard County, Florida, covering roughly 10,000 square feet each. These facilities remain pivotal centers for the company's endeavors in prototyping, research, and the development of cutting-edge alloys and magnets.
Key Market Trends:
- By type, the other segments including alnico, flexible magnet, terbium and others is the fastest growing segment representing a CAGR of 9.7% during the forecast period.
- By end-use, the consumer electronics segment was the highest revenue contributor accounting for one third of the market share in the market.
- By region, Asia-Pacific dominated the market accounting for one third of the market share in the global permanent magnet market.
Key Benefits For Stakeholders
- This report provides a quantitative analysis of the market segments, current trends, estimations, and dynamics of the permanent magnet market analysis from 2022 to 2032 to identify the prevailing permanent magnet market opportunities.
- The market research is offered along with information related to key drivers, restraints, and opportunities.
- Porter's five forces analysis highlights the potency of buyers and suppliers to enable stakeholders make profit-oriented business decisions and strengthen their supplier-buyer network.
- In-depth analysis of the permanent magnet market segmentation assists to determine the prevailing market opportunities.
- Major countries in each region are mapped according to their revenue contribution to the global market.
- Market player positioning facilitates benchmarking and provides a clear understanding of the present position of the market players.
- The report includes the analysis of the regional as well as global permanent magnet market trends, key players, market segments, application areas, and market growth strategies.
Additional benefits you will get with this purchase are:
- Quarterly Update and* (only available with a corporate license, on listed price)
- 5 additional Company Profile of client Choice pre- or Post-purchase, as a free update.
- Free Upcoming Version on the Purchase of Five and Enterprise User License.
- 16 analyst hours of support* (post-purchase, if you find additional data requirements upon review of the report, you may receive support amounting to 16 analyst hours to solve questions, and post-sale queries)
- 15% Free Customization* (in case the scope or segment of the report does not match your requirements, 15% is equivalent to 3 working days of free work, applicable once)
- Free data Pack on the Five and Enterprise User License. (Excel version of the report)
- Free Updated report if the report is 6-12 months old or older.
- 24-hour priority response*
- Free Industry updates and white papers.
Possible Customization with this report (with additional cost and timeline, please talk to the sales executive to know more)
- Manufacturing Capacity
- End user preferences and pain points
- Investment Opportunities
- Upcoming/New Entrant by Regions
- Technology Trend Analysis
- New Product Development/ Product Matrix of Key Players
- Patient/epidemiology data at country, region, global level
- Additional company profiles with specific to client's interest
- Expanded list for Company Profiles
- Historic market data
- Import Export Analysis/Data
- Key player details (including location, contact details, supplier/vendor network etc. in excel format)
- List of customers/consumers/raw material suppliers- value chain analysis
- SWOT Analysis
- Volume Market Size and Forecast
Key Market Segments
By End-Use
- Consumer Electronics
- Automotive
- Medical Technology
- Energy
- Others
By Product Type
- Neodymium-Iron-Boron (NdFeB) Magnet
- Ferrite Magnet
- Samarium Cobalt Magnet
- Others
By Region
- North America
- U.S.
- Canada
- Mexico
- Europe
- Germany
- France
- UK
- Spain
- Italy
- Rest of Europe
- Asia-Pacific
- China
- India
- Japan
- South Korea
- Australia
- Rest of Asia-Pacific
- LAMEA
- Brazil
- South Africa
- Saudi Arabia
- Rest of LAMEA
Key Market Players:
- Arnold Magnetic Technologies
- Adams Magnetic Products, LLC
- Dexter Magnetic Technologies
- Electron Energy Corporation
- Lynas Rare Earths Ltd
- Bunting
- Stanford Magnets
- TDK Corporation
- vacuumschmelze gmbh & co. kg
- Magnequench International, LLC
TABLE OF CONTENTS
CHAPTER 1: INTRODUCTION
- 1.1. Report description
- 1.2. Key market segments
- 1.3. Key benefits to the stakeholders
- 1.4. Research methodology
- 1.4.1. Primary research
- 1.4.2. Secondary research
- 1.4.3. Analyst tools and models
CHAPTER 2: EXECUTIVE SUMMARY
- 2.1. CXO perspective
CHAPTER 3: MARKET OVERVIEW
- 3.1. Market definition and scope
- 3.2. Key findings
- 3.2.1. Top impacting factors
- 3.2.2. Top investment pockets
- 3.3. Porter's five forces analysis
- 3.4. Market dynamics
- 3.4.1. Drivers
- 3.4.2. Restraints
- 3.4.3. Opportunities
- 3.5. Value Chain Analysis
- 3.6. Key Regulation Analysis
- 3.7. Pricing Analysis
- 3.8. Patent Landscape
CHAPTER 4: PERMANENT MAGNET MARKET, BY PRODUCT TYPE
- 4.1. Overview
- 4.1.1. Market size and forecast
- 4.2. Neodymium-Iron-Boron (NdFeB) Magnet
- 4.2.1. Key market trends, growth factors and opportunities
- 4.2.2. Market size and forecast, by region
- 4.2.3. Market share analysis by country
- 4.3. Ferrite Magnet
- 4.3.1. Key market trends, growth factors and opportunities
- 4.3.2. Market size and forecast, by region
- 4.3.3. Market share analysis by country
- 4.4. Samarium Cobalt Magnet
- 4.4.1. Key market trends, growth factors and opportunities
- 4.4.2. Market size and forecast, by region
- 4.4.3. Market share analysis by country
- 4.5. Others
- 4.5.1. Key market trends, growth factors and opportunities
- 4.5.2. Market size and forecast, by region
- 4.5.3. Market share analysis by country
CHAPTER 5: PERMANENT MAGNET MARKET, BY END-USE
- 5.1. Overview
- 5.1.1. Market size and forecast
- 5.2. Consumer Electronics
- 5.2.1. Key market trends, growth factors and opportunities
- 5.2.2. Market size and forecast, by region
- 5.2.3. Market share analysis by country
- 5.3. Automotive
- 5.3.1. Key market trends, growth factors and opportunities
- 5.3.2. Market size and forecast, by region
- 5.3.3. Market share analysis by country
- 5.4. Medical Technology
- 5.4.1. Key market trends, growth factors and opportunities
- 5.4.2. Market size and forecast, by region
- 5.4.3. Market share analysis by country
- 5.5. Energy
- 5.5.1. Key market trends, growth factors and opportunities
- 5.5.2. Market size and forecast, by region
- 5.5.3. Market share analysis by country
- 5.6. Others
- 5.6.1. Key market trends, growth factors and opportunities
- 5.6.2. Market size and forecast, by region
- 5.6.3. Market share analysis by country
CHAPTER 6: PERMANENT MAGNET MARKET, BY REGION
- 6.1. Overview
- 6.1.1. Market size and forecast By Region
- 6.2. North America
- 6.2.1. Key market trends, growth factors and opportunities
- 6.2.2. Market size and forecast, by Product Type
- 6.2.3. Market size and forecast, by End-Use
- 6.2.4. Market size and forecast, by country
- 6.2.4.1. U.S.
- 6.2.4.1.1. Market size and forecast, by Product Type
- 6.2.4.1.2. Market size and forecast, by End-Use
- 6.2.4.2. Canada
- 6.2.4.2.1. Market size and forecast, by Product Type
- 6.2.4.2.2. Market size and forecast, by End-Use
- 6.2.4.3. Mexico
- 6.2.4.3.1. Market size and forecast, by Product Type
- 6.2.4.3.2. Market size and forecast, by End-Use
- 6.3. Europe
- 6.3.1. Key market trends, growth factors and opportunities
- 6.3.2. Market size and forecast, by Product Type
- 6.3.3. Market size and forecast, by End-Use
- 6.3.4. Market size and forecast, by country
- 6.3.4.1. Germany
- 6.3.4.1.1. Market size and forecast, by Product Type
- 6.3.4.1.2. Market size and forecast, by End-Use
- 6.3.4.2. France
- 6.3.4.2.1. Market size and forecast, by Product Type
- 6.3.4.2.2. Market size and forecast, by End-Use
- 6.3.4.3. UK
- 6.3.4.3.1. Market size and forecast, by Product Type
- 6.3.4.3.2. Market size and forecast, by End-Use
- 6.3.4.4. Spain
- 6.3.4.4.1. Market size and forecast, by Product Type
- 6.3.4.4.2. Market size and forecast, by End-Use
- 6.3.4.5. Italy
- 6.3.4.5.1. Market size and forecast, by Product Type
- 6.3.4.5.2. Market size and forecast, by End-Use
- 6.3.4.6. Rest of Europe
- 6.3.4.6.1. Market size and forecast, by Product Type
- 6.3.4.6.2. Market size and forecast, by End-Use
- 6.4. Asia-Pacific
- 6.4.1. Key market trends, growth factors and opportunities
- 6.4.2. Market size and forecast, by Product Type
- 6.4.3. Market size and forecast, by End-Use
- 6.4.4. Market size and forecast, by country
- 6.4.4.1. China
- 6.4.4.1.1. Market size and forecast, by Product Type
- 6.4.4.1.2. Market size and forecast, by End-Use
- 6.4.4.2. India
- 6.4.4.2.1. Market size and forecast, by Product Type
- 6.4.4.2.2. Market size and forecast, by End-Use
- 6.4.4.3. Japan
- 6.4.4.3.1. Market size and forecast, by Product Type
- 6.4.4.3.2. Market size and forecast, by End-Use
- 6.4.4.4. South Korea
- 6.4.4.4.1. Market size and forecast, by Product Type
- 6.4.4.4.2. Market size and forecast, by End-Use
- 6.4.4.5. Australia
- 6.4.4.5.1. Market size and forecast, by Product Type
- 6.4.4.5.2. Market size and forecast, by End-Use
- 6.4.4.6. Rest of Asia-Pacific
- 6.4.4.6.1. Market size and forecast, by Product Type
- 6.4.4.6.2. Market size and forecast, by End-Use
- 6.5. LAMEA
- 6.5.1. Key market trends, growth factors and opportunities
- 6.5.2. Market size and forecast, by Product Type
- 6.5.3. Market size and forecast, by End-Use
- 6.5.4. Market size and forecast, by country
- 6.5.4.1. Brazil
- 6.5.4.1.1. Market size and forecast, by Product Type
- 6.5.4.1.2. Market size and forecast, by End-Use
- 6.5.4.2. South Africa
- 6.5.4.2.1. Market size and forecast, by Product Type
- 6.5.4.2.2. Market size and forecast, by End-Use
- 6.5.4.3. Saudi Arabia
- 6.5.4.3.1. Market size and forecast, by Product Type
- 6.5.4.3.2. Market size and forecast, by End-Use
- 6.5.4.4. Rest of LAMEA
- 6.5.4.4.1. Market size and forecast, by Product Type
- 6.5.4.4.2. Market size and forecast, by End-Use
CHAPTER 7: COMPETITIVE LANDSCAPE
- 7.1. Introduction
- 7.2. Top winning strategies
- 7.3. Product mapping of top 10 player
- 7.4. Competitive dashboard
- 7.5. Competitive heatmap
- 7.6. Top player positioning, 2022
CHAPTER 8: COMPANY PROFILES
- 8.1. Arnold Magnetic Technologies
- 8.1.1. Company overview
- 8.1.2. Key executives
- 8.1.3. Company snapshot
- 8.1.4. Operating business segments
- 8.1.5. Product portfolio
- 8.1.6. Business performance
- 8.1.7. Key strategic moves and developments
- 8.2. Adams Magnetic Products, LLC
- 8.2.1. Company overview
- 8.2.2. Key executives
- 8.2.3. Company snapshot
- 8.2.4. Operating business segments
- 8.2.5. Product portfolio
- 8.2.6. Business performance
- 8.2.7. Key strategic moves and developments
- 8.3. Dexter Magnetic Technologies
- 8.3.1. Company overview
- 8.3.2. Key executives
- 8.3.3. Company snapshot
- 8.3.4. Operating business segments
- 8.3.5. Product portfolio
- 8.3.6. Business performance
- 8.3.7. Key strategic moves and developments
- 8.4. Electron Energy Corporation
- 8.4.1. Company overview
- 8.4.2. Key executives
- 8.4.3. Company snapshot
- 8.4.4. Operating business segments
- 8.4.5. Product portfolio
- 8.4.6. Business performance
- 8.4.7. Key strategic moves and developments
- 8.5. Lynas Rare Earths Ltd
- 8.5.1. Company overview
- 8.5.2. Key executives
- 8.5.3. Company snapshot
- 8.5.4. Operating business segments
- 8.5.5. Product portfolio
- 8.5.6. Business performance
- 8.5.7. Key strategic moves and developments
- 8.6. Bunting
- 8.6.1. Company overview
- 8.6.2. Key executives
- 8.6.3. Company snapshot
- 8.6.4. Operating business segments
- 8.6.5. Product portfolio
- 8.6.6. Business performance
- 8.6.7. Key strategic moves and developments
- 8.7. Stanford Magnets
- 8.7.1. Company overview
- 8.7.2. Key executives
- 8.7.3. Company snapshot
- 8.7.4. Operating business segments
- 8.7.5. Product portfolio
- 8.7.6. Business performance
- 8.7.7. Key strategic moves and developments
- 8.8. TDK Corporation
- 8.8.1. Company overview
- 8.8.2. Key executives
- 8.8.3. Company snapshot
- 8.8.4. Operating business segments
- 8.8.5. Product portfolio
- 8.8.6. Business performance
- 8.8.7. Key strategic moves and developments
- 8.9. vacuumschmelze gmbh & co. kg
- 8.9.1. Company overview
- 8.9.2. Key executives
- 8.9.3. Company snapshot
- 8.9.4. Operating business segments
- 8.9.5. Product portfolio
- 8.9.6. Business performance
- 8.9.7. Key strategic moves and developments
- 8.10. Magnequench International, LLC
- 8.10.1. Company overview
- 8.10.2. Key executives
- 8.10.3. Company snapshot
- 8.10.4. Operating business segments
- 8.10.5. Product portfolio
- 8.10.6. Business performance
- 8.10.7. Key strategic moves and developments
LIST OF TABLES
- TABLE 01. GLOBAL PERMANENT MAGNET MARKET, BY PRODUCT TYPE, 2022-2032 ($MILLION)
- TABLE 02. GLOBAL PERMANENT MAGNET MARKET, BY PRODUCT TYPE, 2022-2032 (TONS)
- TABLE 03. PERMANENT MAGNET MARKET FOR NEODYMIUM-IRON-BORON (NDFEB) MAGNET, BY REGION, 2022-2032 ($MILLION)
- TABLE 04. PERMANENT MAGNET MARKET FOR NEODYMIUM-IRON-BORON (NDFEB) MAGNET, BY REGION, 2022-2032 (TONS)
- TABLE 05. PERMANENT MAGNET MARKET FOR FERRITE MAGNET, BY REGION, 2022-2032 ($MILLION)
- TABLE 06. PERMANENT MAGNET MARKET FOR FERRITE MAGNET, BY REGION, 2022-2032 (TONS)
- TABLE 07. PERMANENT MAGNET MARKET FOR SAMARIUM COBALT MAGNET, BY REGION, 2022-2032 ($MILLION)
- TABLE 08. PERMANENT MAGNET MARKET FOR SAMARIUM COBALT MAGNET, BY REGION, 2022-2032 (TONS)
- TABLE 09. PERMANENT MAGNET MARKET FOR OTHERS, BY REGION, 2022-2032 ($MILLION)
- TABLE 10. PERMANENT MAGNET MARKET FOR OTHERS, BY REGION, 2022-2032 (TONS)
- TABLE 11. GLOBAL PERMANENT MAGNET MARKET, BY END-USE, 2022-2032 ($MILLION)
- TABLE 12. GLOBAL PERMANENT MAGNET MARKET, BY END-USE, 2022-2032 (TONS)
- TABLE 13. PERMANENT MAGNET MARKET FOR CONSUMER ELECTRONICS, BY REGION, 2022-2032 ($MILLION)
- TABLE 14. PERMANENT MAGNET MARKET FOR CONSUMER ELECTRONICS, BY REGION, 2022-2032 (TONS)
- TABLE 15. PERMANENT MAGNET MARKET FOR AUTOMOTIVE, BY REGION, 2022-2032 ($MILLION)
- TABLE 16. PERMANENT MAGNET MARKET FOR AUTOMOTIVE, BY REGION, 2022-2032 (TONS)
- TABLE 17. PERMANENT MAGNET MARKET FOR MEDICAL TECHNOLOGY, BY REGION, 2022-2032 ($MILLION)
- TABLE 18. PERMANENT MAGNET MARKET FOR MEDICAL TECHNOLOGY, BY REGION, 2022-2032 (TONS)
- TABLE 19. PERMANENT MAGNET MARKET FOR ENERGY, BY REGION, 2022-2032 ($MILLION)
- TABLE 20. PERMANENT MAGNET MARKET FOR ENERGY, BY REGION, 2022-2032 (TONS)
- TABLE 21. PERMANENT MAGNET MARKET FOR OTHERS, BY REGION, 2022-2032 ($MILLION)
- TABLE 22. PERMANENT MAGNET MARKET FOR OTHERS, BY REGION, 2022-2032 (TONS)
- TABLE 23. PERMANENT MAGNET MARKET, BY REGION, 2022-2032 ($MILLION)
- TABLE 24. PERMANENT MAGNET MARKET, BY REGION, 2022-2032 (TONS)
- TABLE 25. NORTH AMERICA PERMANENT MAGNET MARKET, BY PRODUCT TYPE, 2022-2032 ($MILLION)
- TABLE 26. NORTH AMERICA PERMANENT MAGNET MARKET, BY PRODUCT TYPE, 2022-2032 (TONS)
- TABLE 27. NORTH AMERICA PERMANENT MAGNET MARKET, BY END-USE, 2022-2032 ($MILLION)
- TABLE 28. NORTH AMERICA PERMANENT MAGNET MARKET, BY END-USE, 2022-2032 (TONS)
- TABLE 29. NORTH AMERICA PERMANENT MAGNET MARKET, BY COUNTRY, 2022-2032 ($MILLION)
- TABLE 30. NORTH AMERICA PERMANENT MAGNET MARKET, BY COUNTRY, 2022-2032 (TONS)
- TABLE 31. U.S. PERMANENT MAGNET MARKET, BY PRODUCT TYPE, 2022-2032 ($MILLION)
- TABLE 32. U.S. PERMANENT MAGNET MARKET, BY PRODUCT TYPE, 2022-2032 (TONS)
- TABLE 33. U.S. PERMANENT MAGNET MARKET, BY END-USE, 2022-2032 ($MILLION)
- TABLE 34. U.S. PERMANENT MAGNET MARKET, BY END-USE, 2022-2032 (TONS)
- TABLE 35. CANADA PERMANENT MAGNET MARKET, BY PRODUCT TYPE, 2022-2032 ($MILLION)
- TABLE 36. CANADA PERMANENT MAGNET MARKET, BY PRODUCT TYPE, 2022-2032 (TONS)
- TABLE 37. CANADA PERMANENT MAGNET MARKET, BY END-USE, 2022-2032 ($MILLION)
- TABLE 38. CANADA PERMANENT MAGNET MARKET, BY END-USE, 2022-2032 (TONS)
- TABLE 39. MEXICO PERMANENT MAGNET MARKET, BY PRODUCT TYPE, 2022-2032 ($MILLION)
- TABLE 40. MEXICO PERMANENT MAGNET MARKET, BY PRODUCT TYPE, 2022-2032 (TONS)
- TABLE 41. MEXICO PERMANENT MAGNET MARKET, BY END-USE, 2022-2032 ($MILLION)
- TABLE 42. MEXICO PERMANENT MAGNET MARKET, BY END-USE, 2022-2032 (TONS)
- TABLE 43. EUROPE PERMANENT MAGNET MARKET, BY PRODUCT TYPE, 2022-2032 ($MILLION)
- TABLE 44. EUROPE PERMANENT MAGNET MARKET, BY PRODUCT TYPE, 2022-2032 (TONS)
- TABLE 45. EUROPE PERMANENT MAGNET MARKET, BY END-USE, 2022-2032 ($MILLION)
- TABLE 46. EUROPE PERMANENT MAGNET MARKET, BY END-USE, 2022-2032 (TONS)
- TABLE 47. EUROPE PERMANENT MAGNET MARKET, BY COUNTRY, 2022-2032 ($MILLION)
- TABLE 48. EUROPE PERMANENT MAGNET MARKET, BY COUNTRY, 2022-2032 (TONS)
- TABLE 49. GERMANY PERMANENT MAGNET MARKET, BY PRODUCT TYPE, 2022-2032 ($MILLION)
- TABLE 50. GERMANY PERMANENT MAGNET MARKET, BY PRODUCT TYPE, 2022-2032 (TONS)
- TABLE 51. GERMANY PERMANENT MAGNET MARKET, BY END-USE, 2022-2032 ($MILLION)
- TABLE 52. GERMANY PERMANENT MAGNET MARKET, BY END-USE, 2022-2032 (TONS)
- TABLE 53. FRANCE PERMANENT MAGNET MARKET, BY PRODUCT TYPE, 2022-2032 ($MILLION)
- TABLE 54. FRANCE PERMANENT MAGNET MARKET, BY PRODUCT TYPE, 2022-2032 (TONS)
- TABLE 55. FRANCE PERMANENT MAGNET MARKET, BY END-USE, 2022-2032 ($MILLION)
- TABLE 56. FRANCE PERMANENT MAGNET MARKET, BY END-USE, 2022-2032 (TONS)
- TABLE 57. UK PERMANENT MAGNET MARKET, BY PRODUCT TYPE, 2022-2032 ($MILLION)
- TABLE 58. UK PERMANENT MAGNET MARKET, BY PRODUCT TYPE, 2022-2032 (TONS)
- TABLE 59. UK PERMANENT MAGNET MARKET, BY END-USE, 2022-2032 ($MILLION)
- TABLE 60. UK PERMANENT MAGNET MARKET, BY END-USE, 2022-2032 (TONS)
- TABLE 61. SPAIN PERMANENT MAGNET MARKET, BY PRODUCT TYPE, 2022-2032 ($MILLION)
- TABLE 62. SPAIN PERMANENT MAGNET MARKET, BY PRODUCT TYPE, 2022-2032 (TONS)
- TABLE 63. SPAIN PERMANENT MAGNET MARKET, BY END-USE, 2022-2032 ($MILLION)
- TABLE 64. SPAIN PERMANENT MAGNET MARKET, BY END-USE, 2022-2032 (TONS)
- TABLE 65. ITALY PERMANENT MAGNET MARKET, BY PRODUCT TYPE, 2022-2032 ($MILLION)
- TABLE 66. ITALY PERMANENT MAGNET MARKET, BY PRODUCT TYPE, 2022-2032 (TONS)
- TABLE 67. ITALY PERMANENT MAGNET MARKET, BY END-USE, 2022-2032 ($MILLION)
- TABLE 68. ITALY PERMANENT MAGNET MARKET, BY END-USE, 2022-2032 (TONS)
- TABLE 69. REST OF EUROPE PERMANENT MAGNET MARKET, BY PRODUCT TYPE, 2022-2032 ($MILLION)
- TABLE 70. REST OF EUROPE PERMANENT MAGNET MARKET, BY PRODUCT TYPE, 2022-2032 (TONS)
- TABLE 71. REST OF EUROPE PERMANENT MAGNET MARKET, BY END-USE, 2022-2032 ($MILLION)
- TABLE 72. REST OF EUROPE PERMANENT MAGNET MARKET, BY END-USE, 2022-2032 (TONS)
- TABLE 73. ASIA-PACIFIC PERMANENT MAGNET MARKET, BY PRODUCT TYPE, 2022-2032 ($MILLION)
- TABLE 74. ASIA-PACIFIC PERMANENT MAGNET MARKET, BY PRODUCT TYPE, 2022-2032 (TONS)
- TABLE 75. ASIA-PACIFIC PERMANENT MAGNET MARKET, BY END-USE, 2022-2032 ($MILLION)
- TABLE 76. ASIA-PACIFIC PERMANENT MAGNET MARKET, BY END-USE, 2022-2032 (TONS)
- TABLE 77. ASIA-PACIFIC PERMANENT MAGNET MARKET, BY COUNTRY, 2022-2032 ($MILLION)
- TABLE 78. ASIA-PACIFIC PERMANENT MAGNET MARKET, BY COUNTRY, 2022-2032 (TONS)
- TABLE 79. CHINA PERMANENT MAGNET MARKET, BY PRODUCT TYPE, 2022-2032 ($MILLION)
- TABLE 80. CHINA PERMANENT MAGNET MARKET, BY PRODUCT TYPE, 2022-2032 (TONS)
- TABLE 81. CHINA PERMANENT MAGNET MARKET, BY END-USE, 2022-2032 ($MILLION)
- TABLE 82. CHINA PERMANENT MAGNET MARKET, BY END-USE, 2022-2032 (TONS)
- TABLE 83. INDIA PERMANENT MAGNET MARKET, BY PRODUCT TYPE, 2022-2032 ($MILLION)
- TABLE 84. INDIA PERMANENT MAGNET MARKET, BY PRODUCT TYPE, 2022-2032 (TONS)
- TABLE 85. INDIA PERMANENT MAGNET MARKET, BY END-USE, 2022-2032 ($MILLION)
- TABLE 86. INDIA PERMANENT MAGNET MARKET, BY END-USE, 2022-2032 (TONS)
- TABLE 87. JAPAN PERMANENT MAGNET MARKET, BY PRODUCT TYPE, 2022-2032 ($MILLION)
- TABLE 88. JAPAN PERMANENT MAGNET MARKET, BY PRODUCT TYPE, 2022-2032 (TONS)
- TABLE 89. JAPAN PERMANENT MAGNET MARKET, BY END-USE, 2022-2032 ($MILLION)
- TABLE 90. JAPAN PERMANENT MAGNET MARKET, BY END-USE, 2022-2032 (TONS)
- TABLE 91. SOUTH KOREA PERMANENT MAGNET MARKET, BY PRODUCT TYPE, 2022-2032 ($MILLION)
- TABLE 92. SOUTH KOREA PERMANENT MAGNET MARKET, BY PRODUCT TYPE, 2022-2032 (TONS)
- TABLE 93. SOUTH KOREA PERMANENT MAGNET MARKET, BY END-USE, 2022-2032 ($MILLION)
- TABLE 94. SOUTH KOREA PERMANENT MAGNET MARKET, BY END-USE, 2022-2032 (TONS)
- TABLE 95. AUSTRALIA PERMANENT MAGNET MARKET, BY PRODUCT TYPE, 2022-2032 ($MILLION)
- TABLE 96. AUSTRALIA PERMANENT MAGNET MARKET, BY PRODUCT TYPE, 2022-2032 (TONS)
- TABLE 97. AUSTRALIA PERMANENT MAGNET MARKET, BY END-USE, 2022-2032 ($MILLION)
- TABLE 98. AUSTRALIA PERMANENT MAGNET MARKET, BY END-USE, 2022-2032 (TONS)
- TABLE 99. REST OF ASIA-PACIFIC PERMANENT MAGNET MARKET, BY PRODUCT TYPE, 2022-2032 ($MILLION)
- TABLE 100. REST OF ASIA-PACIFIC PERMANENT MAGNET MARKET, BY PRODUCT TYPE, 2022-2032 (TONS)
- TABLE 101. REST OF ASIA-PACIFIC PERMANENT MAGNET MARKET, BY END-USE, 2022-2032 ($MILLION)
- TABLE 102. REST OF ASIA-PACIFIC PERMANENT MAGNET MARKET, BY END-USE, 2022-2032 (TONS)
- TABLE 103. LAMEA PERMANENT MAGNET MARKET, BY PRODUCT TYPE, 2022-2032 ($MILLION)
- TABLE 104. LAMEA PERMANENT MAGNET MARKET, BY PRODUCT TYPE, 2022-2032 (TONS)
- TABLE 105. LAMEA PERMANENT MAGNET MARKET, BY END-USE, 2022-2032 ($MILLION)
- TABLE 106. LAMEA PERMANENT MAGNET MARKET, BY END-USE, 2022-2032 (TONS)
- TABLE 107. LAMEA PERMANENT MAGNET MARKET, BY COUNTRY, 2022-2032 ($MILLION)
- TABLE 108. LAMEA PERMANENT MAGNET MARKET, BY COUNTRY, 2022-2032 (TONS)
- TABLE 109. BRAZIL PERMANENT MAGNET MARKET, BY PRODUCT TYPE, 2022-2032 ($MILLION)
- TABLE 110. BRAZIL PERMANENT MAGNET MARKET, BY PRODUCT TYPE, 2022-2032 (TONS)
- TABLE 111. BRAZIL PERMANENT MAGNET MARKET, BY END-USE, 2022-2032 ($MILLION)
- TABLE 112. BRAZIL PERMANENT MAGNET MARKET, BY END-USE, 2022-2032 (TONS)
- TABLE 113. SOUTH AFRICA PERMANENT MAGNET MARKET, BY PRODUCT TYPE, 2022-2032 ($MILLION)
- TABLE 114. SOUTH AFRICA PERMANENT MAGNET MARKET, BY PRODUCT TYPE, 2022-2032 (TONS)
- TABLE 115. SOUTH AFRICA PERMANENT MAGNET MARKET, BY END-USE, 2022-2032 ($MILLION)
- TABLE 116. SOUTH AFRICA PERMANENT MAGNET MARKET, BY END-USE, 2022-2032 (TONS)
- TABLE 117. SAUDI ARABIA PERMANENT MAGNET MARKET, BY PRODUCT TYPE, 2022-2032 ($MILLION)
- TABLE 118. SAUDI ARABIA PERMANENT MAGNET MARKET, BY PRODUCT TYPE, 2022-2032 (TONS)
- TABLE 119. SAUDI ARABIA PERMANENT MAGNET MARKET, BY END-USE, 2022-2032 ($MILLION)
- TABLE 120. SAUDI ARABIA PERMANENT MAGNET MARKET, BY END-USE, 2022-2032 (TONS)
- TABLE 121. REST OF LAMEA PERMANENT MAGNET MARKET, BY PRODUCT TYPE, 2022-2032 ($MILLION)
- TABLE 122. REST OF LAMEA PERMANENT MAGNET MARKET, BY PRODUCT TYPE, 2022-2032 (TONS)
- TABLE 123. REST OF LAMEA PERMANENT MAGNET MARKET, BY END-USE, 2022-2032 ($MILLION)
- TABLE 124. REST OF LAMEA PERMANENT MAGNET MARKET, BY END-USE, 2022-2032 (TONS)
- TABLE 125. ARNOLD MAGNETIC TECHNOLOGIES: KEY EXECUTIVES
- TABLE 126. ARNOLD MAGNETIC TECHNOLOGIES: COMPANY SNAPSHOT
- TABLE 127. ARNOLD MAGNETIC TECHNOLOGIES: PRODUCT SEGMENTS
- TABLE 128. ARNOLD MAGNETIC TECHNOLOGIES: SERVICE SEGMENTS
- TABLE 129. ARNOLD MAGNETIC TECHNOLOGIES: PRODUCT PORTFOLIO
- TABLE 130. ARNOLD MAGNETIC TECHNOLOGIES: KEY STRATERGIES
- TABLE 131. ADAMS MAGNETIC PRODUCTS, LLC: KEY EXECUTIVES
- TABLE 132. ADAMS MAGNETIC PRODUCTS, LLC: COMPANY SNAPSHOT
- TABLE 133. ADAMS MAGNETIC PRODUCTS, LLC: PRODUCT SEGMENTS
- TABLE 134. ADAMS MAGNETIC PRODUCTS, LLC: SERVICE SEGMENTS
- TABLE 135. ADAMS MAGNETIC PRODUCTS, LLC: PRODUCT PORTFOLIO
- TABLE 136. ADAMS MAGNETIC PRODUCTS, LLC: KEY STRATERGIES
- TABLE 137. DEXTER MAGNETIC TECHNOLOGIES: KEY EXECUTIVES
- TABLE 138. DEXTER MAGNETIC TECHNOLOGIES: COMPANY SNAPSHOT
- TABLE 139. DEXTER MAGNETIC TECHNOLOGIES: PRODUCT SEGMENTS
- TABLE 140. DEXTER MAGNETIC TECHNOLOGIES: SERVICE SEGMENTS
- TABLE 141. DEXTER MAGNETIC TECHNOLOGIES: PRODUCT PORTFOLIO
- TABLE 142. DEXTER MAGNETIC TECHNOLOGIES: KEY STRATERGIES
- TABLE 143. ELECTRON ENERGY CORPORATION: KEY EXECUTIVES
- TABLE 144. ELECTRON ENERGY CORPORATION: COMPANY SNAPSHOT
- TABLE 145. ELECTRON ENERGY CORPORATION: PRODUCT SEGMENTS
- TABLE 146. ELECTRON ENERGY CORPORATION: SERVICE SEGMENTS
- TABLE 147. ELECTRON ENERGY CORPORATION: PRODUCT PORTFOLIO
- TABLE 148. ELECTRON ENERGY CORPORATION: KEY STRATERGIES
- TABLE 149. LYNAS RARE EARTHS LTD: KEY EXECUTIVES
- TABLE 150. LYNAS RARE EARTHS LTD: COMPANY SNAPSHOT
- TABLE 151. LYNAS RARE EARTHS LTD: PRODUCT SEGMENTS
- TABLE 152. LYNAS RARE EARTHS LTD: SERVICE SEGMENTS
- TABLE 153. LYNAS RARE EARTHS LTD: PRODUCT PORTFOLIO
- TABLE 154. LYNAS RARE EARTHS LTD: KEY STRATERGIES
- TABLE 155. BUNTING: KEY EXECUTIVES
- TABLE 156. BUNTING: COMPANY SNAPSHOT
- TABLE 157. BUNTING: PRODUCT SEGMENTS
- TABLE 158. BUNTING: SERVICE SEGMENTS
- TABLE 159. BUNTING: PRODUCT PORTFOLIO
- TABLE 160. BUNTING: KEY STRATERGIES
- TABLE 161. STANFORD MAGNETS: KEY EXECUTIVES
- TABLE 162. STANFORD MAGNETS: COMPANY SNAPSHOT
- TABLE 163. STANFORD MAGNETS: PRODUCT SEGMENTS
- TABLE 164. STANFORD MAGNETS: SERVICE SEGMENTS
- TABLE 165. STANFORD MAGNETS: PRODUCT PORTFOLIO
- TABLE 166. STANFORD MAGNETS: KEY STRATERGIES
- TABLE 167. TDK CORPORATION: KEY EXECUTIVES
- TABLE 168. TDK CORPORATION: COMPANY SNAPSHOT
- TABLE 169. TDK CORPORATION: PRODUCT SEGMENTS
- TABLE 170. TDK CORPORATION: SERVICE SEGMENTS
- TABLE 171. TDK CORPORATION: PRODUCT PORTFOLIO
- TABLE 172. TDK CORPORATION: KEY STRATERGIES
- TABLE 173. VACUUMSCHMELZE GMBH & CO. KG: KEY EXECUTIVES
- TABLE 174. VACUUMSCHMELZE GMBH & CO. KG: COMPANY SNAPSHOT
- TABLE 175. VACUUMSCHMELZE GMBH & CO. KG: PRODUCT SEGMENTS
- TABLE 176. VACUUMSCHMELZE GMBH & CO. KG: SERVICE SEGMENTS
- TABLE 177. VACUUMSCHMELZE GMBH & CO. KG: PRODUCT PORTFOLIO
- TABLE 178. VACUUMSCHMELZE GMBH & CO. KG: KEY STRATERGIES
- TABLE 179. MAGNEQUENCH INTERNATIONAL, LLC: KEY EXECUTIVES
- TABLE 180. MAGNEQUENCH INTERNATIONAL, LLC: COMPANY SNAPSHOT
- TABLE 181. MAGNEQUENCH INTERNATIONAL, LLC: PRODUCT SEGMENTS
- TABLE 182. MAGNEQUENCH INTERNATIONAL, LLC: SERVICE SEGMENTS
- TABLE 183. MAGNEQUENCH INTERNATIONAL, LLC: PRODUCT PORTFOLIO
- TABLE 184. MAGNEQUENCH INTERNATIONAL, LLC: KEY STRATERGIES
LIST OF FIGURES
- FIGURE 01. PERMANENT MAGNET MARKET, 2022-2032
- FIGURE 02. SEGMENTATION OF PERMANENT MAGNET MARKET,2022-2032
- FIGURE 03. TOP IMPACTING FACTORS IN PERMANENT MAGNET MARKET
- FIGURE 04. TOP INVESTMENT POCKETS IN PERMANENT MAGNET MARKET (2023-2032)
- FIGURE 05. BARGAINING POWER OF SUPPLIERS
- FIGURE 06. BARGAINING POWER OF BUYERS
- FIGURE 07. THREAT OF SUBSTITUTION
- FIGURE 08. THREAT OF SUBSTITUTION
- FIGURE 09. COMPETITIVE RIVALRY
- FIGURE 10. GLOBAL PERMANENT MAGNET MARKET:DRIVERS, RESTRAINTS AND OPPORTUNITIES
- FIGURE 11. IMPACT OF KEY REGULATION: PERMANENT MAGNET MARKET
- FIGURE 12. PRICING ANALYSIS: PERMANENT MAGNET MARKET 2022 AND 2032
- FIGURE 13. PATENT ANALYSIS BY COMPANY
- FIGURE 14. PATENT ANALYSIS BY COUNTRY
- FIGURE 15. PERMANENT MAGNET MARKET, BY PRODUCT TYPE, 2022 AND 2032(%)
- FIGURE 16. COMPARATIVE SHARE ANALYSIS OF PERMANENT MAGNET MARKET FOR NEODYMIUM-IRON-BORON (NDFEB) MAGNET, BY COUNTRY 2022 AND 2032(%)
- FIGURE 17. COMPARATIVE SHARE ANALYSIS OF PERMANENT MAGNET MARKET FOR FERRITE MAGNET, BY COUNTRY 2022 AND 2032(%)
- FIGURE 18. COMPARATIVE SHARE ANALYSIS OF PERMANENT MAGNET MARKET FOR SAMARIUM COBALT MAGNET, BY COUNTRY 2022 AND 2032(%)
- FIGURE 19. COMPARATIVE SHARE ANALYSIS OF PERMANENT MAGNET MARKET FOR OTHERS, BY COUNTRY 2022 AND 2032(%)
- FIGURE 20. PERMANENT MAGNET MARKET, BY END-USE, 2022 AND 2032(%)
- FIGURE 21. COMPARATIVE SHARE ANALYSIS OF PERMANENT MAGNET MARKET FOR CONSUMER ELECTRONICS, BY COUNTRY 2022 AND 2032(%)
- FIGURE 22. COMPARATIVE SHARE ANALYSIS OF PERMANENT MAGNET MARKET FOR AUTOMOTIVE, BY COUNTRY 2022 AND 2032(%)
- FIGURE 23. COMPARATIVE SHARE ANALYSIS OF PERMANENT MAGNET MARKET FOR MEDICAL TECHNOLOGY, BY COUNTRY 2022 AND 2032(%)
- FIGURE 24. COMPARATIVE SHARE ANALYSIS OF PERMANENT MAGNET MARKET FOR ENERGY, BY COUNTRY 2022 AND 2032(%)
- FIGURE 25. COMPARATIVE SHARE ANALYSIS OF PERMANENT MAGNET MARKET FOR OTHERS, BY COUNTRY 2022 AND 2032(%)
- FIGURE 26. PERMANENT MAGNET MARKET BY REGION, 2022 AND 2032(%)
- FIGURE 27. U.S. PERMANENT MAGNET MARKET, 2022-2032 ($MILLION)
- FIGURE 28. CANADA PERMANENT MAGNET MARKET, 2022-2032 ($MILLION)
- FIGURE 29. MEXICO PERMANENT MAGNET MARKET, 2022-2032 ($MILLION)
- FIGURE 30. GERMANY PERMANENT MAGNET MARKET, 2022-2032 ($MILLION)
- FIGURE 31. FRANCE PERMANENT MAGNET MARKET, 2022-2032 ($MILLION)
- FIGURE 32. UK PERMANENT MAGNET MARKET, 2022-2032 ($MILLION)
- FIGURE 33. SPAIN PERMANENT MAGNET MARKET, 2022-2032 ($MILLION)
- FIGURE 34. ITALY PERMANENT MAGNET MARKET, 2022-2032 ($MILLION)
- FIGURE 35. REST OF EUROPE PERMANENT MAGNET MARKET, 2022-2032 ($MILLION)
- FIGURE 36. CHINA PERMANENT MAGNET MARKET, 2022-2032 ($MILLION)
- FIGURE 37. INDIA PERMANENT MAGNET MARKET, 2022-2032 ($MILLION)
- FIGURE 38. JAPAN PERMANENT MAGNET MARKET, 2022-2032 ($MILLION)
- FIGURE 39. SOUTH KOREA PERMANENT MAGNET MARKET, 2022-2032 ($MILLION)
- FIGURE 40. AUSTRALIA PERMANENT MAGNET MARKET, 2022-2032 ($MILLION)
- FIGURE 41. REST OF ASIA-PACIFIC PERMANENT MAGNET MARKET, 2022-2032 ($MILLION)
- FIGURE 42. BRAZIL PERMANENT MAGNET MARKET, 2022-2032 ($MILLION)
- FIGURE 43. SOUTH AFRICA PERMANENT MAGNET MARKET, 2022-2032 ($MILLION)
- FIGURE 44. SAUDI ARABIA PERMANENT MAGNET MARKET, 2022-2032 ($MILLION)
- FIGURE 45. REST OF LAMEA PERMANENT MAGNET MARKET, 2022-2032 ($MILLION)
- FIGURE 46. TOP WINNING STRATEGIES, BY YEAR
- FIGURE 47. TOP WINNING STRATEGIES, BY DEVELOPMENT
- FIGURE 48. TOP WINNING STRATEGIES, BY COMPANY
- FIGURE 49. PRODUCT MAPPING OF TOP 10 PLAYERS
- FIGURE 50. COMPETITIVE DASHBOARD
- FIGURE 51. COMPETITIVE HEATMAP: PERMANENT MAGNET MARKET
- FIGURE 52. TOP PLAYER POSITIONING, 2022
 高扭矩同步马达市场,规模,占有率,产业分析报告:各用途,安装类别,各技术,各产业,各地区,2025年~2034年的市场预测
 同步马达市场:按产品类型、按安装类型、按电压等级、按功率、按冷却类型、按速度、按应用、按最终用途 - 2025-2030 年全球预测
 永磁市场机会、成长动力、产业趋势分析及 2025 - 2034 年预测
 全球永久磁铁市场按类型、最终用途行业和地区划分 - 预测至 2029 年
 永磁体市场 2025-2029
 2025 年永磁体全球市场报告
 世界同步马达 -市场占有率分析、产业趋势/统计、成长预测(2025-2030)
 永久磁铁市场规模、份额、成长分析、按类型、最终用途产业、按地区 - 产业预测,2025-2032 年永久磁铁市场:按材料、类型、等级、製造流程、应用、最终用户产业划分 - 2025-2030 年全球预测
 永久磁铁的全球市场:实际成果与预测(2019年~2030年)