


 |
市场调查报告书
商品编码
1641753
全球复合材料测试市场按类型、测试类型和最终用途行业划分 - 机会分析和行业预测(2024-2033 年)Composites Testing Market By Type , By Test Type By End-Use Industry : Global Opportunity Analysis and Industry Forecast, 2024-2033 |
||||||
复合材料测试市场
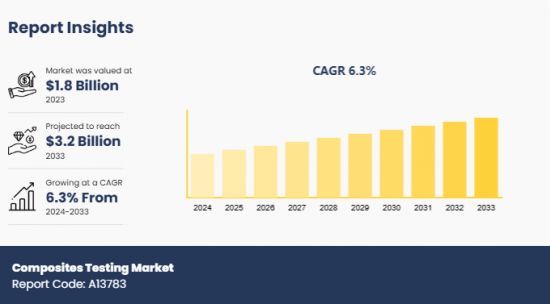
2023 年全球复合材料测试市场规模价值为 18 亿美元,预计到 2033 年将达到 32 亿美元,2024 年至 2033 年的复合年增长率为 6.3%。
复合材料测试涉及测试复合材料的机械、热、物理和环境特性,以确保它们满足各种应用所需的性能标准。复合材料是由两种或多种具有不同特性的成分组合而成的,与单一元素相比,其性能更为优异。复合材料由于其异向性及对环境条件的敏感性,其行为往往与金属和聚合物不同,因此进行严格的测试极为重要。
由于复合材料重量轻,汽车和航太工业对其的需求不断增加,推动了这些元素的开发和测试,从而推动了市场成长。此外,复合材料开发程序中的技术创新促进了测试过程,以确保这些过程的可靠性,从而显着增加了市场的成长。目前的趋势是整合 AI、ML 和物联网等工业 4.0 技术,以提高测试流程的准确性。这些技术透过预测模型和即时监控提高了测试程序的效率。
然而,复合材料测试相关技术的高成本限制了注重预算的製造商和研究机构的采用,从而阻碍了市场成长。此外,缺乏标准化的测试程序延迟了新型复合材料的认证和验收,从而阻碍了市场的发展。相反,越来越多地使用复合材料来利用可再生资源生产能源,预计将为复合材料测试市场开闢新的途径。根据国际能源总署预测,到2030年,电力、暖气和运输领域的可再生能源消耗预计将增加60%。这将推动对创新测试解决方案的需求,以确定复合材料的承载能力和抗疲劳和天气相关劣化的有效性。
部分回顾
复合材料测试市场分为类型、测试类型、最终用途行业和地区。根据类型,市场分为陶瓷基复合材料、聚合物基复合材料、金属基复合材料、纤维增强复合材料等。检测类型分为破坏性检测和非破坏性检验。根据最终用途行业,市场分为航太、汽车、建筑和其他。按地区分析,涵盖北美、欧洲、亚太地区、拉丁美洲、中东和非洲。
主要发现
按类型划分,纤维增强复合材料部分在 2023 年占据了最高的市场占有率。
按测试类型划分,非破坏性检验领域在 2023 年占据了市场主导地位。
基于最终用途产业,航太领域在 2023 年的市场上占据显着地位。
按地区划分,预计欧洲将在 2023 年创造最高收益。
本报告可提供客製化(请联络销售人员以了解其他费用和时间表)
- 资本投资明细
- 消费者购买行为分析
- 最终用户的偏好和痛点
- 产品基准/产品规格及应用
- 产品生命週期
- 供应链分析与供应商利润
- 新参与企业(按地区)
- 科技趋势分析
- 经销商利润分析
- 打入市场策略
- 按产品/细分市场进行市场细分
- 主要公司的新产品开发/产品矩阵
- 监管指南
- 根据客户兴趣提供额外的公司简介
- 按国家或地区进行的额外分析:市场规模和预测
- 品牌占有率分析
- 历史市场资料
- 导入/汇出分析/资料
- Excel 格式的主要企业详细资料(包括位置、联络资讯、供应商/供应商网路等)
- 人均消费趋势
- 产品消费分析
- SWOT 分析
目录
第 1 章 简介
第 2 章执行摘要
第三章 市场状况
- 市场定义和范围
- 主要发现
- 主要投资机会
- 关键成功策略
- 波特五力分析
- 市场动态
- 驱动程式
- 限制因素
- 机会
第四章 复合材料测试市场按类型
- 市场概况
- 陶瓷基复合材料
- 聚合物基复合材料
- 金属基复合材料
- 纤维增强复合材料
- 其他的
5. 复合材料测试市场依测试类型划分
- 市场概况
- 破坏性测试
- 非破坏性检验
6. 复合材料测试市场(依最终用途产业划分)
- 市场概况
- 航太
- 车
- 建造
- 其他的
7. 复合材料测试市场(按地区)
- 市场概况
- 北美洲
- 主要市场趋势和机会
- 美国复合材料测试市场
- 加拿大复合材料测试市场
- 墨西哥复合材料测试市场
- 欧洲
- 主要市场趋势和机会
- 法国复合材料测试市场
- 德国复合材料测试市场
- 义大利复合材料测试市场
- 西班牙复合材料测试市场
- 英国复合材料测试市场
- 其他欧洲国家复合材料测试市场
- 亚太地区
- 主要市场趋势和机会
- 中国复合材料测试市场
- 日本复合材料测试市场
- 印度复合材料测试市场
- 韩国复合材料检测市场
- 澳洲复合材料测试市场
- 其他亚太复合材料测试市场
- 拉丁美洲、中东和非洲
- 主要市场趋势和机会
- 巴西复合材料测试市场
- 南非复合材料测试市场
- 沙乌地阿拉伯复合材料测试市场
- 其他拉丁美洲、中东和非洲复合材料测试市场
第八章 竞争格局
- 介绍
- 关键成功策略
- 前 10 家公司的产品映射
- 竞争仪錶板
- 竞争热图
- 主要企业的定位:2023年
第九章 公司简介
- Intertek Group Plc
- TA Instruments
- Micro Materials
- Element Materials Technology
- Thermtest Inc.
- Kinectrics
- SGS General Surveillance Company SA
- Henkel AG And Co. KGaA
- Instron Corporation
- R-TECH MATERIALS
Composites Testing Market
The composites testing market was valued at $1.8 billion in 2023 and is projected to reach $3.2 billion by 2033, growing at a CAGR of 6.3% from 2024 to 2033.
Composites testing involves the examination of mechanical, thermal, physical, and environmental properties of composite materials to ensure they cater to the essential performance criteria across diverse applications. A composite is formed by the combination of two or more components with distinguished characteristics, resulting in a material with superior properties as compared to the individual elements. Conducting robust testing is crucial as composites tend to behave differently from metals or polymers owing to their anisotropic properties and sensitivity to environmental conditions.
Increase in demand for composites from the automotive and aerospace industries owing to their lightweight property has boosted the development & testing of these elements, which is driving the growth of the market. In addition, innovations in the development procedures of composites have fueled the testing process to ensure the reliability of these processes, thereby augmenting the market growth notably. To enhance precision in the testing process, the integration of Industry 4.0 technologies such as AI, ML, and the Internet of Things is currently trending. These technologies enhance the efficiency of testing procedures through predictive modeling and real-time monitoring.
However, the high cost of technologies associated with composites testing restricts its adoption among budget-sensitive manufacturers and research institutions, which hinders the growth of the market. Furthermore, lack of standardization in testing procedures delays the certification and acceptance of new composites, restraining the market development. On the contrary, rise in the usage of composites to produce energy from renewable sources is projected to open new avenues for the composites testing market. According to the International Energy Agency, the consumption of renewable energy in the power, heat, and transport sectors is projected to increase by 60% by 2030. This is poised to fuel the need for ingenious testing solutions to examine the load-bearing capacity and effectiveness of composites against fatigue & weather-induced degradation.
Segment Review
The composites testing market is segmented into type, test type, end-use industry, and region. On the basis of type, the market is divided into ceramic matrics composites, polymer matrics composites, metal matrics composites, fiber reinforced composites, and others. As per test type, it is bifurcated into destructive test and non-destructive test. Depending on end-use industry, it is categorized into aerospace, automotive, construction, and others. Region wise, it is analyzed across North America, Europe, Asia-Pacific, and LAMEA.
Key Findings
On the basis of type, the fiber reinforced composites segment held the highest market share in 2023.
As per test type, the non-destructive test segment dominated the market in 2023.
Depending on end-use industry, the aerospace segment acquired a notable stake in the market in 2023.
Region wise, Europe was the highest revenue generator in 2023.
Competition Analysis
The major players in the global composites testing market include Intertek Group plc, TA Instruments, Micro Materials, Element Materials Technology, Thermtest Inc., Kinectrics, SGS General Surveillance Company SA, Henkel AG & Co. KGaA, Instron Corporation, and R-TECH MATERIALS. These major players have adopted various key development strategies such as business expansion, new product launches, and partnerships to strengthen their foothold in the competitive market.
Additional benefits you will get with this purchase are:
- Quarterly Update and* (only available with a corporate license, on listed price)
- 5 additional Company Profile of client Choice pre- or Post-purchase, as a free update.
- Free Upcoming Version on the Purchase of Five and Enterprise User License.
- 16 analyst hours of support* (post-purchase, if you find additional data requirements upon review of the report, you may receive support amounting to 16 analyst hours to solve questions, and post-sale queries)
- 15% Free Customization* (in case the scope or segment of the report does not match your requirements, 15% is equivalent to 3 working days of free work, applicable once)
- Free data Pack on the Five and Enterprise User License. (Excel version of the report)
- Free Updated report if the report is 6-12 months old or older.
- 24-hour priority response*
- Free Industry updates and white papers.
Possible Customization with this report (with additional cost and timeline, please talk to the sales executive to know more)
- Capital Investment breakdown
- Consumer Buying Behavior Analysis
- End user preferences and pain points
- Product Benchmarking / Product specification and applications
- Product Life Cycles
- Supply Chain Analysis & Vendor Margins
- Upcoming/New Entrant by Regions
- Technology Trend Analysis
- Distributor margin Analysis
- Go To Market Strategy
- Market share analysis of players by products/segments
- New Product Development/ Product Matrix of Key Players
- Regulatory Guidelines
- Additional company profiles with specific to client's interest
- Additional country or region analysis- market size and forecast
- Brands Share Analysis
- Historic market data
- Import Export Analysis/Data
- Key player details (including location, contact details, supplier/vendor network etc. in excel format)
- Per Capita Consumption Trends
- Product Consumption Analysis
- SWOT Analysis
Key Market Segments
By Type
- Ceramic Matrics Composites
- Polymer Matrics Composites
- Metal Matrics Composites
- Fiber Reinforced Composites
- Others
By Test Type
- Destructive Test
- Non-Destructive Test
By End-Use Industry
- Aerospace
- Automotive
- Construction
- Others
By Region
- North America
- U.S.
- Canada
- Mexico
- Europe
- France
- Germany
- Italy
- Spain
- UK
- Rest of Europe
- Asia-Pacific
- China
- Japan
- India
- South Korea
- Australia
- Rest of Asia-Pacific
- LAMEA
- Brazil
- South Africa
- Saudi Arabia
- Rest of LAMEA
Key Market Players:
- Intertek Group plc
- TA Instruments
- Micro Materials
- Element Materials Technology
- Thermtest Inc.
- Kinectrics
- SGS General Surveillance Company SA
- Henkel AG & Co. KGaA
- Instron Corporation
- R-TECH MATERIALS
TABLE OF CONTENTS
CHAPTER 1: INTRODUCTION
- 1.1. Report Description
- 1.2. Key Market Segments
- 1.3. Key Benefits
- 1.4. Research Methodology
- 1.4.1. Primary Research
- 1.4.2. Secondary Research
- 1.4.3. Analyst Tools and Models
CHAPTER 2: EXECUTIVE SUMMARY
- 2.1. CXO Perspective
CHAPTER 3: MARKET LANDSCAPE
- 3.1. Market Definition and Scope
- 3.2. Key Findings
- 3.2.1. Top Investment Pockets
- 3.2.2. Top Winning Strategies
- 3.3. Porter's Five Forces Analysis
- 3.3.1. Bargaining Power of Suppliers
- 3.3.2. Threat of New Entrants
- 3.3.3. Threat of Substitutes
- 3.3.4. Competitive Rivalry
- 3.3.5. Bargaining Power among Buyers
- 3.4. Market Dynamics
- 3.4.1. Drivers
- 3.4.2. Restraints
- 3.4.3. Opportunities
CHAPTER 4: COMPOSITES TESTING MARKET, BY TYPE
- 4.1. Market Overview
- 4.1.1 Market Size and Forecast, By Type
- 4.2. Ceramic Matrics Composites
- 4.2.1. Key Market Trends, Growth Factors and Opportunities
- 4.2.2. Market Size and Forecast, By Region
- 4.2.3. Market Share Analysis, By Country
- 4.3. Polymer Matrics Composites
- 4.3.1. Key Market Trends, Growth Factors and Opportunities
- 4.3.2. Market Size and Forecast, By Region
- 4.3.3. Market Share Analysis, By Country
- 4.4. Metal Matrics Composites
- 4.4.1. Key Market Trends, Growth Factors and Opportunities
- 4.4.2. Market Size and Forecast, By Region
- 4.4.3. Market Share Analysis, By Country
- 4.5. Fiber Reinforced Composites
- 4.5.1. Key Market Trends, Growth Factors and Opportunities
- 4.5.2. Market Size and Forecast, By Region
- 4.5.3. Market Share Analysis, By Country
- 4.6. Others
- 4.6.1. Key Market Trends, Growth Factors and Opportunities
- 4.6.2. Market Size and Forecast, By Region
- 4.6.3. Market Share Analysis, By Country
CHAPTER 5: COMPOSITES TESTING MARKET, BY TEST TYPE
- 5.1. Market Overview
- 5.1.1 Market Size and Forecast, By Test Type
- 5.2. Destructive Test
- 5.2.1. Key Market Trends, Growth Factors and Opportunities
- 5.2.2. Market Size and Forecast, By Region
- 5.2.3. Market Share Analysis, By Country
- 5.3. Non-Destructive Test
- 5.3.1. Key Market Trends, Growth Factors and Opportunities
- 5.3.2. Market Size and Forecast, By Region
- 5.3.3. Market Share Analysis, By Country
CHAPTER 6: COMPOSITES TESTING MARKET, BY END-USE INDUSTRY
- 6.1. Market Overview
- 6.1.1 Market Size and Forecast, By End-use Industry
- 6.2. Aerospace
- 6.2.1. Key Market Trends, Growth Factors and Opportunities
- 6.2.2. Market Size and Forecast, By Region
- 6.2.3. Market Share Analysis, By Country
- 6.3. Automotive
- 6.3.1. Key Market Trends, Growth Factors and Opportunities
- 6.3.2. Market Size and Forecast, By Region
- 6.3.3. Market Share Analysis, By Country
- 6.4. Construction
- 6.4.1. Key Market Trends, Growth Factors and Opportunities
- 6.4.2. Market Size and Forecast, By Region
- 6.4.3. Market Share Analysis, By Country
- 6.5. Others
- 6.5.1. Key Market Trends, Growth Factors and Opportunities
- 6.5.2. Market Size and Forecast, By Region
- 6.5.3. Market Share Analysis, By Country
CHAPTER 7: COMPOSITES TESTING MARKET, BY REGION
- 7.1. Market Overview
- 7.1.1 Market Size and Forecast, By Region
- 7.2. North America
- 7.2.1. Key Market Trends and Opportunities
- 7.2.2. Market Size and Forecast, By Type
- 7.2.3. Market Size and Forecast, By Test Type
- 7.2.4. Market Size and Forecast, By End-use Industry
- 7.2.5. Market Size and Forecast, By Country
- 7.2.6. U.S. Composites Testing Market
- 7.2.6.1. Market Size and Forecast, By Type
- 7.2.6.2. Market Size and Forecast, By Test Type
- 7.2.6.3. Market Size and Forecast, By End-use Industry
- 7.2.7. Canada Composites Testing Market
- 7.2.7.1. Market Size and Forecast, By Type
- 7.2.7.2. Market Size and Forecast, By Test Type
- 7.2.7.3. Market Size and Forecast, By End-use Industry
- 7.2.8. Mexico Composites Testing Market
- 7.2.8.1. Market Size and Forecast, By Type
- 7.2.8.2. Market Size and Forecast, By Test Type
- 7.2.8.3. Market Size and Forecast, By End-use Industry
- 7.3. Europe
- 7.3.1. Key Market Trends and Opportunities
- 7.3.2. Market Size and Forecast, By Type
- 7.3.3. Market Size and Forecast, By Test Type
- 7.3.4. Market Size and Forecast, By End-use Industry
- 7.3.5. Market Size and Forecast, By Country
- 7.3.6. France Composites Testing Market
- 7.3.6.1. Market Size and Forecast, By Type
- 7.3.6.2. Market Size and Forecast, By Test Type
- 7.3.6.3. Market Size and Forecast, By End-use Industry
- 7.3.7. Germany Composites Testing Market
- 7.3.7.1. Market Size and Forecast, By Type
- 7.3.7.2. Market Size and Forecast, By Test Type
- 7.3.7.3. Market Size and Forecast, By End-use Industry
- 7.3.8. Italy Composites Testing Market
- 7.3.8.1. Market Size and Forecast, By Type
- 7.3.8.2. Market Size and Forecast, By Test Type
- 7.3.8.3. Market Size and Forecast, By End-use Industry
- 7.3.9. Spain Composites Testing Market
- 7.3.9.1. Market Size and Forecast, By Type
- 7.3.9.2. Market Size and Forecast, By Test Type
- 7.3.9.3. Market Size and Forecast, By End-use Industry
- 7.3.10. UK Composites Testing Market
- 7.3.10.1. Market Size and Forecast, By Type
- 7.3.10.2. Market Size and Forecast, By Test Type
- 7.3.10.3. Market Size and Forecast, By End-use Industry
- 7.3.11. Rest Of Europe Composites Testing Market
- 7.3.11.1. Market Size and Forecast, By Type
- 7.3.11.2. Market Size and Forecast, By Test Type
- 7.3.11.3. Market Size and Forecast, By End-use Industry
- 7.4. Asia-Pacific
- 7.4.1. Key Market Trends and Opportunities
- 7.4.2. Market Size and Forecast, By Type
- 7.4.3. Market Size and Forecast, By Test Type
- 7.4.4. Market Size and Forecast, By End-use Industry
- 7.4.5. Market Size and Forecast, By Country
- 7.4.6. China Composites Testing Market
- 7.4.6.1. Market Size and Forecast, By Type
- 7.4.6.2. Market Size and Forecast, By Test Type
- 7.4.6.3. Market Size and Forecast, By End-use Industry
- 7.4.7. Japan Composites Testing Market
- 7.4.7.1. Market Size and Forecast, By Type
- 7.4.7.2. Market Size and Forecast, By Test Type
- 7.4.7.3. Market Size and Forecast, By End-use Industry
- 7.4.8. India Composites Testing Market
- 7.4.8.1. Market Size and Forecast, By Type
- 7.4.8.2. Market Size and Forecast, By Test Type
- 7.4.8.3. Market Size and Forecast, By End-use Industry
- 7.4.9. South Korea Composites Testing Market
- 7.4.9.1. Market Size and Forecast, By Type
- 7.4.9.2. Market Size and Forecast, By Test Type
- 7.4.9.3. Market Size and Forecast, By End-use Industry
- 7.4.10. Australia Composites Testing Market
- 7.4.10.1. Market Size and Forecast, By Type
- 7.4.10.2. Market Size and Forecast, By Test Type
- 7.4.10.3. Market Size and Forecast, By End-use Industry
- 7.4.11. Rest of Asia-Pacific Composites Testing Market
- 7.4.11.1. Market Size and Forecast, By Type
- 7.4.11.2. Market Size and Forecast, By Test Type
- 7.4.11.3. Market Size and Forecast, By End-use Industry
- 7.5. LAMEA
- 7.5.1. Key Market Trends and Opportunities
- 7.5.2. Market Size and Forecast, By Type
- 7.5.3. Market Size and Forecast, By Test Type
- 7.5.4. Market Size and Forecast, By End-use Industry
- 7.5.5. Market Size and Forecast, By Country
- 7.5.6. Brazil Composites Testing Market
- 7.5.6.1. Market Size and Forecast, By Type
- 7.5.6.2. Market Size and Forecast, By Test Type
- 7.5.6.3. Market Size and Forecast, By End-use Industry
- 7.5.7. South Africa Composites Testing Market
- 7.5.7.1. Market Size and Forecast, By Type
- 7.5.7.2. Market Size and Forecast, By Test Type
- 7.5.7.3. Market Size and Forecast, By End-use Industry
- 7.5.8. Saudi Arabia Composites Testing Market
- 7.5.8.1. Market Size and Forecast, By Type
- 7.5.8.2. Market Size and Forecast, By Test Type
- 7.5.8.3. Market Size and Forecast, By End-use Industry
- 7.5.9. Rest of LAMEA Composites Testing Market
- 7.5.9.1. Market Size and Forecast, By Type
- 7.5.9.2. Market Size and Forecast, By Test Type
- 7.5.9.3. Market Size and Forecast, By End-use Industry
CHAPTER 8: COMPETITIVE LANDSCAPE
- 8.1. Introduction
- 8.2. Top Winning Strategies
- 8.3. Product Mapping Of Top 10 Player
- 8.4. Competitive Dashboard
- 8.5. Competitive Heatmap
- 8.6. Top Player Positioning, 2023
CHAPTER 9: COMPANY PROFILES
- 9.1. Intertek Group Plc
- 9.1.1. Company Overview
- 9.1.2. Key Executives
- 9.1.3. Company Snapshot
- 9.1.4. Operating Business Segments
- 9.1.5. Product Portfolio
- 9.1.6. Business Performance
- 9.1.7. Key Strategic Moves and Developments
- 9.2. TA Instruments
- 9.2.1. Company Overview
- 9.2.2. Key Executives
- 9.2.3. Company Snapshot
- 9.2.4. Operating Business Segments
- 9.2.5. Product Portfolio
- 9.2.6. Business Performance
- 9.2.7. Key Strategic Moves and Developments
- 9.3. Micro Materials
- 9.3.1. Company Overview
- 9.3.2. Key Executives
- 9.3.3. Company Snapshot
- 9.3.4. Operating Business Segments
- 9.3.5. Product Portfolio
- 9.3.6. Business Performance
- 9.3.7. Key Strategic Moves and Developments
- 9.4. Element Materials Technology
- 9.4.1. Company Overview
- 9.4.2. Key Executives
- 9.4.3. Company Snapshot
- 9.4.4. Operating Business Segments
- 9.4.5. Product Portfolio
- 9.4.6. Business Performance
- 9.4.7. Key Strategic Moves and Developments
- 9.5. Thermtest Inc.
- 9.5.1. Company Overview
- 9.5.2. Key Executives
- 9.5.3. Company Snapshot
- 9.5.4. Operating Business Segments
- 9.5.5. Product Portfolio
- 9.5.6. Business Performance
- 9.5.7. Key Strategic Moves and Developments
- 9.6. Kinectrics
- 9.6.1. Company Overview
- 9.6.2. Key Executives
- 9.6.3. Company Snapshot
- 9.6.4. Operating Business Segments
- 9.6.5. Product Portfolio
- 9.6.6. Business Performance
- 9.6.7. Key Strategic Moves and Developments
- 9.7. SGS General Surveillance Company SA
- 9.7.1. Company Overview
- 9.7.2. Key Executives
- 9.7.3. Company Snapshot
- 9.7.4. Operating Business Segments
- 9.7.5. Product Portfolio
- 9.7.6. Business Performance
- 9.7.7. Key Strategic Moves and Developments
- 9.8. Henkel AG And Co. KGaA
- 9.8.1. Company Overview
- 9.8.2. Key Executives
- 9.8.3. Company Snapshot
- 9.8.4. Operating Business Segments
- 9.8.5. Product Portfolio
- 9.8.6. Business Performance
- 9.8.7. Key Strategic Moves and Developments
- 9.9. Instron Corporation
- 9.9.1. Company Overview
- 9.9.2. Key Executives
- 9.9.3. Company Snapshot
- 9.9.4. Operating Business Segments
- 9.9.5. Product Portfolio
- 9.9.6. Business Performance
- 9.9.7. Key Strategic Moves and Developments
- 9.10. R-TECH MATERIALS
- 9.10.1. Company Overview
- 9.10.2. Key Executives
- 9.10.3. Company Snapshot
- 9.10.4. Operating Business Segments
- 9.10.5. Product Portfolio
- 9.10.6. Business Performance
- 9.10.7. Key Strategic Moves and Developments
 2025年材料分析测试设备全球市场报告
 复合材料测试:市场占有率分析、产业趋势、成长预测(2025-2030)
 复合材料测试市场:按产品类型、测试方法、应用划分 - 2025-2030 年全球预测
![复合材料测试市场:趋势、机会与竞争分析 [2024-2030]](/sample/img/cover/42/default_cover_5.png) 复合材料测试市场:趋势、机会与竞争分析 [2024-2030]
复合材料测试市场:趋势、机会与竞争分析 [2024-2030]