


 |
市场调查报告书
商品编码
1304595
连接器产业年鑑:2023年2023 Connector Industry Yearbook |
||||||
本报告提供全球连接器市场相关调查,提供市场概要,以及2012年~2022年前的各地区,各最终用途设备部门的销售额,2028年前的预测,连接器产业的发展趋势,及主要加入企业概要等资讯。
目录
开端
第1章 - 全球电子连接器产业
- 过去10年(2012年~2022年)
- 表:各区域销售额
- 图表:各地区变化:2012年和2022年
- 过去5年(2018年~2022年)
- 去年~2022年
- 各设备部门销售额:2020年~2022年
- 预测
- 各最终用途市场预测:2023年和2028年
- 各连接器类别预测:2023年和2028年
- 合併和收购
- 2023年主要的技术趋势
- 交期
- 价格趋势
第2章 2022年重要的事件
第3章 整合的主要业绩指标
- 连合主要业绩指标
- 主要财务指标(2011~2021年)
- 表(图表):主要财务指标
- 资产负债表
- 损益清单
- 公司业绩转变
- 主要连接器厂商
- 销货成本
- 销售·一般管理(SG&A)
- 原价+贩管费率
- 净利的转变
- 流动比率
- 总资产报酬率
- 股东资本报酬率
- 长期负债/资本
- 负债比率
- 应收账款週转率
- 平均收集期间
- 存货週转数
- 库存日数
第4章 主要企业的业绩履历
主要企业的业绩履历
Amphenol Corporation
- 主要财务指标
表(图表):主要财务指标
- 资产负债表的金额(2012年~2022年)
- 资产负债表(2012年~2022年)
- 损益清单 (2012年~2022年)
Cheng Uei Precision Co. Ltd. (Foxlink)
FIT Hon Teng Ltd.
Hirose Electric Co., Ltd.
Hosiden
HUBER+SUHNER
Japan Aviation Electronics Industry (JAE), Limited
Korea Electric Terminal Co. Ltd.
SMK
TE Connectivity
Report Summary:
Each year, Bishop & Associates prepares the “Connector Industry Yearbook ” based on annual reports provided by publicly traded connector companies.
Income statements and balance sheets are consolidated for the past 10 years, five years, and most current year, providing benchmarks on the industry and the overall performance of the public connector companies. Featured in each issue are: consolidated history of the public companies, fifteen-year history of performance by company (including industry averages), and a chronological description of important 2021 industry events.
Additional Details:
Each year, Bishop & Associates prepares the “Connector Industry Yearbook ” based on annual reports provided by publicly traded connector companies. Income statements and balance sheets are consolidated for the past 10 years, five years, and most current year, providing benchmarks on the industry and the overall performance of the public connector companies.
In addition, the report provides a review of the connector industry for the period 2012-2022 for sales by region, end-use equipment sector and our current forecast for 2023 and 2028 by region and end-use equipment sector.
This report features:
Consolidated history of the public companies including:
- Key Financial Measurements (2012-2022)
- Balance Sheet $ (2012-2022)
- Income Statement $ (2012-2022)
- Balance Sheet percent (2012-2022)
- Income Statement percent (2012-2022)
Fifteen-year history of performance by company, with industry averages for the following financial measurements:
- Selling, General, & Administrative percent (2008-2022)
- Net Income percent (2008-2022)
- Return on Assets (2008-2022)
- Long Term Debt/Equity (2008-2022)
- Accounts Receivables Turnover (2008-2022)
- Inventory Turns (2008-2022)
- Cost of Goods Sold percent (2008-2022)
- COGS + SG&A percent (2008-2022)
- Current Ratio (2008-2022)
- Return on Equity (2008-2022)
- Liabilities to Equity (2008-2022)
- Average Collection Period (2008-2022)
- Days Inventory (2008-2022)
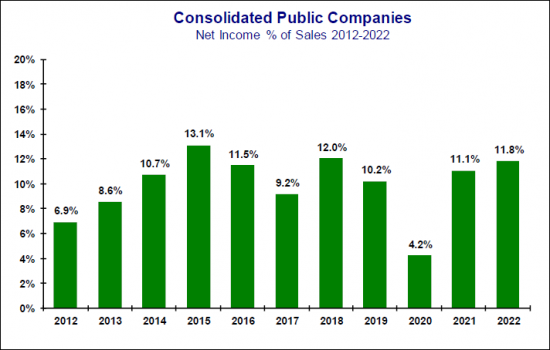
2022 Yearbook Companies Gross Income as a Percent of Sales
The following table provides Net Income as a percent of sales from 2012-2022 for public companies included in the 2023 Connector Industry Yearbook.
Net Income
In 2022 the connector industry had an average net income of 11.8% of sales, compared with 11.1% in 2021 and 4.2% in 2020. The reduction in profits in 2020 can largely to attributed to COVID-19 pandemic that slowed sales worldwide. 2018 was a significant year in United States which passed the Tax Cuts and Jobs Act which reduced the federal corporate income tax from 35% to 21%.
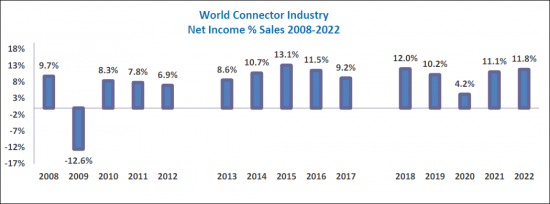
As a result of the worldwide economic downturn in 2009, the lowest net income as a percent of sales occurred in 2009 at -12.6%. This was the first time that net income had been a negative number for the consolidated public companies. Between 2013 and 2017, net income increased from 8.6% of sales in 2013 to 9.2% of sales in 2017. Between 2018 and 2022, net income decreased from 12.0 % in 2018 to 11.8% in 2022.
The following chart provides a history of net income for the Connector Industry from 2008-2022.
TABLE OF CONTENTS
PROLOGUE
CHAPTER 1 - THE WORLD ELECTRONIC CONNECTOR INDUSTRY
- The Last Ten Years (2012-2022)
- Table: Sales by Geographic Region
- Graph: Change by Geographic Region 2012 vs 2022
- The Last Five Years (2018-2022)
- Table: Sales by Geographic Region
- Graph: World Connector Industry - Year-To-Year Percent Change in Growth
- Graph: North American Market Year-to-Year Growth 1980-2023F
- Graph: European Market Year-to-Year Growth 1980-2023F
- Graph: Japanese Market Year-to-Year Growth 1980-2023F
- Graph: Chinese Market Year-to-Year Growth 1995-2023f
- Graph: Asia Pacific Market Year-to-Year Growth 1980-2023F
- Graph: ROW Market Year-to-Year Growth 1980-2023F
- Last Year - 2022
- Table: 2020-2022 Percent Change in Growth by Region
- Table: 2020-2022 Percent Share of Market by Region
- Equipment Sector Sales - 2020-2022
- Table: 2020-2022 Percent Change in Equipment Sales by Equipment Sector
- Table: 2022 World Sales by Equipment Sector
- Graph: 2022 World Connector Sales by Equipment Sector
- Graph: 2022 World Connector Market Top 5 Equipment Sectors
- Forecast
- 2023 and 2028 Forecast by End-Use Market
- 2023 and 2028 Forecast by Connector Category
- Mergers and Acquisitions
- Key Technology Trends 2023
- Lead Times
- Price Trends
CHAPTER 2 - 2022 SIGNIFICANT EVENTS
CHAPTER 3 - CONSOLIDATED KEY PERFORMANCE MEASURES
- Consolidated Key Performance Measures
- Key Financial Measurements (2011-2021)
- Charts: Key Financial Measurements
- Balance Sheet $ (2012-2022)
- Balance Sheet % (2012-2022)
- Income Statement $ (2012-2022)
- Income Statement % (2012-2022)
- Performance History by Company
- Selected Connector Manufacturers
- Cost-of-Goods Sold
- Cost of Goods Sold % (2008-2022)
- Selling, General & Administrative (SG&A)
- Selling, General, & Administrative % (2008-2022)
- COGS+SG&A
- COGS + SG&A % (2008-2022)
- Net Income History
- Net Income % (2008-2022)
- Current Ratio
- Current Ratio (2008-2022)
- Return on Assets
- Return on Assets (2008-2022)
- Return on Equity
- Return on Equity (2008-2022)
- Long Term Debt/Equity
- Long Term Debt/Equity (2008-2022)
- Liabilities to Equity
- Liabilities to Equity (2008-2022)
- Accounts Receivable Turnover
- Accounts Receivables Turnover (2008-2022)
- Average Collection Period
- Average Collection Period (2008-2022)
- Inventory Turns
- Inventory Turns (2008-2022)
- Days Inventory
- Days Inventory (2008-2022)
CHAPTER 4 - PERFORMANCE HISTORY OF SELECTED COMPANIES
Performance History of Selected Companies
Amphenol Corporation
- Key Financial Measurements
Charts: Key Financial Measurements
- Balance Sheet $ (2012-2022)
- Balance Sheet % (2012-2022)
- Income Statement $ (2012-2022)
- Income Statement % (2012-2022)
Cheng Uei Precision Co. Ltd. (Foxlink)
- Key Financial Measurements
- Charts: Key Financial Measurements
- Balance Sheet $ (2012-2022)
- Balance Sheet % (2012-2022)
- Income Statement $ (2012-2022)
- Income Statement % (2012-2022)
FIT Hon Teng Ltd.
- Key Financial Measurements
- Charts: Key Financial Measurements
- Balance Sheet $ (2013-2022)
- Balance Sheet % (2013-2022)
- Income Statement $ (2013-2022)
- Income Statement % (2013-2022)
Hirose Electric Co., Ltd.
- Key Financial Measurements
- Charts: Key Financial Measurements
- Balance Sheet $ (2012-2022)
- Balance Sheet % (2012-2022)
- Income Statement $ (2012-2022)
- Income Statement % (2012-2022)
Hosiden
- Key Financial Measurements
- Charts: Key Financial Measurements
- Balance Sheet $ (2012-2022)
- Balance Sheet % (2012-2022)
- Income Statement $ (2012-2022)
- Income Statement % (2012-2022)
HUBER+SUHNER
- Key Financial Measurements
- Charts: Key Financial Measurements
- Balance Sheet $ (2012-2022)
- Balance Sheet % (2012-2022)
- Income Statement $ (2012-2022)
- Income Statement % (2012-2022)
Japan Aviation Electronics Industry (JAE), Limited
- Key Financial Measurements
- Charts: Key Financial Measurements
- Balance Sheet $ (2012-2022)
- Balance Sheet % (2012-2022)
- Income Statement $ (2012-2022)
- Income Statement % (2012-2022
Korea Electric Terminal Co. Ltd.
- Key Financial Measurements
- Charts: Key Financial Measurements
- Balance Sheet $ (2013-2022)
- Balance Sheet % (2013-2022)
- Income Statement $ (2013-2022)
- Income Statement % (2013-2022)
SMK
- Key Financial Measurements
- Charts: Key Financial Measurements
- Balance Sheet $ (2012-2022)
- Balance Sheet % (2012-2022)
- Income Statement $ (2012-2022)
- Income Statement % (2012-2022)
TE Connectivity
- Key Financial Measurements
- Charts: Key Financial Measurements
- Balance Sheet $ (2012-2022)
- Balance Sheet % (2012-2022)
- Income Statement $ (2012-2022)
- Income Statement % (2012-2022)
 2024 年连接器世界市场报告
 全球液压流体连接器市场研究报告 - 2024 年至 2032 年行业分析、规模、份额、成长、趋势和预测
 全球连接器市场手册
 无菌连接器市场:全球和区域分析 - 按类型、产品、最终用户和地区分析和预测(2023-2033)
 卡连接器市场,按产品类型、最终用途、应用、国家和地区 - 2024-2032 年行业分析、市场规模、市场份额和预测
 非接触式连接器的全球市场:市场规模和占有率分析 - 趋势、驱动因素、竞争格局、未来预测(2024-2030)
 非接触式连接器的全球市场:按产品类型、技术、营运、资料速率 - 预测(至 2029 年)
 全球连接器市场规模、份额、成长分析,依产品类型(PCB 连接器、I/O 连接器)、最终用户(消费性电子产品、电信)- 2024-2031 年产业预测
 电缆连接器:市场占有率分析、产业趋势与统计、成长预测(2024-2029)
 2024 年高电压接线连接器全球市场报告