


 |
市场调查报告书
商品编码
1757090
连接器产业年鑑:2025年2025 Connector Industry Yearbook |
||||||
Bishop & Associates 每年都会根据上市连接器公司提供的年鑑编製 "连接器产业年鑑" 。年鑑会整合过去 10 年、5 年和当年的损益表和资产负债表,为产业和上市公司的整体绩效提供基准。
此外,本报告也回顾了连接器产业2014年至2024年按地区和终端设备细分市场的收入情况,以及我们对2025年和2030年按地区和终端设备细分市场的最新预测。
本报告的特点
上市公司的合併历史记录,包括:
- 主要财务指标(2014年~2024年)
- 资产负债表 (2014年~2024年)
- 损益清单 (2014年~2024年)
- 资产负债表百分率(2014年~2024年)
- 损益清单百分率(2014年~2024年)
使用以下财务指标的行业平均值,按公司划分的15年业绩趋势指标:
- 销售、一般及管理费用 (2010-2024)
- 净利率 (2010-2024)
- 资产报酬率 (2010-2024)
- 长期负债/权益比率 (2010-2024)
- 应收帐款週转率 (2010-2024)
- 存货週转率 (2010-2024)
- 销售成本比率 (2010-2024)
- 销售成本+销售、一般及管理费用比率 (2010-2024)
- 流动比率 (2010-2024)
- 股权报酬率 (2010-2024)
- 负债权益比(2010-2024)
- 平均投资回收期 (2010-2024)
- 库存天数 (2010-2024)
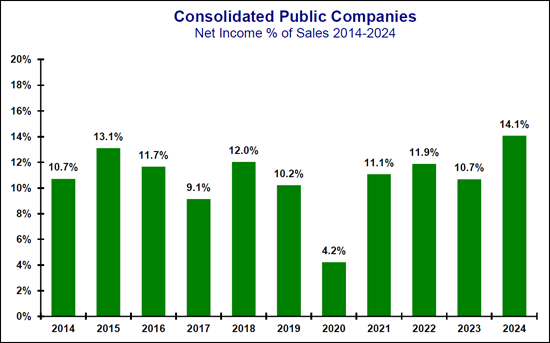
2024 年年鑑公司净利占销售额的百分比
下表显示了 2025 年连接器产业年鑑中上市公司 2014 年至 2024 年的净利润占销售额的百分比。
净利
2024 年连接器产业平均净利占销售额的 14.1%。 2018年对美国来说是重要的一年,因为这一年 "减税与就业法案" 获得通过。该法案将联邦企业税率从35%降至21%。受全球新冠疫情影响,2020年净利占销售额的比重降至最低,仅4.2%。 2015年至2019年,净利润占销售额的比例从2015年的13.1%下降到2019年的10.2%。 2020年至2024年,净利润占销售额的比例从2020年的4.2%上升到2024年的14.1%。
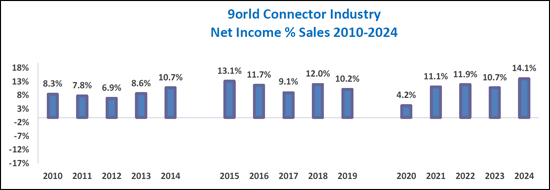
下图是2010年至2024年连接器产业净利的历史走势。
目录
开端
第1章 全球电子连接器产业
- 过去10年(2014年~2024年)
- 过去5年(2019年~2024年)
- 去年~2024年
- 设备部门的销售额(2022年~2024年)
- 设备各部门销售额
- 各地区2025年和2030年的预测
- 主要的技术趋势
- 前置作业时间
- 价格趋势
第2章 重要的事件
第3章 -连合主要业绩评估指标
整合主要业绩指标
各企业业绩履历
销货成本
销售费及一般管理费(SG&A)
销货成本+销售费及一般管理费
净利的转变
流动比率
资产报酬率
股本报酬率
长期债务/资本
负债对资本
应收账款週转率
平均收集期间
存货週转率
库存日数
第4章 选择企业的业绩履历
主要企业的业绩履历
Amphenol Corporatio
- 主要财务指标
- 表(图表):主要财务指标
- 资产负债表(美元)(2014年~2024年)
- 资产负债表(%)(2014年~2024年)
- 损益清单(美元)(2014年~2024年)
- 损益清单的比例(2014年~2024年)
Cheng Uei Precision Co. Ltd. (Foxlink)
- 主要财务指标
- 表(图表):主要财务指标
- 资产负债表(美元)(2014年~2024年)
- 资产负债表(%)(2014年~2024年)
- 损益清单(美元)(2014年~2024年)
- 损益清单的比例(2014年~2024年)
FIT Hon Teng Ltd
- 主要财务指标
- 表(图表):主要财务指标
- 资产负债表(美元)(2014年~2024年)
- 资产负债表(%)(2014年~2024年)
- 损益清单(美元)(2014年~2024年)
- 损益清单的比例(2014年~2024年)
Hirose Electric Co., Ltd
- 主要财务指标
- 表(图表):主要财务指标
- 资产负债表(美元)(2014年~2024年)
- 资产负债表(%)(2014年~2024年)
- 损益清单(美元)(2014年~2024年)
- 损益清单的比例(2014年~2024年)
Hosiden
- 主要财务指标
- 表(图表):主要财务指标
- 资产负债表(美元)(2014年~2024年)
- 资产负债表(%)(2014年~2024年)
- 损益清单(美元)(2014年~2024年)
- 损益清单的比例(2014年~2024年)
HUBER+SUHNER
- 主要财务指标
- 表(图表):主要财务指标
- 资产负债表(美元)(2014年~2024年)
- 资产负债表(%)(2014年~2024年)
- 损益清单(美元)(2014年~2024年)
- 损益清单的比例(2014年~2024年)
Japan Aviation Electronics Industry (JAE), Limited
- 主要财务指标
- 表(图表):主要财务指标
- 资产负债表(美元)(2014年~2024年)
- 资产负债表(%)(2014年~2024年)
- 损益清单(美元)(2014年~2024年)
- 损益清单的比例(2014年~2024年)
Korea Electric Terminal Co. Ltd.
- 主要财务指标
- 表(图表):主要财务指标
- 资产负债表(美元)(2014年~2024年)
- 资产负债表(%)(2014年~2024年)
- 损益清单(美元)(2014年~2024年)
- 损益清单的比例(2014年~2024年)
SMK
- 主要财务指标
- 表(图表):主要财务指标
- 资产负债表(美元)(2014年~2024年)
- 资产负债表(%)(2014年~2024年)
- 损益清单(美元)(2014年~2024年)
- 损益清单的比例(2014年~2024年)
TE Connectivity
- 主要财务指标
- 表(图表):主要财务指标
- 资产负债表(美元)(2014年~2024年)
- 资产负债表(%)(2014年~2024年)
- 损益清单(美元)(2014年~2024年)
- 损益清单的比例(2014年~2024年)
Each year, Bishop & Associates prepares the Connector Industry Yearbook based on annual reports provided by publicly traded connector companies. Income statements and balance sheets are consolidated for the past 10 years, five years, and most current year, providing benchmarks on the industry and the overall performance of the public connector companies.
In addition, the report provides a review of the connector industry for the period 2014-2024 for sales by region, end-use equipment sector and our current forecast for 2025 and 2030 by region and end-use equipment sector.
This report features:
Consolidated history of the public companies including:
- Key Financial Measurements (2014-2024)
- Balance Sheet $ (2014-2024)
- Income Statement $ (2014-2024)
- Balance Sheet percent (2014-2024)
- Income Statement percent (2014-2024)
Fifteen-year history of performance by company, with industry averages for the following financial measurements:
- Selling, General, & Administrative percent (2010-2024)
- Net Income percent (2010-2024)
- Return on Assets (2010-2024)
- Long Term Debt/Equity (2010-2024)
- Accounts Receivables Turnover (2010-2024)
- Inventory Turns (2010-2024)
- Cost of Goods Sold percent (2010-2024)
- COGS + SG&A percent (2010-2024)
- Current Ratio (2010-2024)
- Return on Equity (2010-2024)
- Liabilities to Equity (2010-2024)
- Average Collection Period (2010-2024)
- Days Inventory (2010-2024)
2024 Yearbook Companies Net Income as a Percent of Sales
The following table provides Net Income as a percent of sales from 2014-2024 for public companies included in the 2025 Connector Industry Yearbook.
Net Income
In 2024 the connector industry had an average net income of 14.1% of sales. 2018 was a significant year in the United States because it was the year the Tax Cuts and Jobs Act was passed. This act reduced the federal corporate income tax from 35% to 21%. As a result of the worldwide COVID pandemic, the lowest net income as a percent of sales occurred in 2020 at 4.2%. Between 2015 and 2019, net income decreased from 13.1% of sales in 2015 to 10.2% of sales in 2019. Between 2020 and 2024, net income increased from 4.2% in 2020 to 14.1% in 2024.
The following chart provides a history of net income for the Connector Industry from 2010-2024.
TABLE OF CONTENTS
PROLOGUE
CHAPTER 1 - THE WORLD ELECTRONIC CONNECTOR INDUSTRY
- The Last Ten Years (2014-2024)
- Table: Sales by Geographic Region
- Graph: Change by Region 2014 vs 2024
- The Last Five Years (2019-2024)
- Table: Sales by Geographic Region
- Graph: World Connector Industry - Year-To-Year Percent
- Change in Growth 1980-2025F
- Graph: North American Market Year-to-Year Growth 1980-2025F
- Graph: European Market Year-to-Year Growth 1980-2025F
- Graph: Japanese Market Year-to-Year Growth 1980-2025F
- Graph: Chinese Market Year-to-Year Growth 1995-2025F
- Graph: Asia Pacific Market Year-to-Year Growth 1980-2025F
- Graph: ROW Market Year-to-Year Growth 1980-2025F
- Last Year - 2024
- Table: 2022, 2023 and 2024 Percent Change in Growth Region
- Table: 2022, 2023 and 2024 Percent Share of Market by Region
- Equipment Sector Sales - 2022-2024
- Table: 2022-2024 Percent Change in Equipment Sales by Equipment Sector
- Graph: 2023-2024 Percent Change World Connector
- Sales by Equipment Sector
- Table: 2024 World Sales by Equipment Sector
- Graph: 2024 World Connector Market Top 5 Equipment Sectors
- Forecast 2025 and 2030 by Region
- Table: 2025 & 2030 Forecast by End-Use Market
- Graph: 2025 and 2030 End-Use Market Five-Year CAGR Mergers and Acquisitions
- Key Technology Trends
- Lead Times
- Price Trends
CHAPTER 2 - SIGNIFICANT EVENTS
CHAPTER 3 - CONSOLIDATED KEY PERFORMANCE MEASURES
Consolidated Key Performance Measures
- Key Financial Measurements (2014-2024)
- Charts: Key Financial Measurements
- Balance Sheet $ (2014-2024)
- Balance Sheet % (2014-2024)
- Income Statement $ (2014-2024)
- Income Statement % (2014-2024)
Performance History by Company
- Selected Connector Manufacturers
Cost-of-Goods Sold
- Cost of Goods Sold % (2010-2024)
Selling, General & Administrative (SG&A)
- Selling, General, & Administrative % (2010-2024)
COGS+SG&A
- COGS + SG&A % (2010-2024)
Net Income History
- Net Income % (2010-2024)
Current Ratio
- Current Ratio (2010-2024)
Return on Assets
- Return on Assets (2010-2024)
Return on Equity
- Return on Equity (2010-2024)
Long Term Debt/Equity
- Long Term Debt/Equity (2010-2024)
Liabilities to Equity
- Liabilities to Equity (2010-2024)
Accounts Receivable Turnover
- Accounts Receivables Turnover (2010-2024)
Average Collection Period
- Average Collection Period (2010-2024)
Inventory Turns
- Inventory Turns (2010-2024)
Days Inventory
- Days Inventory (2010-2024)
CHAPTER 4 - PERFORMANCE HISTORY OF SELECTED COMPANIES
Performance History of Selected Companies
Amphenol Corporation
- Key Financial Measurements
- Charts: Key Financial Measurements
- Balance Sheet $ (2014-2024)
- Balance Sheet % (2014-2024)
- Income Statement $ (2014-2024)
- Income Statement % (2014-2024)
Cheng Uei Precision Co. Ltd. (Foxlink)
- Key Financial Measurements
- Charts: Key Financial Measurements
- Balance Sheet $ (2014-2024)
- Balance Sheet % (2014-2024)
- Income Statement $ (2014-2024)
- Income Statement % (2014-2024)
FIT Hon Teng Ltd
- Key Financial Measurements
- Charts: Key Financial Measurements
- Balance Sheet $ (2014-2024)
- Balance Sheet % (2014-2024)
- Income Statement $ (2014-2024)
- Income Statement % (2014-2024)
Hirose Electric Co., Ltd
- Key Financial Measurements
- Charts: Key Financial Measurements
- Balance Sheet $ (2014-2024)
- Balance Sheet % (2014-2024)
- Income Statement $ (2014-2024)
- Income Statement % (2014-2024)
Hosiden
- Key Financial Measurements
- Charts: Key Financial Measurements
- Balance Sheet $ (2014-2024)
- Balance Sheet % (2014-2024)
- Income Statement $ (2014-2024)
- Income Statement % (2014-2024)
HUBER+SUHNER
- Key Financial Measurements
- Charts: Key Financial Measurements
- Balance Sheet $ (2014-2024)
- Balance Sheet % (2014-2024)
- Income Statement $ (2014-2024)
- Income Statement % (2014-2024)
Japan Aviation Electronics Industry (JAE), Limited
- Key Financial Measurements
- Charts: Key Financial Measurements
- Balance Sheet $ (2014-2024)
- Balance Sheet % (2014-2024)
- Income Statement $ (2014-2024)
- Income Statement % (2014-2024)
Korea Electric Terminal Co. Ltd.
- Key Financial Measurements
- Charts: Key Financial Measurements
- Balance Sheet $ (2014-2024)
- Balance Sheet % (2014-2024)
- Income Statement $ (2014-2024)
- Income Statement % (2014-2024)
SMK
- Key Financial Measurements
- Charts: Key Financial Measurements
- Balance Sheet $ (2014-2024)
- Balance Sheet % (2014-2024)
- Income Statement $ (2014-2024)
- Income Statement % (2014-2024)
TE Connectivity
- Key Financial Measurements
- Charts: Key Financial Measurements
- Balance Sheet $ (2014-2024)
- Balance Sheet % (2014-2024)
- Income Statement $ (2014-2024)
- Income Statement % (2014-2024)
 半间距连接器市场报告:趋势、预测和竞争分析(至2035年)SCSI连接器市场报告:趋势、预测和竞争分析(至2035年)平面印刷电路基板连接器市场报告:趋势、预测与竞争分析(至2035年)插座连接器市场报告:趋势、预测和竞争分析(至2035年)D-Sub微型连接器市场报告:趋势、预测和竞争分析(至2035年)铁路电源连接器市场报告:趋势、预测和竞争分析(至2035年)
 2026年全球抬头显示器(HUD)波形合成器市场报告2026年全球空间连结器市场报告
 全球军用连接器市场规模、份额、趋势和成长分析报告(2026-2034年)
 连接器市场商机、成长要素、产业趋势分析及 2026-2035 年预测。