


 |
市场调查报告书
商品编码
1151972
Volt/VAR系统全球市场规模调查,按解决方案(电压/VAR控制、配电电压优化、维护电压降低、配电电压/VAR控制)2022-2028区域预测Global Volt/VAR systems Market Size study, By Solution (Volt/VAR Control, Distribution Voltage Optimization, Conservation Voltage Reduction, Distribution Volt/VAR Control), and Regional Forecasts 2022-2028 |
||||||
VVO(电压/无功优化)是指优化管理电压和无功功率以实现更高效的电网运行的过程。
VVO 系统调节无功功率并管理电压,以抵消太阳能对电网的影响。 Volt-VAR 系统由各种组件组成,包括硬件和软件。全球电力需求不断增长、可再生能源的日益整合、对能源效率和系统电压的兴趣日益浓厚,这些都是推动全球市场需求的因素。例如,国际能源署(IEA)公布,2019年全球总用电量达到22848太瓦时,比2018年增长超过1.7%。此外,2020 年英国用电量估计为 287.32 TWh,到 2021 年将进一步上升至 294.4 TWh。此外,市场领导者正在推出创新解决方案,以利用对 Vola/VAR 系统不断增长的需求。例如,2019 年 2 月,总部位于法国的施耐德电气宣布推出 Ecostruxure Power 2.0。 EcoStruxure Power 架构使用 EcoStruxure Microgrid Operation 来管理分布式能源 (DER) 和保护系统,以提高微电网的稳定性和效率。此外,配电行业自动化程度的提高和对新可再生能源项目投资的增加预计将在预测期内刺激市场需求。然而,与 Volt/VAR 系统相关的高安装成本阻碍了 2022-2028 年预测期内的市场增长。
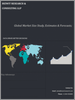
Volt/VAR 系统全球市场研究考虑的主要区域是亚太地区、北美、欧洲、拉丁美洲和世界其他地区。由于电力和配电行业的增长以及主要参与者的存在,北美在市场份额方面已成为世界领先地区。另一方面,预计亚太地区在 2022-2028 年的预测期内将呈现显着的增长率。可再生能源行业的蓬勃发展和该地区用电量的增加等因素将为亚太地区的 Volt/VAR 系统市场创造良好的增长前景。
本报告中包含的主要市场参与者包括:
- ABB
- General Electric Company
- Schneider Electric
- Siemens AG
- Silver Spring Networks
- Beckwith Electric Co., Inc
- Eaton
- GRIDCO SYSTEMS
- S&C Electric Company
- Varentec
这项研究的目的是确定近年来各个细分市场和国家/地区的市场规模,并预测未来八年的价值。本报告旨在捕捉每个被调查地区和国家的行业定性和定量方面的情况。此外,它还提供了有关关键方面的详细信息,例如将定义市场未来增长的驱动因素和挑战。此外,该报告还应包含对主要参与者的竞争格局和产品供应的详细分析,以及微观市场中可供利益相关者投资的可用机会。市场的详细细分和子细分如下所述。
按解决方案
电压/无功控制
配电电压优化
降低存储电压
配电电压/VAR 控制
按地区
北美
美国
加拿大
欧洲
英国
德国
法国
西班牙
意大利
其他欧洲
亚太地区
中国
印度
日本
澳大利亚
韩国
其他亚太地区
拉丁美洲
巴西
墨西哥
世界其他地方
此外,本研究中考虑的年份是:
实际年份 - 2018, 2019, 2020
基准年 2021
预测期:2022-2028
本报告的目标受众是全球 Volt/VAR 系统市场。
主要咨询公司和顾问
大公司、中型公司、中小企业
风险投资
增值经销商 (VAR)
第三方知识提供者
投资银行家
投资人
内容
第 1 章执行摘要
- 市场概况
- 2020-2028 年全球市场细分的估计和预测
- 2020 年至 2028 年按地区分列的全球伏特/无功功率系统市场
- 2020-2028 年按解决方案划分的 Volt/VAR 系统全球市场
- 主要趋势
- 调查方法
- 调查先决条件
第 2 章 Volt/VAR 系统全球市场的定义和范围
- 调查的目的
- 市场定义和范围
- 调查范围
- 工业发展
- 调查年份
- 货币兑换率
第 3 章 Volt/VAR 系统的全球市场动态
- Volt/VAR 系统市场影响分析(2020 年至 2028 年)
- 市场驱动因素
- 全球电力需求增加
- 可再生能源并网规模不断扩大
- 人们越来越关注能效和系统电压
- 市场挑战
- 初始成本高
- 市场机会
- 推动配电行业的自动化
- 增加对可再生能源项目的投资
- 市场驱动因素
第 4 章全球电压/VAR 系统市场行业分析
- 波特 5 力模型
- 供应商的议价能力
- 买家的议价能力
- 新进入者的威胁
- 替代品的威胁
- 竞争公司之间的敌对关係
- 波特 5 力模型的未来方法 (2018-2028)
- 害虫分析
- 政治
- 经济的
- 社交
- 技术
- 投资招聘模式
- 分析师的结论和建议
- 顶级投资机会
- 关键成功策略
第 5 章风险评估:COVID-19 的影响
- 评估 COVID-19 对行业的总体影响
- COVID-19 之前和 COVID-19 之后的市场情景
第 6 章全球 Volt/VAR 系统市场,按解决方案
- 市场概况
- Volt/VAR 系统全球市场:按解决方案分类的性能、潜力分析
- 2018-2028 年 Volt/VAR 系统全球市场、按解决方案估算和预测
- Volt/VAR 系统全球市场细分分析
- VOLT/VAR 控制
- 优化配电电压
- 降低存储电压
- 配电 VOLT/VAR 控制
第 7 章全球 Volt/VAR 系统市场,区域分析
- Volt/VAR 系统市场,区域市场概况
- 北美
- 美国
- 2018-2028 年解决方案的估计和预测
- 加拿大
- 美国
- 欧洲 Volt/VAR 系统市场概况
- 英国
- 德国
- 法国
- 西班牙
- 意大利
- 其他欧洲地区
- 亚太地区 Volt/VAR 系统市场概况
- 中国
- 印度
- 日本
- 澳大利亚
- 韩国
- 其他亚太地区
- 拉丁美洲 Volt/VAR 系统市场概况
- 巴西
- 墨西哥
- 世界其他地区
第 8 章衝突信息
- 顶级市场策略
- 公司简介
- ABB
- 主要信息
- 概览
- 财务(取决于数据可用性)
- 产品概览
- 近期发展状况
- General Electric Company
- Schneider Electric
- Siemens AG
- Silver Spring Networks
- Beckwith Electric Co., Inc
- Eaton
- GRIDCO SYSTEMS
- S&C Electric Company
- Varentec
- ABB
第 9 章研究过程
- 研究过程
- 数据挖掘
- 分析
- 市场评估
- 验证
- 出版
- 调查属性
- 调查先决条件
Global Volt/VAR systems Market is valued approximately USD XX million in 2021 and is anticipated to grow with a healthy growth rate of more than XX % over the forecast period 2022-2028.
Volt/VAR optimization (VVO) refers to a process of optimally managing voltage levels and reactive power to achieve more efficient gird operation. Volt-VAr Systems regulate reactive power to manage voltage and offsets the impact of solar generation on the grid. Volt/VAR System comprised of different components such as hardware, and software. The rising electricity demand worldwide and growing expansion of renewable power integration as well as increasing concern over energy efficiency and system voltages are factors that are accelerating the global market demand. For instance, as per International Energy Agency (IEA)- In 2019, total electricity consumption worldwide reached to 22 848 TWh, witnessing an increase of over 1.7% from 2018. Furthermore, in 2020, the UK's electricity consumption was estimated at 287.32 TWh and it further increased to 294.4 TWh in 2021. Further, leading market players are coming up with innovative solutions to leverage the growing demand for Vola/VAR Systems. For instance, In February 2019, France based Schneider Electric unveiled the Ecostruxure Power 2.0. The EcoStruxure Power architecture uses EcoStruxure Microgrid Operation to manage the Distributed Energy Resources (DER) and the protection systems for increased microgrid stability and efficiency. Also, growing automation in Power distribution Sector and increasing investment towards new renewable energy projects are anticipated to act as a catalyzing factor for the market demand during the forecast period. However, high deployment cost associated with Volt/VAR systems impede the growth of the market over the forecast period of 2022-2028.
The key regions considered for the global Volt/VAR systems Market study include Asia Pacific, North America, Europe, Latin America, and the Rest of the World. North America is the leading region across the world in terms of market share owing to the growing power and distribution sector as well as presence of leading market players. Whereas, Asia Pacific is anticipated to exhibit a significant growth rate over the forecast period 2022-2028. Factors such as the thriving growth of the renewable energy sector and rising electricity consumption in the region, would create lucrative growth prospects for the Volt/VAR systems Market across the Asia Pacific region.
Major market players included in this report are:
ABB
General Electric Company
Schneider Electric
Siemens AG
Silver Spring Networks
Beckwith Electric Co., Inc
Eaton
GRIDCO SYSTEMS
S&C Electric Company
Varentec
The objective of the study is to define market sizes of different segments & countries in recent years and to forecast the values to the coming eight years. The report is designed to incorporate both qualitative and quantitative aspects of the industry within each of the regions and countries involved in the study. Furthermore, the report also caters the detailed information about the crucial aspects such as driving factors & challenges which will define the future growth of the market. Additionally, the report shall also incorporate available opportunities in micro markets for stakeholders to invest along with the detailed analysis of competitive landscape and product offerings of key players. The detailed segments and sub-segment of the market are explained below:
By Solution
Volt/VAR Control
Distribution Voltage Optimization
Conservation Voltage Reduction
Distribution Volt/VAR Control
By Region:
North America
U.S.
Canada
Europe
UK
Germany
France
Spain
Italy
ROE
Asia Pacific
China
India
Japan
Australia
South Korea
RoAPAC
Latin America
Brazil
Mexico
Rest of the World
Furthermore, years considered for the study are as follows:
Historical year - 2018, 2019, 2020
Base year - 2021
Forecast period: 2022 to 2028
Target Audience of the Global Volt/VAR systems Market in Market Study:
Key Consulting Companies & Advisors
Large, medium-sized, and small enterprises
Venture capitalists
Value-Added Resellers (VARs)
Third-party knowledge providers
Investment bankers
Investors
Table of Contents
Chapter 1. Executive Summary
- 1.1. Market Snapshot
- 1.2. Global & Segmental Market Estimates & Forecasts, 2020-2028 (USD Million)
- 1.2.1. Global Volt/VAR systems Market, by Region, 2020-2028 (USD Million)
- 1.2.2. Global Volt/VAR systems Market, by Solution, 2020-2028 (USD Million)
- 1.3. Key Trends
- 1.4. Estimation Methodology
- 1.5. Research Assumption
Chapter 2. Global Volt/VAR systems Market Definition and Scope
- 2.1. Objective of the Study
- 2.2. Market Definition & Scope
- 2.2.1. Scope of the Study
- 2.2.2. Industry Evolution
- 2.3. Years Considered for the Study
- 2.4. Currency Conversion Rates
Chapter 3. Global Volt/VAR systems Market Dynamics
- 3.1. Volt/VAR systems Market Impact Analysis (2020-2028)
- 3.1.1. Market Drivers
- 3.1.1.1. Growing electricity demand worldwide.
- 3.1.1.2. Rising expansion of renewable power integration
- 3.1.1.3. Increasing concern over energy efficiency and system voltages
- 3.1.2. Market Challenges
- 3.1.2.1. High initial cost requirement.
- 3.1.3. Market Opportunities
- 3.1.3.1. Growing automation in Power distribution Sector.
- 3.1.3.2. Increasing investment towards new renewable energy projects.
- 3.1.1. Market Drivers
Chapter 4. Global Volt/VAR systems Market Industry Analysis
- 4.1. Porter's 5 Force Model
- 4.1.1. Bargaining Power of Suppliers
- 4.1.2. Bargaining Power of Buyers
- 4.1.3. Threat of New Entrants
- 4.1.4. Threat of Substitutes
- 4.1.5. Competitive Rivalry
- 4.1.6. Futuristic Approach to Porter's 5 Force Model (2018-2028)
- 4.2. PEST Analysis
- 4.2.1. Political
- 4.2.2. Economical
- 4.2.3. Social
- 4.2.4. Technological
- 4.3. Investment Adoption Model
- 4.4. Analyst Recommendation & Conclusion
- 4.5. Top investment opportunity
- 4.6. Top winning strategies
Chapter 5. Risk Assessment: COVID-19 Impact
- 5.1.1. Assessment of the overall impact of COVID-19 on the industry
- 5.1.2. Pre COVID-19 and post COVID-19 Market scenario
Chapter 6. Global Volt/VAR systems Market, by Solution
- 6.1. Market Snapshot
- 6.2. Global Volt/VAR systems Market by Solution, Performance - Potential Analysis
- 6.3. Global Volt/VAR systems Market Estimates & Forecasts by Solution 2018-2028 (USD Million)
- 6.4. Volt/VAR systems Market, Sub Segment Analysis
- 6.4.1. VOLT/VAR Control
- 6.4.2. Distribution Voltage Optimization
- 6.4.3. Conservation Voltage Reduction
- 6.4.4. Distribution VOLT/VAR Control
Chapter 7. Global Volt/VAR systems Market, Regional Analysis
- 7.1. Volt/VAR systems Market, Regional Market Snapshot
- 7.2. North America Volt/VAR systems Market
- 7.2.1. U.S. Volt/VAR systems Market
- 7.2.1.1. Solution estimates & forecasts, 2018-2028
- 7.2.2. Canada Volt/VAR systems Market
- 7.2.1. U.S. Volt/VAR systems Market
- 7.3. Europe Volt/VAR systems Market Snapshot
- 7.3.1. U.K. Volt/VAR systems Market
- 7.3.2. Germany Volt/VAR systems Market
- 7.3.3. France Volt/VAR systems Market
- 7.3.4. Spain Volt/VAR systems Market
- 7.3.5. Italy Volt/VAR systems Market
- 7.3.6. Rest of Europe Volt/VAR systems Market
- 7.4. Asia-Pacific Volt/VAR systems Market Snapshot
- 7.4.1. China Volt/VAR systems Market
- 7.4.2. India Volt/VAR systems Market
- 7.4.3. Japan Volt/VAR systems Market
- 7.4.4. Australia Volt/VAR systems Market
- 7.4.5. South Korea Volt/VAR systems Market
- 7.4.6. Rest of Asia Pacific Volt/VAR systems Market
- 7.5. Latin America Volt/VAR systems Market Snapshot
- 7.5.1. Brazil Volt/VAR systems Market
- 7.5.2. Mexico Volt/VAR systems Market
- 7.6. Rest of The World Volt/VAR systems Market
Chapter 8. Competitive Intelligence
- 8.1. Top Market Strategies
- 8.2. Company Profiles
- 8.2.1. ABB
- 8.2.1.1. Key Information
- 8.2.1.2. Overview
- 8.2.1.3. Financial (Subject to Data Availability)
- 8.2.1.4. Product Summary
- 8.2.1.5. Recent Developments
- 8.2.2. General Electric Company
- 8.2.3. Schneider Electric
- 8.2.4. Siemens AG
- 8.2.5. Silver Spring Networks
- 8.2.6. Beckwith Electric Co., Inc
- 8.2.7. Eaton
- 8.2.8. GRIDCO SYSTEMS
- 8.2.9. S&C Electric Company
- 8.2.10. Varentec
- 8.2.1. ABB
Chapter 9. Research Process
- 9.1. Research Process
- 9.1.1. Data Mining
- 9.1.2. Analysis
- 9.1.3. Market Estimation
- 9.1.4. Validation
- 9.1.5. Publishing
- 9.2. Research Attributes
- 9.3. Research Assumption
LIST OF TABLES
- TABLE 1. Global Volt/VAR systems Market, report scope
- TABLE 2. Global Volt/VAR systems Market estimates & forecasts by Region 2018-2028 (USD Million)
- TABLE 3. Global Volt/VAR systems Market estimates & forecasts by Solution 2018-2028 (USD Million)
- TABLE 4. Global Volt/VAR systems Market by segment, estimates & forecasts, 2018-2028 (USD Million)
- TABLE 5. Global Volt/VAR systems Market by region, estimates & forecasts, 2018-2028 (USD Million)
- TABLE 6. Global Volt/VAR systems Market by segment, estimates & forecasts, 2018-2028 (USD Million)
- TABLE 7. Global Volt/VAR systems Market by region, estimates & forecasts, 2018-2028 (USD Million)
- TABLE 8. Global Volt/VAR systems Market by segment, estimates & forecasts, 2018-2028 (USD Million)
- TABLE 9. Global Volt/VAR systems Market by region, estimates & forecasts, 2018-2028 (USD Million)
- TABLE 10. Global Volt/VAR systems Market by segment, estimates & forecasts, 2018-2028 (USD Million)
- TABLE 11. Global Volt/VAR systems Market by region, estimates & forecasts, 2018-2028 (USD Million)
- TABLE 12. Global Volt/VAR systems Market by segment, estimates & forecasts, 2018-2028 (USD Million)
- TABLE 13. Global Volt/VAR systems Market by region, estimates & forecasts, 2018-2028 (USD Million)
- TABLE 14. U.S. Volt/VAR systems Market estimates & forecasts, 2018-2028 (USD Million)
- TABLE 15. U.S. Volt/VAR systems Market estimates & forecasts by segment 2018-2028 (USD Million)
- TABLE 16. U.S. Volt/VAR systems Market estimates & forecasts by segment 2018-2028 (USD Million)
- TABLE 17. Canada Volt/VAR systems Market estimates & forecasts, 2018-2028 (USD Million)
- TABLE 18. Canada Volt/VAR systems Market estimates & forecasts by segment 2018-2028 (USD Million)
- TABLE 19. Canada Volt/VAR systems Market estimates & forecasts by segment 2018-2028 (USD Million)
- TABLE 20. UK Volt/VAR systems Market estimates & forecasts, 2018-2028 (USD Million)
- TABLE 21. UK Volt/VAR systems Market estimates & forecasts by segment 2018-2028 (USD Million)
- TABLE 22. UK Volt/VAR systems Market estimates & forecasts by segment 2018-2028 (USD Million)
- TABLE 23. Germany Volt/VAR systems Market estimates & forecasts, 2018-2028 (USD Million)
- TABLE 24. Germany Volt/VAR systems Market estimates & forecasts by segment 2018-2028 (USD Million)
- TABLE 25. Germany Volt/VAR systems Market estimates & forecasts by segment 2018-2028 (USD Million)
- TABLE 26. RoE Volt/VAR systems Market estimates & forecasts, 2018-2028 (USD Million)
- TABLE 27. RoE Volt/VAR systems Market estimates & forecasts by segment 2018-2028 (USD Million)
- TABLE 28. RoE Volt/VAR systems Market estimates & forecasts by segment 2018-2028 (USD Million)
- TABLE 29. China Volt/VAR systems Market estimates & forecasts, 2018-2028 (USD Million)
- TABLE 30. China Volt/VAR systems Market estimates & forecasts by segment 2018-2028 (USD Million)
- TABLE 31. China Volt/VAR systems Market estimates & forecasts by segment 2018-2028 (USD Million)
- TABLE 32. India Volt/VAR systems Market estimates & forecasts, 2018-2028 (USD Million)
- TABLE 33. India Volt/VAR systems Market estimates & forecasts by segment 2018-2028 (USD Million)
- TABLE 34. India Volt/VAR systems Market estimates & forecasts by segment 2018-2028 (USD Million)
- TABLE 35. Japan Volt/VAR systems Market estimates & forecasts, 2018-2028 (USD Million)
- TABLE 36. Japan Volt/VAR systems Market estimates & forecasts by segment 2018-2028 (USD Million)
- TABLE 37. Japan Volt/VAR systems Market estimates & forecasts by segment 2018-2028 (USD Million)
- TABLE 38. RoAPAC Volt/VAR systems Market estimates & forecasts, 2018-2028 (USD Million)
- TABLE 39. RoAPAC Volt/VAR systems Market estimates & forecasts by segment 2018-2028 (USD Million)
- TABLE 40. RoAPAC Volt/VAR systems Market estimates & forecasts by segment 2018-2028 (USD Million)
- TABLE 41. Brazil Volt/VAR systems Market estimates & forecasts, 2018-2028 (USD Million)
- TABLE 42. Brazil Volt/VAR systems Market estimates & forecasts by segment 2018-2028 (USD Million)
- TABLE 43. Brazil Volt/VAR systems Market estimates & forecasts by segment 2018-2028 (USD Million)
- TABLE 44. Mexico Volt/VAR systems Market estimates & forecasts, 2018-2028 (USD Million)
- TABLE 45. Mexico Volt/VAR systems Market estimates & forecasts by segment 2018-2028 (USD Million)
- TABLE 46. Mexico Volt/VAR systems Market estimates & forecasts by segment 2018-2028 (USD Million)
- TABLE 47. RoLA Volt/VAR systems Market estimates & forecasts, 2018-2028 (USD Million)
- TABLE 48. RoLA Volt/VAR systems Market estimates & forecasts by segment 2018-2028 (USD Million)
- TABLE 49. RoLA Volt/VAR systems Market estimates & forecasts by segment 2018-2028 (USD Million)
- TABLE 50. Row Volt/VAR systems Market estimates & forecasts, 2018-2028 (USD Million)
- TABLE 51. Row Volt/VAR systems Market estimates & forecasts by segment 2018-2028 (USD Million)
- TABLE 52. Row Volt/VAR systems Market estimates & forecasts by segment 2018-2028 (USD Million)
- TABLE 53. List of secondary sources, used in the study of global Volt/VAR systems Market
- TABLE 54. List of primary sources, used in the study of global Volt/VAR systems Market
- TABLE 55. Years considered for the study
- TABLE 56. Exchange rates considered
LIST OF FIGURES
List of figures
- FIG 1. Global Volt/VAR systems Market, research methodology
- FIG 2. Global Volt/VAR systems Market, Market estimation techniques
- FIG 3. Global Market size estimates & forecast methods
- FIG 4. Global Volt/VAR systems Market, key trends 2021
- FIG 5. Global Volt/VAR systems Market, growth prospects 2022-2028
- FIG 6. Global Volt/VAR systems Market, porters 5 force model
- FIG 7. Global Volt/VAR systems Market, pest analysis
- FIG 8. Global Volt/VAR systems Market, value chain analysis
- FIG 9. Global Volt/VAR systems Market by segment, 2018 & 2028 (USD Million)
- FIG 10. Global Volt/VAR systems Market by segment, 2018 & 2028 (USD Million)
- FIG 11. Global Volt/VAR systems Market by segment, 2018 & 2028 (USD Million)
- FIG 12. Global Volt/VAR systems Market by segment, 2018 & 2028 (USD Million)
- FIG 13. Global Volt/VAR systems Market by segment, 2018 & 2028 (USD Million)
- FIG 14. Global Volt/VAR systems Market, regional snapshot 2018 & 2028
- FIG 15. North America Volt/VAR systems Market 2018 & 2028 (USD Million)
- FIG 16. Europe Volt/VAR systems Market 2018 & 2028 (USD Million)
- FIG 17. Asia pacific Market 2018 & 2028 (USD Million)
- FIG 18. Latin America Volt/VAR systems Market 2018 & 2028 (USD Million)
- FIG 19. Global Volt/VAR systems Market, company Market share analysis (2021)


