


 |
市场调查报告书
商品编码
1334606
2023-2030 年全球可解释人工智能市场规模研究与预测(按组件、部署、按应用、最终用途和区域分析)Global Explainable AI Market Size Study & Forecast, by Component, By Deployment, By Application, By End-use, and Regional Analysis, 2023-2030 |
||||||
2022 年全球可解释人工智能市场价值约为 54.9 亿美元,预计在 2023-2030 年预测期内将以超过 18.0% 的健康增长率增长。可解释的人工智能是指人工智能(AI)系统的开发,为其决策过程提供可理解和透明的解释。可解释的人工智能(XAI)是一个专注于开发解释人工智能模型决策的方法的研究领域。 XAI 很重要,因为它可以帮助用户了解人工智能模型的工作原理以及他们做出决策的原因。这有助于用户信任人工智能模型并更有效地使用它们。数字化趋势的不断上升、客户期望和用户体验的不断提高,再加上越来越多的政府优惠倡议,是推动全球市场需求的最突出因素。
此外,在估计期间,整个医疗保健领域可解释人工智能应用的增加也起到了催化因素的作用。可解释的人工智能用于医疗诊断和治疗建议,帮助医生和其他医疗保健专业人员理解和相信人工智能算法做出的判断。可解释的模型可以解释诊断,提供可行的疗法,并突出相关的医疗问题,使医疗保健专业人员能够做出更好的选择。据Statista分析,2021年全球医疗保健人工智能市场规模预计约为110.6亿美元。此外,预计该市场还将增长,到2025年将达到386.6亿美元,到2030年将达到187.95美元。因此,上述因素可能会推动全球市场扩张。此外,新兴技术进步和人工智能的发展,以及主要市场参与者不断增加的战略倡议,在预测几年内带来了各种利润丰厚的机会。然而,可解释的人工智能解决方案的高成本和熟练专业人员的缺乏正在阻碍整个 2023-2030 年预测期内的市场增长。
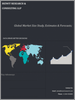
全球可解释人工智能市场研究考虑的关键区域包括亚太地区、北美、欧洲、拉丁美洲以及中东和非洲。由于拥有强大的 IT 基础设施以及对人工智能驱动的解决方案的需求激增,北美在 2022 年占据了市场主导地位。而亚太地区预计在预测年份将以最高的复合年增长率增长。对法规遵从性的日益增长的需求、XAI 研发投资的增加以及硬件和并行处理的不断进步正在显着推动整个地区的市场需求。
该研究的目的是确定近年来不同细分市场和国家的市场规模,并预测未来几年的价值。该报告旨在纳入参与研究的国家内该行业的定性和定量方面。
该报告还提供了有关驱动因素和挑战等关键方面的详细信息,这些因素将决定市场的未来增长。此外,它还纳入了利益相关者投资的微观市场的潜在机会,以及对主要参与者的竞争格局和产品供应的详细分析。 。
目录
第 1 章:执行摘要
- 市场概况
- 2020-2030 年全球和细分市场估计与预测
- 可解释的人工智能市场(按地区),2020-2030 年
- 可解释的人工智能市场(按组成部分),2020-2030 年
- 可解释的人工智能市场,按部署划分,2020-2030 年
- 可解释的人工智能市场,按应用划分,2020-2030 年
- 可解释的人工智能市场,按最终用途,2020-2030 年
- 主要趋势
- 估算方法
- 研究假设
第 2 章:全球可解释人工智能市场定义和范围
- 研究目的
- 市场定义和范围
- 行业演变
- 研究范围
- 研究考虑的年份
- 货币兑换率
第 3 章:全球可解释的人工智能市场动态
- 可解释的人工智能市场影响分析(2020-2030)
- 市场驱动因素
- 越来越多的有利政府倡议
- 可解释人工智能在医疗保健领域的应用增加
- 市场挑战
- 可解释的人工智能解决方案成本高昂
- 缺乏熟练的专业人员
- 市场机会
- 新兴技术进步和人工智能的发展
- 主要市场参与者的战略倡议数量不断增加
- 市场驱动因素
第 4 章:全球可解释人工智能市场行业分析
- 波特的五力模型
- 供应商的议价能力
- 买家的议价能力
- 新进入者的威胁
- 替代品的威胁
- 竞争竞争
- 波特的五力影响分析
- PEST分析
- 政治的
- 经济
- 社会的
- 技术性
- 环境的
- 合法的
- 顶级投资机会
- 最佳制胜策略
- COVID-19 影响分析
- 颠覆性趋势
- 行业专家视角
- 分析师推荐与结论
第 5 章:全球可解释人工智能市场(按组成部分)
- 市场概况
- 全球可解释人工智能市场(按组件、性能)-潜力分析
- 2020-2030 年全球可解释人工智能市场按组成部分的估计和预测
- 可解释的人工智能市场,细分市场分析
- 解决方案
- 服务
第 6 章:全球可解释人工智能市场(按部署)
- 市场概况
- 按部署、性能分類的全球可解释人工智能市场 - 潜力分析
- 2020-2030 年全球可解释人工智能市场部署预测
- 可解释的人工智能市场,细分市场分析
- 云
- 本地部署
第 7 章:全球可解释人工智能市场(按应用)
- 市场概况
- 全球可解释人工智能市场(按应用、性能)-潜力分析
- 2020-2030 年按应用分類的全球可解释人工智能市场估计和预测
- 可解释的人工智能市场,细分市场分析
- 欺诈和异常检测
- 药物发现与诊断
- 预测性维护
- 供应链管理
- 身份和访问管理
第 8 章:全球可解释人工智能市场(按最终用途)
- 市场概况
- 按最终用途、性能分類的全球可解释人工智能市场 - 潜力分析
- 2020-2030 年按最终用途分類的全球可解释人工智能市场估计和预测
- 可解释的人工智能市场,细分市场分析
- 卫生保健
- BFSI
- 航太与国防
- 零售和电子商务
- 信息技术与电信
- 其他的
第 9 章:全球可解释人工智能市场,区域分析
- 领先国家
- 顶级新兴国家
- 可解释的人工智能市场,区域市场概况
- 北美
- 我们
- 2020-2030 年组件细分估计和预测
- 2020-2030 年部署细分估计和预测
- 2020-2030 年应用细分估计和预测
- 2020-2030 年最终用途细分估计和预测
- 加拿大
- 我们
- 欧洲可解释的人工智能市场概况
- 英国
- 德国
- 法国
- 西班牙
- 意大利
- 欧洲其他地区
- 亚太地区可解释的人工智能市场概况
- 中国
- 印度
- 日本
- 澳大利亚
- 韩国
- 亚太地区其他地区
- 拉丁美洲可解释的人工智能市场概况
- 巴西
- 墨西哥
- 中东和非洲
- 沙特阿拉伯
- 南非
- 中东和非洲其他地区
第 10 章:竞争情报
- 重点企业SWOT分析
- 公司1
- 公司2
- 公司3
- 顶级市场策略
- 公司简介
- Amelia US LLC
- 关键信息
- 概述
- 财务(视数据可用性而定)
- 产品概要
- 最近的发展
- BuildGroup
- DataRobot, Inc.
- Ditto.ai
- DarwinAI
- Factmata
- Google LLC
- IBM Corporation
- Kyndi
- Microsoft Corporation
第 11 章:研究过程
- 研究过程
- 资料探勘
- 分析
- 市场预测
- 验证
- 出版
- 研究属性
- 研究假设
Global Explainable AI Market is valued at approximately USD 5.49 billion in 2022 and is anticipated to grow with a healthy growth rate of more than 18.0% over the forecast period 2023-2030. Explainable AI refers to the development of artificial intelligence (AI) systems that provide understandable and transparent explanations for their decision-making processes. Explainable AI (XAI) is a field of study that focuses on developing methods for explaining the decisions made by AI models. XAI is important because it helps users to understand how AI models work and why they make the decisions they do. This helps users to trust AI models and to use them more effectively. The rising trend of digitalization, growing customer expectations and user experience, coupled with the increasing number of favorable government initiatives are the most prominent factors that are propelling the market demand across the globe.
In addition, the increase in applications of explainable AI across the healthcare sector is acting as a catalyzing factor during the estimated period. Explainable AI is utilized for medical diagnosis and treatment recommendations and helps doctors and other healthcare professionals to comprehend and believe the judgments made by AI algorithms. Explainable models give explanations for diagnosis, offer viable therapies, and highlight pertinent medical issues, empowering healthcare professionals to make better-educated choices. According to the Statista analysis, in 2021, the global market for Artificial intelligence (AI) in healthcare was estimated to be worth around USD 11.06 billion. In addition, it is projected that the market grows and reached USD 38.66 billion by 2025 and USD 187.95 by 2030. Thereby, these aforementioned factors are likely to boost the market expansion globally. Moreover, the emerging technological advancements and the development of AI, as well as the rising number of strategic initiatives by the key market players present various lucrative opportunities over the forecasting years. However, the high cost of explainable AI solutions and the lack of skilled professionals are hindering the market growth throughout the forecast period of 2023-2030.
The key regions considered for the Global Explainable AI Market study include Asia Pacific, North America, Europe, Latin America, and Middle East & Africa. North America dominated the market in 2022 owing to the presence of a strong IT infrastructure, as well as surging demand for AI-powered solutions. Whereas, Asia Pacific is expected to grow at the highest CAGR over the forecasting years. The growing need for compliance with regulations, rising investment in XAI research and development, and increasing advancements in hardware and parallel processing are significantly propelling the market demand across the region.
Major market players included in this report are:
- Amelia US LLC
- BuildGroup
- DataRobot, Inc.
- Ditto.ai
- DarwinAI
- Factmata
- Google LLC
- IBM Corporation
- Kyndi
- Microsoft Corporation
Recent Developments in the Market:
- In March 2023, Monroe Capital and BuildGroup teamed with AI company Amelia to supply financial funding and managerial expertise. The strategic partnership accelerates the commercialization of Amelia's AI solutions. The strategic partnership hastens the commercialization of Amelia's AI solutions. BuildGroup and Monroe Capital are leading the USD 175 million transactions with this round of funding. Amelia has the required resources to maintain its market-leading position and increase its dedication to offering its customers cutting-edge, comprehensible AI technologies.
Global Explainable AI Market Report Scope:
- Historical Data: 2020 - 2021
- Base Year for Estimation: 2022
- Forecast period: 2023-2030
- Report Coverage: Revenue forecast, Company Ranking, Competitive Landscape, Growth factors, and Trends
- Segments Covered: Component, Deployment, Application, End-use, Region
- Regional Scope: North America; Europe; Asia Pacific; Latin America; Middle East & Africa
- Customization Scope: Free report customization (equivalent up to 8 analyst's working hours) with purchase. Addition or alteration to country, regional & segment scope*
The objective of the study is to define market sizes of different segments & countries in recent years and to forecast the values to the coming years. The report is designed to incorporate both qualitative and quantitative aspects of the industry within countries involved in the study.
The report also caters detailed information about the crucial aspects such as driving factors & challenges which will define the future growth of the market. Additionally, it also incorporates potential opportunities in micro markets for stakeholders to invest along with the detailed analysis of competitive landscape and product offerings of key players. The detailed segments and sub-segment of the market are explained below.
By Component:
- Solution
- Services
By Deployment:
- Cloud
- On-Premises
By Application:
- Fraud and anomaly detection
- Drug discovery & diagnostics
- Predictive maintenance
- Supply chain management
- Identity and access management
By End-use:
- Healthcare
- BFSI
- Aerospace & defense
- Retail and e-commerce
- IT & telecommunication
- Others
By Region:
- North America
- U.S.
- Canada
- Europe
- UK
- Germany
- France
- Spain
- Italy
- ROE
- Asia Pacific
- China
- India
- Japan
- Australia
- South Korea
- RoAPAC
- Latin America
- Brazil
- Mexico
- Middle East & Africa
- Saudi Arabia
- South Africa
- Rest of Middle East & Africa
Table of Contents
Chapter 1. Executive Summary
- 1.1. Market Snapshot
- 1.2. Global & Segmental Market Estimates & Forecasts, 2020-2030 (USD Billion)
- 1.2.1. Explainable AI Market, by Region, 2020-2030 (USD Billion)
- 1.2.2. Explainable AI Market, by Component, 2020-2030 (USD Billion)
- 1.2.3. Explainable AI Market, by Deployment, 2020-2030 (USD Billion)
- 1.2.4. Explainable AI Market, by Application, 2020-2030 (USD Billion)
- 1.2.5. Explainable AI Market, by End-use, 2020-2030 (USD Billion)
- 1.3. Key Trends
- 1.4. Estimation Methodology
- 1.5. Research Assumption
Chapter 2. Global Explainable AI Market Definition and Scope
- 2.1. Objective of the Study
- 2.2. Market Definition & Scope
- 2.2.1. Industry Evolution
- 2.2.2. Scope of the Study
- 2.3. Years Considered for the Study
- 2.4. Currency Conversion Rates
Chapter 3. Global Explainable AI Market Dynamics
- 3.1. Explainable AI Market Impact Analysis (2020-2030)
- 3.1.1. Market Drivers
- 3.1.1.1. Increasing number of favorable government initiatives
- 3.1.1.2. Increase in applications of explainable AI across the healthcare sector
- 3.1.2. Market Challenges
- 3.1.2.1. High cost of Explainable AI Solutions
- 3.1.2.2. Lack of skilled professionals
- 3.1.3. Market Opportunities
- 3.1.3.1. Emerging technological advancements and the development of AI
- 3.1.3.2. Rising number of strategic initiatives by the key market players
- 3.1.1. Market Drivers
Chapter 4. Global Explainable AI Market Industry Analysis
- 4.1. Porter's 5 Force Model
- 4.1.1. Bargaining Power of Suppliers
- 4.1.2. Bargaining Power of Buyers
- 4.1.3. Threat of New Entrants
- 4.1.4. Threat of Substitutes
- 4.1.5. Competitive Rivalry
- 4.2. Porter's 5 Force Impact Analysis
- 4.3. PEST Analysis
- 4.3.1. Political
- 4.3.2. Economical
- 4.3.3. Social
- 4.3.4. Technological
- 4.3.5. Environmental
- 4.3.6. Legal
- 4.4. Top investment opportunity
- 4.5. Top winning strategies
- 4.6. COVID-19 Impact Analysis
- 4.7. Disruptive Trends
- 4.8. Industry Expert Perspective
- 4.9. Analyst Recommendation & Conclusion
Chapter 5. Global Explainable AI Market, by Component
- 5.1. Market Snapshot
- 5.2. Global Explainable AI Market by Component, Performance - Potential Analysis
- 5.3. Global Explainable AI Market Estimates & Forecasts by Component 2020-2030 (USD Billion)
- 5.4. Explainable AI Market, Sub Segment Analysis
- 5.4.1. Solution
- 5.4.2. Services
Chapter 6. Global Explainable AI Market, by Deployment
- 6.1. Market Snapshot
- 6.2. Global Explainable AI Market by Deployment, Performance - Potential Analysis
- 6.3. Global Explainable AI Market Estimates & Forecasts by Deployment 2020-2030 (USD Billion)
- 6.4. Explainable AI Market, Sub Segment Analysis
- 6.4.1. Cloud
- 6.4.2. On-Premises
Chapter 7. Global Explainable AI Market, by Application
- 7.1. Market Snapshot
- 7.2. Global Explainable AI Market by Application, Performance - Potential Analysis
- 7.3. Global Explainable AI Market Estimates & Forecasts by Application 2020-2030 (USD Billion)
- 7.4. Explainable AI Market, Sub Segment Analysis
- 7.4.1. Fraud and anomaly detection
- 7.4.2. Drug discovery & diagnostics
- 7.4.3. Predictive maintenance
- 7.4.4. Supply chain management
- 7.4.5. Identity and access management
Chapter 8. Global Explainable AI Market, by End-use
- 8.1. Market Snapshot
- 8.2. Global Explainable AI Market by End-use, Performance - Potential Analysis
- 8.3. Global Explainable AI Market Estimates & Forecasts by End-use 2020-2030 (USD Billion)
- 8.4. Explainable AI Market, Sub Segment Analysis
- 8.4.1. Healthcare
- 8.4.2. BFSI
- 8.4.3. Aerospace & defense
- 8.4.4. Retail and e-commerce
- 8.4.5. IT & telecommunication
- 8.4.6. Others
Chapter 9. Global Explainable AI Market, Regional Analysis
- 9.1. Top Leading Countries
- 9.2. Top Emerging Countries
- 9.3. Explainable AI Market, Regional Market Snapshot
- 9.4. North America Explainable AI Market
- 9.4.1. U.S. Explainable AI Market
- 9.4.1.1. Component breakdown estimates & forecasts, 2020-2030
- 9.4.1.2. Deployment breakdown estimates & forecasts, 2020-2030
- 9.4.1.3. Application breakdown estimates & forecasts, 2020-2030
- 9.4.1.4. End-use breakdown estimates & forecasts, 2020-2030
- 9.4.2. Canada Explainable AI Market
- 9.4.1. U.S. Explainable AI Market
- 9.5. Europe Explainable AI Market Snapshot
- 9.5.1. U.K. Explainable AI Market
- 9.5.2. Germany Explainable AI Market
- 9.5.3. France Explainable AI Market
- 9.5.4. Spain Explainable AI Market
- 9.5.5. Italy Explainable AI Market
- 9.5.6. Rest of Europe Explainable AI Market
- 9.6. Asia-Pacific Explainable AI Market Snapshot
- 9.6.1. China Explainable AI Market
- 9.6.2. India Explainable AI Market
- 9.6.3. Japan Explainable AI Market
- 9.6.4. Australia Explainable AI Market
- 9.6.5. South Korea Explainable AI Market
- 9.6.6. Rest of Asia Pacific Explainable AI Market
- 9.7. Latin America Explainable AI Market Snapshot
- 9.7.1. Brazil Explainable AI Market
- 9.7.2. Mexico Explainable AI Market
- 9.8. Middle East & Africa Explainable AI Market
- 9.8.1. Saudi Arabia Explainable AI Market
- 9.8.2. South Africa Explainable AI Market
- 9.8.3. Rest of Middle East & Africa Explainable AI Market
Chapter 10. Competitive Intelligence
- 10.1. Key Company SWOT Analysis
- 10.1.1. Company 1
- 10.1.2. Company 2
- 10.1.3. Company 3
- 10.2. Top Market Strategies
- 10.3. Company Profiles
- 10.3.1. Amelia US LLC
- 10.3.1.1. Key Information
- 10.3.1.2. Overview
- 10.3.1.3. Financial (Subject to Data Availability)
- 10.3.1.4. Product Summary
- 10.3.1.5. Recent Developments
- 10.3.2. BuildGroup
- 10.3.3. DataRobot, Inc.
- 10.3.4. Ditto.ai
- 10.3.5. DarwinAI
- 10.3.6. Factmata
- 10.3.7. Google LLC
- 10.3.8. IBM Corporation
- 10.3.9. Kyndi
- 10.3.10. Microsoft Corporation
- 10.3.1. Amelia US LLC
Chapter 11. Research Process
- 11.1. Research Process
- 11.1.1. Data Mining
- 11.1.2. Analysis
- 11.1.3. Market Estimation
- 11.1.4. Validation
- 11.1.5. Publishing
- 11.2. Research Attributes
- 11.3. Research Assumption
LIST OF TABLES
- TABLE 1. Global Explainable AI Market, report scope
- TABLE 2. Global Explainable AI Market estimates & forecasts by Region 2020-2030 (USD Billion)
- TABLE 3. Global Explainable AI Market estimates & forecasts by Component 2020-2030 (USD Billion)
- TABLE 4. Global Explainable AI Market estimates & forecasts by Deployment 2020-2030 (USD Billion)
- TABLE 5. Global Explainable AI Market estimates & forecasts by Application 2020-2030 (USD Billion)
- TABLE 6. Global Explainable AI Market estimates & forecasts by End-use 2020-2030 (USD Billion)
- TABLE 7. Global Explainable AI Market by segment, estimates & forecasts, 2020-2030 (USD Billion)
- TABLE 8. Global Explainable AI Market by region, estimates & forecasts, 2020-2030 (USD Billion)
- TABLE 9. Global Explainable AI Market by segment, estimates & forecasts, 2020-2030 (USD Billion)
- TABLE 10. Global Explainable AI Market by region, estimates & forecasts, 2020-2030 (USD Billion)
- TABLE 11. Global Explainable AI Market by segment, estimates & forecasts, 2020-2030 (USD Billion)
- TABLE 12. Global Explainable AI Market by region, estimates & forecasts, 2020-2030 (USD Billion)
- TABLE 13. Global Explainable AI Market by segment, estimates & forecasts, 2020-2030 (USD Billion)
- TABLE 14. Global Explainable AI Market by region, estimates & forecasts, 2020-2030 (USD Billion)
- TABLE 15. Global Explainable AI Market by segment, estimates & forecasts, 2020-2030 (USD Billion)
- TABLE 16. Global Explainable AI Market by region, estimates & forecasts, 2020-2030 (USD Billion)
- TABLE 17. U.S. Explainable AI Market estimates & forecasts, 2020-2030 (USD Billion)
- TABLE 18. U.S. Explainable AI Market estimates & forecasts by segment 2020-2030 (USD Billion)
- TABLE 19. U.S. Explainable AI Market estimates & forecasts by segment 2020-2030 (USD Billion)
- TABLE 20. Canada Explainable AI Market estimates & forecasts, 2020-2030 (USD Billion)
- TABLE 21. Canada Explainable AI Market estimates & forecasts by segment 2020-2030 (USD Billion)
- TABLE 22. Canada Explainable AI Market estimates & forecasts by segment 2020-2030 (USD Billion)
- TABLE 23. UK Explainable AI Market estimates & forecasts, 2020-2030 (USD Billion)
- TABLE 24. UK Explainable AI Market estimates & forecasts by segment 2020-2030 (USD Billion)
- TABLE 25. UK Explainable AI Market estimates & forecasts by segment 2020-2030 (USD Billion)
- TABLE 26. Germany Explainable AI Market estimates & forecasts, 2020-2030 (USD Billion)
- TABLE 27. Germany Explainable AI Market estimates & forecasts by segment 2020-2030 (USD Billion)
- TABLE 28. Germany Explainable AI Market estimates & forecasts by segment 2020-2030 (USD Billion)
- TABLE 29. France Explainable AI Market estimates & forecasts, 2020-2030 (USD Billion)
- TABLE 30. France Explainable AI Market estimates & forecasts by segment 2020-2030 (USD Billion)
- TABLE 31. France Explainable AI Market estimates & forecasts by segment 2020-2030 (USD Billion)
- TABLE 32. Italy Explainable AI Market estimates & forecasts, 2020-2030 (USD Billion)
- TABLE 33. Italy Explainable AI Market estimates & forecasts by segment 2020-2030 (USD Billion)
- TABLE 34. Italy Explainable AI Market estimates & forecasts by segment 2020-2030 (USD Billion)
- TABLE 35. Spain Explainable AI Market estimates & forecasts, 2020-2030 (USD Billion)
- TABLE 36. Spain Explainable AI Market estimates & forecasts by segment 2020-2030 (USD Billion)
- TABLE 37. Spain Explainable AI Market estimates & forecasts by segment 2020-2030 (USD Billion)
- TABLE 38. RoE Explainable AI Market estimates & forecasts, 2020-2030 (USD Billion)
- TABLE 39. RoE Explainable AI Market estimates & forecasts by segment 2020-2030 (USD Billion)
- TABLE 40. RoE Explainable AI Market estimates & forecasts by segment 2020-2030 (USD Billion)
- TABLE 41. China Explainable AI Market estimates & forecasts, 2020-2030 (USD Billion)
- TABLE 42. China Explainable AI Market estimates & forecasts by segment 2020-2030 (USD Billion)
- TABLE 43. China Explainable AI Market estimates & forecasts by segment 2020-2030 (USD Billion)
- TABLE 44. India Explainable AI Market estimates & forecasts, 2020-2030 (USD Billion)
- TABLE 45. India Explainable AI Market estimates & forecasts by segment 2020-2030 (USD Billion)
- TABLE 46. India Explainable AI Market estimates & forecasts by segment 2020-2030 (USD Billion)
- TABLE 47. Japan Explainable AI Market estimates & forecasts, 2020-2030 (USD Billion)
- TABLE 48. Japan Explainable AI Market estimates & forecasts by segment 2020-2030 (USD Billion)
- TABLE 49. Japan Explainable AI Market estimates & forecasts by segment 2020-2030 (USD Billion)
- TABLE 50. South Korea Explainable AI Market estimates & forecasts, 2020-2030 (USD Billion)
- TABLE 51. South Korea Explainable AI Market estimates & forecasts by segment 2020-2030 (USD Billion)
- TABLE 52. South Korea Explainable AI Market estimates & forecasts by segment 2020-2030 (USD Billion)
- TABLE 53. Australia Explainable AI Market estimates & forecasts, 2020-2030 (USD Billion)
- TABLE 54. Australia Explainable AI Market estimates & forecasts by segment 2020-2030 (USD Billion)
- TABLE 55. Australia Explainable AI Market estimates & forecasts by segment 2020-2030 (USD Billion)
- TABLE 56. RoAPAC Explainable AI Market estimates & forecasts, 2020-2030 (USD Billion)
- TABLE 57. RoAPAC Explainable AI Market estimates & forecasts by segment 2020-2030 (USD Billion)
- TABLE 58. RoAPAC Explainable AI Market estimates & forecasts by segment 2020-2030 (USD Billion)
- TABLE 59. Brazil Explainable AI Market estimates & forecasts, 2020-2030 (USD Billion)
- TABLE 60. Brazil Explainable AI Market estimates & forecasts by segment 2020-2030 (USD Billion)
- TABLE 61. Brazil Explainable AI Market estimates & forecasts by segment 2020-2030 (USD Billion)
- TABLE 62. Mexico Explainable AI Market estimates & forecasts, 2020-2030 (USD Billion)
- TABLE 63. Mexico Explainable AI Market estimates & forecasts by segment 2020-2030 (USD Billion)
- TABLE 64. Mexico Explainable AI Market estimates & forecasts by segment 2020-2030 (USD Billion)
- TABLE 65. RoLA Explainable AI Market estimates & forecasts, 2020-2030 (USD Billion)
- TABLE 66. RoLA Explainable AI Market estimates & forecasts by segment 2020-2030 (USD Billion)
- TABLE 67. RoLA Explainable AI Market estimates & forecasts by segment 2020-2030 (USD Billion)
- TABLE 68. Saudi Arabia Explainable AI Market estimates & forecasts, 2020-2030 (USD Billion)
- TABLE 69. South Africa Explainable AI Market estimates & forecasts by segment 2020-2030 (USD Billion)
- TABLE 70. RoMEA Explainable AI Market estimates & forecasts by segment 2020-2030 (USD Billion)
- TABLE 71. List of secondary sources, used in the study of global Explainable AI Market
- TABLE 72. List of primary sources, used in the study of global Explainable AI Market
- TABLE 73. Years considered for the study
- TABLE 74. Exchange rates considered
List of tables and figures and dummy in nature, final lists may vary in the final deliverable
LIST OF FIGURES
- FIG 1. Global Explainable AI Market, research methodology
- FIG 2. Global Explainable AI Market, Market estimation techniques
- FIG 3. Global Market size estimates & forecast methods
- FIG 4. Global Explainable AI Market, key trends 2022
- FIG 5. Global Explainable AI Market, growth prospects 2023-2030
- FIG 6. Global Explainable AI Market, porters 5 force model
- FIG 7. Global Explainable AI Market, pest analysis
- FIG 8. Global Explainable AI Market, value chain analysis
- FIG 9. Global Explainable AI Market by segment, 2020 & 2030 (USD Billion)
- FIG 10. Global Explainable AI Market by segment, 2020 & 2030 (USD Billion)
- FIG 11. Global Explainable AI Market by segment, 2020 & 2030 (USD Billion)
- FIG 12. Global Explainable AI Market by segment, 2020 & 2030 (USD Billion)
- FIG 13. Global Explainable AI Market by segment, 2020 & 2030 (USD Billion)
- FIG 14. Global Explainable AI Market, regional snapshot 2020 & 2030
- FIG 15. North America Explainable AI Market 2020 & 2030 (USD Billion)
- FIG 16. Europe Explainable AI Market 2020 & 2030 (USD Billion)
- FIG 17. Asia Pacific Explainable AI Market 2020 & 2030 (USD Billion)
- FIG 18. Latin America Explainable AI Market 2020 & 2030 (USD Billion)
- FIG 19. Middle East & Africa Explainable AI Market 2020 & 2030 (USD Billion)
List of tables and figures and dummy in nature, final lists may vary in the final deliverable
 全球可解释人工智慧 (XAI) 市场 2025-2029
 2025-2029年全球人工智慧可解释性和透明度市场
 全球可解释人工智慧市场:市场规模、份额、趋势分析(按部署方法、组件、应用、最终用途和地区)、展望和预测(2025-2032 年)
 可解释人工智慧市场规模、份额和趋势分析报告:按组件、部署、最终用途、地区和细分市场预测,2025 年至 2030 年
 全球可解释人工智慧市场研究报告 - 产业分析、规模、份额、成长、趋势及 2025 年至 2033 年预测
 2025年可解释人工智慧全球市场报告可解释人工智慧市场:预测(2025-2030 年)
 可解释的人工智慧市场:按产品、部署、应用程式和最终用途分类 - 2025-2030 年全球预测
 全球可解释人工智慧 2024-2031
 可解释的人工智慧- 市场占有率分析、产业趋势/统计、成长预测(2024-2029)