


 |
市场调查报告书
商品编码
1449679
排放权交易市场:按交易类型、最终用途和地区划分Emissions Trading Market, By Type Of Trading, By End Use, By Geography |
||||||
预计2023年排放权交易市场规模为3.176亿美元,预计2030年将达10.345亿美元,2023年至2030年复合年增长率为18.4%。
| 报告范围 | 报告详情 | ||
|---|---|---|---|
| 基准年 | 2022年 | 2023/2024年市场规模 | 3.176 亿美元 |
| 实际资料 | 2018-2021 | 预测期 | 2024-2031 |
| 预测期间 2023/2024 至 2030/2031 年复合年增长率: | 18.40% | 2030/2031 年预测值 | 10.345 亿美元 |
排放权交易,也称为总量管制与交易,是一种基于市场的遏制温室气体排放的方法。排放权交易的运作前提是为特定产业或地区的温室气体排放排放设定上限。企业根据其允许排放分配排放配额。如果一家公司的排放低于其分配的排放,它可以将其剩余排放出售给其他超过排放配额的公司。该系统提供了实现排放目标的弹性,同时奖励公司在努力保持合规性的同时减少排放。排放权交易已成为全球应对气候变迁、促进产业合作和鼓励清洁技术投资的重要工具。
近年来,由于人们对环境问题的兴趣日益浓厚以及国际社会应对气候变迁的努力,排放权交易市场经历了显着增长。包括欧盟部分地区、中国和美国在内的多个地区已引入排放权交易计划,以有效监管温室气体排放。此外,自愿碳市场已经出现,允许企业和个人自愿抵消其碳排放。随着越来越多的国家和公司致力于减少碳排放,排放权交易市场将继续扩大,并在世界向更永续和气候智慧型未来的过渡中发挥关键作用。Masu。
欧盟排放权交易体系(EU ETS)是全球最大的碳市场,约占全球碳信用额交易的90%。欧盟承诺在2030年将温室气体排放减少55%,欧盟排放交易体系预计将持续成长。
市场动态:.
环境问题和气候变迁缓解、监管合规和国际承诺预计将在预测期内推动全球排放权交易市场的成长。此外,经济效率和成本效益、干净科技的推广和技术创新也有望推动预测期内排放权交易市场的成长。扩大排放权交易计画、整合排放权交易计画、增加新的温室气体和基于市场的净零目标解决方案预计将在预测期内为排放权交易市场提供成长机会。
然而,政治和政策的不确定性、不够严格、市场运作和价格波动预计将阻碍预测期内排放权交易市场的成长。
本研究的主要特点
- 本报告详细分析了排放权交易市场,并提供了以2022年为基准年的预测期间(2023-2030)的市场规模和年复合成长率(CAGR%)。
- 它还说明了各个细分市场的潜在商机,并为该市场提供了一系列有吸引力的投资提案。
- 它还提供了有关市场驱动因素、限制因素、机会、新产品发布和核准、市场趋势、区域前景、主要企业采取的竞争策略等的重要见解。
- 它根据公司亮点、产品系列、主要亮点、财务表现和策略等参数,对排放权交易市场的主要企业进行了介绍。
- 本报告针对该产业的各个相关人员,包括投资者、供应商、产品製造商、经销商、新进业者和财务分析师。
- 透过用于分析排放权交易市场的各种策略矩阵,将有助于相关人员做出决策。
目录
第一章 研究目的与前提
- 研究目标
- 先决条件
- 简称
第二章 市场展望
- 报告说明
- 市场定义和范围
- 执行摘要
- Coherent Opportunity Map(COM)
第三章市场动态、法规及趋势分析
- 市场动态
- 环境问题与减缓气候变迁
- 监理合规性和国际倡议
- 经济性和成本效益
- 促进洁净科技和创新
- 排放大国缺乏承诺
- 普及排放免费分配
- 碳洩漏风险
- 扩大排放权交易体系
- 与排放权交易体系合作
- 含有新的温室气体
- 基于市场的净零目标解决方案
- 主要亮点
- 监管场景
- 最近的趋势
- 产品发布/核准
- PEST分析
- 波特的分析
- 合併、收购和合作
第四章排放权交易市场,依交易类型,2017-2030
- 限额与交易
- 基准和学分
第五章排放权交易市场,依最终用途分类,2017-2030 年
- 活力
- 发电
- 工业的
- 交通设施
- 农业
第六章 2017-2030 年按地区分類的排放权交易市场
- 北美洲
- 美国
- 加拿大
- 欧洲
- 德国
- 英国
- 西班牙
- 法国
- 义大利
- 俄罗斯
- 欧洲其他地区
- 亚太地区
- 中国
- 印度
- 日本
- 澳洲
- 韩国
- ASEAN
- 其他亚太地区
- 拉丁美洲
- 巴西
- 阿根廷
- 墨西哥
- 其他拉丁美洲
- 中东/非洲
- 海湾合作委员会国家
- 以色列
- 南非
- 北非
- 中部非洲
- 其他中东地区
第七章 竞争格局
- 公司简介
- BP Plc.
- Royal Dutch Shell Plc
- Total SE
- Chevron Corporation
- ExxonMobil Corporation
- Engie SA
- RWE AG
- ON SE
- Vattenfall AB
- Gazprom
- Mitsubishi UFJ Financial Group(MUFG)
- JPMorgan Chase &Co.
- Goldman Sachs Group, Inc.
- Citigroup Inc.
- Barclays PLC
第 8 章
- 参考
- 调查方法
- 关于出版商
The emissions trading market size was estimated to be valued at US$ 317.6 Mn in 2023 and is expected to reach US$ 1,034.5 Mn by 2030, exhibiting a compound annual growth rate (CAGR) of 18.4% from 2023 to 2030.
| Report Coverage | Report Details | ||
|---|---|---|---|
| Base Year: | 2022 | Market Size in 2023/2024: | US$ 317.6 Mn |
| Historical Data for: | 2018 to 2021 | Forecast Period: | 2023 - 2030 |
| Forecast Period 2023/2024 to 2030/2031 CAGR: | 18.40% | 2030/2031 Value Projection: | US$ 1,034.5 Mn |
Emissions trading, also known as cap-and-trade, is a market-based approach to controlling greenhouse gas emissions. It operates under the premise of setting a cap on the total allowable emissions from specific industries or regions. Companies are allocated emission allowances corresponding to their permitted emission levels. If a company emits below its allotted amount, it can sell the surplus allowances to other companies exceeding their emissions limits. This system incentivizes emissions reductions as companies strive to maintain compliance while providing flexibility in achieving emission targets. Emissions trading has gained prominence globally as a crucial tool in addressing climate change, fostering cooperation among industries, and encouraging investment in cleaner technologies.
The emissions trading market has witnessed significant growth in recent years, spurred by mounting environmental concerns and international efforts to combat climate change. Various regions, including the European Union, China, and parts of the U.S., have implemented emissions trading systems to regulate greenhouse gas emissions effectively. Additionally, the voluntary carbon market has emerged, enabling businesses and individuals to offset their carbon footprint voluntarily. As more countries and companies commit to reducing their carbon emissions, the emissions trading market is likely to continue expanding, playing a vital role in the global transition towards a more sustainable and climate-conscious future.
The European Union Emissions Trading System (EU ETS) is the largest carbon market in the world, accounting for around 90% of global carbon credit trading volume. The EU ETS is expected to continue to grow in the coming years, as the European Union commits to reducing its greenhouse gas emissions by 55% by 2030.
Market Dynamics:
Environmental concerns and climate change mitigation, regulatory compliance and international commitments are anticipated to drive growth of the global emissions trading market over the forecast period. Moreover, economic efficiency and cost-effectiveness, stimulating clean technologies and innovation is also expected to boost the growth of the emissions trading market over the forecast period. Expansion of emissions trading schemes, linking emissions trading systems, inclusion of new greenhouse gases, and market-based solutions for net-zero goals are expected to create growth opportunities for the emissions trading market during the forecast period.
However, political and policy uncertainty, insufficient stringency, market manipulation and price volatility are expected to hamper growth of the emissions trading market over the forecast period.
Key features of the study:
- This report provides in-depth analysis of the emissions trading market, and provides market size (US$ Mn) and compound annual growth rate (CAGR %) for the forecast period (2023-2030), considering 2022 as the base year.
- It elucidates potential revenue opportunities across different segments and explains attractive investment proposition matrices for this market.
- This study also provides key insights about market drivers, restraints, opportunities, new product launches or approval, market trends, regional outlook, and competitive strategies adopted by key players.
- It profiles key players in the emissions trading market based on the following parameters - company highlights, products portfolio, key highlights, financial performance, and strategies.
- Key companies covered as a part of this study include BP Plc., Royal Dutch Shell Plc., Total SE, Chevron Corporation, ExxonMobil Corporation, Engie SA, RWE AG, EON SE, Vattenfall AB, Gazprom, Mitsubishi UFJ Financial Group (MUFG), JPMorgan Chase & Co., Goldman Sachs Group, Inc. Citigroup Inc., and Barclays PLC Insights from this report would allow marketers and the management authorities of the companies to make informed decisions regarding their future product launches, type up-gradation, market expansion, and marketing tactics.
- The emissions trading market report caters to various stakeholders in this industry including investors, suppliers, product manufacturers, distributors, new entrants, and financial analysts.
- Stakeholders would have ease in decision-making through various strategy matrices used in analyzing the emissions trading market.
Detailed Segmentation:
- Emissions Trading Market Segmentation, By Trading Type:
- Cap-and-Trade
- Baseline-and-Credit
- Emissions Trading Market Segmentation, By End Use:
- Energy
- Power Generation
- Industrial
- Transportation
- Agriculture
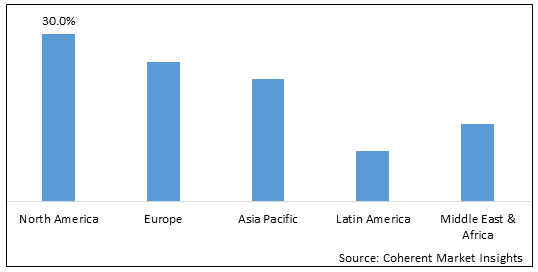
- Emissions Trading Market Segmentation, By Region:
- North America
- Europe
- Asia Pacific
- Latin America
- Middle East
- Africa
- Top Companies in the Emissions Trading Market:
- BP Plc.
- Royal Dutch Shell Plc.
- Total SE
- Chevron Corporation
- ExxonMobil Corporation
- Engie SA
- RWE AG
- ON SE
- Vattenfall AB
- Gazprom
- Mitsubishi UFJ Financial Group (MUFG)
- JPMorgan Chase & Co
- Citigroup Inc.
- Barclays PLC
- Goldman Sachs Group, Inc.
Table of Contents
1. Research Objectives and Assumptions
- Research Objectives
- Assumptions
- Abbreviations
2. Market Purview
- Report Description
- Market Definition and Scope
- Executive Summary
- Emissions Trading Market, By Trading Type
- Emissions Trading Market, By End Use
- Emissions Trading Market, By Region
- Coherent Opportunity Map (COM)
3. Market Dynamics, Regulations, and Trends Analysis
- Market Dynamics
- Drivers
- Environmental concerns and climate change mitigation
- Regulatory compliance and international commitments
- Economic efficiency and cost-effectiveness
- Stimulating clean technologies and innovation
- Restraints
- Lack of commitment by large emitters
- Prevalence of free allocation of emissions allowances
- Carbon leakage risk
- Opportunities
- Expansion of emissions trading schemes
- Linking emissions trading systems
- Inclusion of new greenhouse gases
- Market-based solutions for net-Zero goals
- Key Highlights
- Regulatory Scenario
- Recent Trends
- Product Launches/Approvals
- PEST Analysis
- PORTER's Analysis
- Mergers, Acquisitions, and Collaborations
4. Emissions Trading Market, By Trading Type, 2017-2030, (US$ Mn)
- Introduction
- Market Share Analysis, 2023 and 2030 (%)
- Y-o-Y Growth Analysis, 2018 - 2030
- Segment Trends
- Cap-and-Trade
- Introduction
- Market Size and Forecast, and Y-o-Y Growth, 2017-2030,(US$ Mn)
- Baseline-and-Credit
- Introduction
- Market Size and Forecast, and Y-o-Y Growth, 2017-2030,(US$ Mn)
5. Emissions Trading Market, By End Use, 2017-2030, (US$ Mn)
- Introduction
- Market Share Analysis, 2023 and 2030 (%)
- Y-o-Y Growth Analysis, 2018 - 2030
- Segment Trends
- Energy
- Introduction
- Market Size and Forecast, and Y-o-Y Growth, 2017-2030, (US$ Million)
- Power Generation
- Introduction
- Market Size and Forecast, and Y-o-Y Growth, 2017-2030, (US$ Million)
- Industrial
- Introduction
- Market Size and Forecast, and Y-o-Y Growth, 2017-2030, (US$ Million)
- Transportation
- Introduction
- Market Size and Forecast, and Y-o-Y Growth, 2017-2030, (US$ Million)
- Agriculture
- Introduction
- Market Size and Forecast, and Y-o-Y Growth, 2017-2030, (US$ Million)
6. Emission Trading Market, By Region, 2017-2030, (US$ Mn)
- Introduction
- Market Share Analysis, By Sub-region, 2022 and 2030 (%)
- Y-o-Y Growth Analysis, For Sub-region, 2018 - 2030
- Segment Trends
- North America
- Introduction
- Market Size and Forecast, and Y-o-Y Growth, By Trading Type , 2017-2030,(US$ Mn)
- Market Size and Forecast, and Y-o-Y Growth, By End Use, 2017-2030,(US$ Mn)
- Market Size and Forecast, and Y-o-Y Growth, By Country, 2017-2030,(US$ Mn)
- U.S.
- Canada
- Europe
- Introduction
- Market Size and Forecast, and Y-o-Y Growth, By Trading Type , 2017-2030,(US$ Mn)
- Market Size and Forecast, and Y-o-Y Growth, By End Use, 2017-2030,(US$ Mn)
- Market Size and Forecast, and Y-o-Y Growth, By Country, 2017-2030,(US$ Mn)
- Germany
- U.K.
- Spain
- France
- Italy
- Russia
- Rest of Europe
- Asia Pacific
- Introduction
- Market Size and Forecast, and Y-o-Y Growth, By Trading Type , 2017-2030,(US$ Mn)
- Market Size and Forecast, and Y-o-Y Growth, By End Use, 2017-2030,(US$ Mn)
- Market Size and Forecast, and Y-o-Y Growth, By Country, 2017-2030,(US$ Mn)
- China
- India
- Japan
- Australia
- South Korea
- ASEAN
- Rest of Asia Pacific
- Latin America
- Introduction
- Market Size and Forecast, and Y-o-Y Growth, By Trading Type , 2017-2030,(US$ Mn)
- Market Size and Forecast, and Y-o-Y Growth, By End Use, 2017-2030,(US$ Mn)
- Market Size and Forecast, and Y-o-Y Growth, By Country, 2017-2030,(US$ Mn)
- Brazil
- Argentina
- Mexico
- Rest of Latin America
- Middle East & Africa
- Introduction
- Market Size and Forecast, and Y-o-Y Growth, By Trading Type , 2017-2030,(US$ Mn)
- Market Size and Forecast, and Y-o-Y Growth, By End Use, 2017-2030,(US$ Mn)
- Market Size and Forecast, and Y-o-Y Growth, By Country, 2017-2030,(US$ Mn)
- GCC Countries
- Israel
- South Africa
- North Africa
- Central Africa
- Rest of Middle East
7. Competitive Landscape
- Company Profile
- BP Plc.
- Company Highlights
- Product Portfolio
- Key Developments
- Financial Performance
- Strategies
- Royal Dutch Shell Plc
- Company Highlights
- Product Portfolio
- Key Highlights
- Financial Performance
- Strategies
- Total SE
- Company Highlights
- Product Portfolio
- Key Highlights
- Financial Performance
- Strategies
- Chevron Corporation
- Company Highlights
- Product Portfolio
- Key Highlights
- Financial Performance
- Strategies
- ExxonMobil Corporation
- Company Highlights
- Product Portfolio
- Key Highlights
- Financial Performance
- Strategies
- Engie SA
- Company Highlights
- Product Portfolio
- Key Highlights
- Financial Performance
- Strategies
- RWE AG
- Company Highlights
- Product Portfolio
- Key Highlights
- Financial Performance
- Strategies
- ON SE
- Company Highlights
- Product Portfolio
- Key Highlights
- Financial Performance
- Strategies
- Vattenfall AB
- Company Highlights
- Product Portfolio
- Key Highlights
- Financial Performance
- Strategies
- Gazprom
- Company Highlights
- Product Portfolio
- Key Highlights
- Financial Performance
- Strategies
- Mitsubishi UFJ Financial Group (MUFG)
- Company Highlights
- Product Portfolio
- Key Highlights
- Financial Performance
- Strategies
- JPMorgan Chase & Co.
- Company Highlights
- Product Portfolio
- Key Highlights
- Financial Performance
- Strategies
- Goldman Sachs Group, Inc.
- Company Highlights
- Product Portfolio
- Key Highlights
- Financial Performance
- Strategies
- Citigroup Inc.
- Company Highlights
- Product Portfolio
- Key Highlights
- Financial Performance
- Strategies
- Barclays PLC
- Company Highlights
- Product Portfolio
- Key Highlights
- Financial Performance
- Strategies
- Analyst Views
8. Section
- References
- Research Methodology
- About us
 二氧化碳捕集、利用和储存市场 - 全球和区域分析:按应用、产品和区域 - 分析和预测(2025-2034)
 捕碳封存市场(按服务、技术和最终用途行业)—2025-2030 年全球预测碳捕获、利用和储存市场(按服务、技术类型和最终用途行业)—2025-2030 年全球预测
 捕碳封存:市场占有率分析、行业趋势和统计、成长预测(2025-2030 年)
 碳捕获、利用和储存市场规模、份额及成长分析(按技术、服务、类型、最终用户和地区)-2025-2032 年产业预测
 2025年捕碳封存技术全球市场报告
 点源碳捕获设备 (PSCD) 市场:2031 年预测
 全球发电碳捕获与储存市场研究报告 - 产业分析、规模、份额、成长、趋势与预测 2025 年至 2033 年2025 年捕碳封存全球市场报告按技术、应用、服务和地区分類的捕碳封存市场