


 |
市场调查报告书
商品编码
1698570
智慧建筑市场机会、成长动力、产业趋势分析及2025-2034年预测Smart Building Market Opportunity, Growth Drivers, Industry Trend Analysis, and Forecast 2025-2034 |
||||||
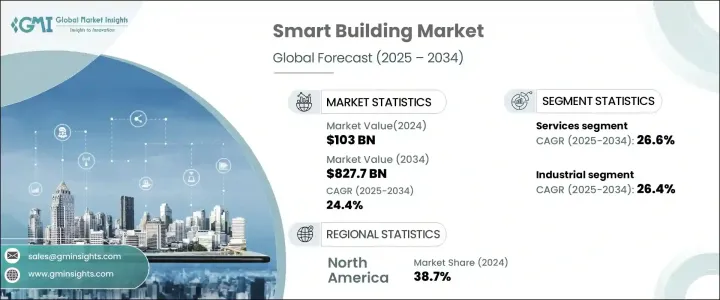
2024 年全球智慧建筑市场价值为 1,030 亿美元,预计 2025 年至 2034 年的复合年增长率为 24.4%。对能源效率、永续性和提高生产力的需求不断增长,推动了该行业的扩张。 5G、物联网、人工智慧和进阶资料分析的快速应用正在改变市场格局。此外,向建筑管理系统即服务的转变正在进一步加速市场成长。企业和住宅业主越来越多地投资智慧技术,以优化营运、降低成本并遵守不断变化的法规。政府和监管机构也正在推动能源效率倡议,鼓励更广泛地采用智慧建筑解决方案。
对能源效率的需求已成为智慧建筑业的主要驱动力。随着减少能源消耗变得越来越重要,物联网、自动化和能源管理软体在优化能源使用方面发挥着至关重要的作用。人工智慧 HVAC 系统根据入住率和天气状况动态调整气候控制,最大限度地减少能源浪费。更严格的监管架构迫使企业整合符合永续发展目标的智慧解决方案。先进的监控系统追踪能源消耗模式,帮助业主做出明智的决策,提高营运效率。
| 市场范围 | |
|---|---|
| 起始年份 | 2024 |
| 预测年份 | 2025-2034 |
| 起始值 | 1030亿美元 |
| 预测值 | 8277亿美元 |
| 复合年增长率 | 24.4% |
人工智慧和物联网正在透过实现即时资料分析和预测洞察重塑智慧建筑的未来。物联网促进持续监控,而人工智慧则识别低效率并推荐解决方案。智慧系统管理能源使用、水消耗和废弃物产生,创造更永续的生态系统。人工智慧预测性维护的整合可减少停机时间,防止系统故障发生。基于云端的平台透过实现关键建筑功能的无缝自动化进一步提高了效率。
科技驱动的创新不断改变建筑管理,提供更强的控制力、安全性和便利性。人工智慧、物联网和云端运算显着提高了即时监控和自动化水平,使管理员能够做出数据驱动的决策。预测性维护透过主动解决潜在问题来确保顺利运作。随着这些进步,智慧建筑变得越来越有效率、经济和环保。
旨在保持竞争力的公司优先投资人工智慧驱动的能源管理解决方案。根据即时占用、天气状况和使用趋势优化建筑运营的能力至关重要。采用绿建筑认证也成为吸引有环保意识的客户和遵守永续法规的关键策略。
市场分为解决方案和服务,其中服务部门预计以 26.6% 的复合年增长率成长。预测性维护服务需求的持续成长是这一成长背后的关键因素。解决方案部门的价值到 2023 年将达到 633 亿美元,包括能源管理、安全和保全管理、综合工作场所繫统和网路管理。暖通空调控制、照明管理和节水系统等智慧基础设施解决方案正在受到越来越多的关注。
商业领域将占据主导地位,到 2024 年将占据 51.7% 的市场份额。受对能源效率日益重视的推动,北美将以 38.7% 的份额领先。在美国,2024 年市场价值将达到 306 亿美元,企业和房主越来越多地采用智慧解决方案来优化能源使用并减少碳足迹。
目录
第一章:方法论与范围
- 市场范围和定义
- 基础估算与计算
- 预测计算
- 资料来源
- 基本的
- 次要
- 付费来源
- 公共资源
第二章:执行摘要
第三章:行业洞察
- 产业生态系统分析
- 影响价值链的因素
- 利润率分析
- 中断
- 未来展望
- 製造商
- 经销商
- 供应商格局
- 利润率分析
- 重要新闻和倡议
- 监管格局
- 衝击力
- 成长动力
- 能源效率和永续性日益重要
- 智慧建筑的技术进步
- 节省成本并提高营运效率
- 政府法规和激励措施
- 产业陷阱与挑战
- 网路安全担忧加剧
- 初期成本高
- 成长动力
- 成长潜力分析
- 波特的分析
- PESTEL分析
第四章:竞争格局
- 介绍
- 公司市占率分析
- 竞争定位矩阵
- 战略展望矩阵
第五章:市场估计与预测:依组件,2021-2034
- 主要趋势
- 解决方案
- 安全与安保管理
- 门禁系统
- 视讯监控系统
- 消防和生命安全系统
- 能源管理
- HVAC控制系统
- 照明管理系统
- 其他的
- 建筑基础设施管理
- 停车管理系统
- 水管理系统
- 其他的
- 整合工作场所管理系统 (IWMS)
- 房地产管理
- 资本项目管理
- 设施管理
- 营运和服务管理
- 环境与能源管理
- 网管
- 有线技术
- 无线技术
- 安全与安保管理
- 服务
第六章:市场估计与预测:依最终用途,2021-2034
- 主要趋势
- 住宅
- 商业的
- 卫生保健
- 零售
- 学术的
- 其他的
- 工业的
第七章:市场估计与预测:按地区,2021-2034
- 主要趋势
- 北美洲
- 我们
- 加拿大
- 欧洲
- 英国
- 德国
- 法国
- 瑞典
- 荷兰
- 俄罗斯
- 亚太地区
- 中国
- 印度
- 日本
- 韩国
- 澳洲
- 拉丁美洲
- 巴西
- 墨西哥
- MEA
- 南非
- 沙乌地阿拉伯
- 阿联酋
第八章:公司简介
- ABB
- Azbil corporation
- Cisco
- Hitachi ltd
- Honeywell
- Huawei
- IBM
- Intel Corporation
- legrand
- Microsoft Corporation
- Schneider Electric SE
- Siemens AG
- Johnsons controls
- NEC Corporation
- Nexii Building Solutions Inc
The Global Smart Building Market was valued at USD 103 billion in 2024 and is expected to grow at a CAGR of 24.4% from 2025 to 2034. The expansion of this industry is fueled by the rising demand for energy efficiency, sustainability, and improved productivity. The rapid adoption of 5G, IoT, AI, and advanced data analytics is transforming the market landscape. Additionally, the transition toward building management systems as a service is further accelerating market growth. Businesses and residential property owners are increasingly investing in smart technologies to optimize operations, reduce costs, and comply with evolving regulations. Governments and regulatory bodies are also pushing energy efficiency initiatives, encouraging wider adoption of intelligent building solutions.
The need for energy efficiency has become a major driver of the smart building industry. As energy consumption reduction gains importance, IoT, automation, and energy management software play a crucial role in optimizing energy usage. AI-powered HVAC systems dynamically adjust climate control based on occupancy and weather conditions, minimizing energy waste. Stricter regulatory frameworks are compelling businesses to integrate smart solutions that align with sustainability goals. Advanced monitoring systems track energy consumption patterns, helping property owners make informed decisions that enhance operational efficiency.
| Market Scope | |
|---|---|
| Start Year | 2024 |
| Forecast Year | 2025-2034 |
| Start Value | $103 Billion |
| Forecast Value | $827.7 Billion |
| CAGR | 24.4% |
AI and IoT are reshaping the future of smart buildings by enabling real-time data analysis and predictive insights. IoT facilitates continuous monitoring, while AI identifies inefficiencies and recommends solutions. Smart systems manage energy use, water consumption, and waste production, creating a more sustainable ecosystem. The integration of AI-powered predictive maintenance reduces downtime, preventing system failures before they occur. Cloud-based platforms further enhance efficiency by enabling seamless automation of critical building functions.
Technology-driven innovations continue to transform building management, providing greater control, security, and convenience. AI, IoT, and cloud computing have significantly improved real-time monitoring and automation, allowing administrators to make data-driven decisions. Predictive maintenance ensures smooth operations by proactively addressing potential issues. With these advancements, smart buildings are becoming increasingly efficient, cost-effective, and environmentally friendly.
Companies aiming to stay competitive are prioritizing investments in AI-driven energy management solutions. The ability to optimize building operations based on real-time occupancy, weather conditions, and usage trends is crucial. Adopting green building certifications has also become a key strategy for attracting environmentally conscious clients and complying with sustainability regulations.
The market is segmented into solutions and services, with the services segment projected to grow at a CAGR of 26.6%. The increasing demand for predictive maintenance services is a key factor behind this growth. The solutions segment, valued at USD 63.3 billion in 2023, includes energy management, safety and security management, integrated workplace systems, and network management. Smart infrastructure solutions such as HVAC control, lighting management, and water conservation systems are gaining traction.
The commercial segment is set to dominate, accounting for 51.7% of the market in 2024. North America leads with a 38.7% share, driven by the growing emphasis on energy efficiency. In the United States, the market was valued at USD 30.6 billion in 2024, with businesses and homeowners increasingly adopting smart solutions to optimize energy use and reduce carbon footprints.
Table of Contents
Chapter 1 Methodology & Scope
- 1.1 Market scope & definitions
- 1.2 Base estimates & calculations
- 1.3 Forecast calculations
- 1.4 Data sources
- 1.4.1 Primary
- 1.4.2 Secondary
- 1.4.2.1 Paid sources
- 1.4.2.2 Public sources
Chapter 2 Executive Summary
- 2.1 Industry synopsis, 2021-2034
Chapter 3 Industry Insights
- 3.1 Industry ecosystem analysis
- 3.1.1 Factor affecting the value chain
- 3.1.2 Profit margin analysis
- 3.1.3 Disruptions
- 3.1.4 Future outlook
- 3.1.5 Manufacturers
- 3.1.6 Distributors
- 3.2 Supplier landscape
- 3.3 Profit margin analysis
- 3.4 Key news & initiatives
- 3.5 Regulatory landscape
- 3.6 Impact forces
- 3.6.1 Growth drivers
- 3.6.1.1 Growing importance of energy efficiency and sustainability
- 3.6.1.2 Technological advancement in smart buildings
- 3.6.1.3 Cost savings and operational efficiency
- 3.6.1.4 Government regulations and incentives
- 3.6.2 Industry pitfalls & challenges
- 3.6.2.1 Rising cybersecurity concern
- 3.6.2.2 High initial cost
- 3.6.1 Growth drivers
- 3.7 Growth potential analysis
- 3.8 Porter's analysis
- 3.9 PESTEL analysis
Chapter 4 Competitive Landscape, 2024
- 4.1 Introduction
- 4.2 Company market share analysis
- 4.3 Competitive positioning matrix
- 4.4 Strategic outlook matrix
Chapter 5 Market Estimates & Forecast, By Component, 2021-2034 (USD Billion)
- 5.1 Key trends
- 5.2 Solution
- 5.2.1 Safety & security management
- 5.2.1.1 Access control system
- 5.2.1.2 Video surveillance system
- 5.2.1.3 Fire and life safety system
- 5.2.2 Energy Management
- 5.2.2.1 HVAC control system
- 5.2.2.2 Lighting management system
- 5.2.2.3 Others
- 5.2.3 Building infrastructure management
- 5.2.3.1 Parking management system
- 5.2.3.2 Water management system
- 5.2.3.3 Others
- 5.2.4 Integrated Workplace Management System (IWMS)
- 5.2.4.1 Real estate management
- 5.2.4.2 Capital project management
- 5.2.4.3 Facility management
- 5.2.4.4 Operations and services management
- 5.2.4.5 Environment and energy management
- 5.2.5 Network management
- 5.2.5.1 Wired technology
- 5.2.5.2 Wireless technology
- 5.2.1 Safety & security management
- 5.3 Service
Chapter 6 Market Estimates & Forecast, By End Use, 2021-2034 (USD Billion)
- 6.1 Key trends
- 6.2 Residential
- 6.3 Commercial
- 6.3.1 Healthcare
- 6.3.2 Retail
- 6.3.3 Academic
- 6.3.4 Others
- 6.4 Industrial
Chapter 7 Market Estimates & Forecast, By Region, 2021-2034 (USD Billion)
- 7.1 Key trends
- 7.2 North America
- 7.2.1 U.S.
- 7.2.2 Canada
- 7.3 Europe
- 7.3.1 UK
- 7.3.2 Germany
- 7.3.3 France
- 7.3.4 Sweden
- 7.3.5 Netherlands
- 7.3.6 Russia
- 7.4 Asia Pacific
- 7.4.1 China
- 7.4.2 India
- 7.4.3 Japan
- 7.4.4 South Korea
- 7.4.5 Australia
- 7.5 Latin America
- 7.5.1 Brazil
- 7.5.2 Mexico
- 7.6 MEA
- 7.6.1 South Africa
- 7.6.2 Saudi Arabia
- 7.6.3 UAE
Chapter 8 Company Profiles
- 8.1 ABB
- 8.2 Azbil corporation
- 8.3 Cisco
- 8.4 Hitachi ltd
- 8.5 Honeywell
- 8.6 Huawei
- 8.7 IBM
- 8.8 Intel Corporation
- 8.9 legrand
- 8.10 Microsoft Corporation
- 8.11 Schneider Electric SE
- 8.12 Siemens AG
- 8.13 Johnsons controls
- 8.14 NEC Corporation
- 8.15 Nexii Building Solutions Inc
 2025年建筑能源模拟软体全球市场报告
 智慧建筑市场:按组件、建筑类型、连接性、应用和部署 - 2025-2030 年全球预测智慧外墙市场 - 全球产业规模、份额、趋势、机会和预测,按材料类型、技术、应用、地区、竞争细分,2020-2030 年预测
 智慧建筑市场规模、份额及成长分析(按组件、解决方案、建筑类型和地区)-2025-2032 年产业预测
 智慧建筑:市场占有率分析、产业趋势与统计、成长预测(2025-2030 年)
 智慧商业建筑中的物联网设备(2025-2030)- 设备预测、采用、元趋势分析2025年智慧建筑(非住宅建筑)全球市场报告2025 年全球办公大楼市场报告
 智慧建筑市场分析:年度订阅
 智慧建筑的Start-Ups(2025年):M&A,投资,引人注目的亚太地区的新兴企业