


 |
市场调查报告书
商品编码
1685216
小容量电解器市场机会、成长动力、产业趋势分析及 2025 - 2034 年预测Small Capacity Electrolyzer Market Opportunity, Growth Drivers, Industry Trend Analysis, and Forecast 2025 - 2034 |
||||||
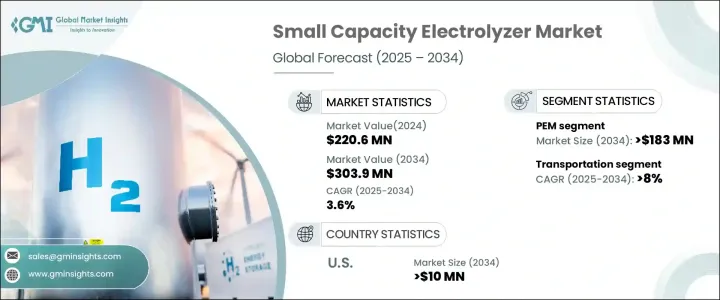
2024 年全球小容量电解器市场价值为 2.206 亿美元,预计 2025 年至 2034 年的复合年增长率为 3.6%。这些利用水电解的紧凑型氢气生成系统对于各种局部应用至关重要,包括研究、小规模工业製程、住宅氢气生产和为氢动力设备提供燃料。它们无需依赖集中式基础设施即可现场生产氢气,这是采用此技术的关键驱动因素。随着全球向清洁能源的转变加速,小容量电解器正成为分散式氢气生产的可行解决方案。
人们对能源独立、永续性和高效氢生态系统发展的日益关注,正在推动各行各业的需求。政府的激励措施和推动清洁氢能计画的政策正在进一步推动市场扩张。此外,技术和製造流程的进步正在降低生产和营运成本,使得这些电解器更容易使用。扩展和无缝整合到不同设置的能力增强了它们的吸引力,特别是对于旨在实现碳中和的行业和地区。投资氢能解决方案的公司正在利用小容量电解器来提高效率并减少对化石燃料的依赖,从而推动该领域的长期成长。
| 市场范围 | |
|---|---|
| 起始年份 | 2024 |
| 预测年份 | 2025-2034 |
| 起始值 | 2.206 亿美元 |
| 预测值 | 3.039 亿美元 |
| 复合年增长率 | 3.6% |
按产品类型划分,质子交换膜 (PEM) 领域预计到 2034 年将产生 1.83 亿美元的产值。 PEM 电解槽之所以受到青睐,是因为它们具有高电流密度、结构紧凑以及对电压波动的快速响应。它们能够最大限度地减少能源传输损失,并在离网地点高效运行,这使得它们对于农村和偏远地区特别有利。膜材料和催化剂的不断创新正在提高 PEM 技术的耐用性和成本效益,增强其市场潜力,并使其成为氢经济成长的主要驱动力。
在应用方面,预计到 2034 年,运输领域将以 8% 的强劲复合年增长率成长。氢动力移动解决方案的日益普及推动了对小容量电解槽的需求,特别是在燃料基础设施的发展方面。加强氢气供应链和促进国际贸易伙伴关係对于这一领域的扩张发挥着至关重要的作用。随着全球努力减少碳排放和向永续能源转型,分散式氢气生产正在获得关注,进一步巩固了电解器在未来交通网络中的作用。
受在地化氢气生产投资增加的推动,美国小容量电解器市场预计到 2034 年将创收 1,000 万美元。随着企业和政策制定者优先考虑能源弹性和减少排放,市场正在经历采用量的激增。再生能源专案数量的不断增长,加上企业整合清洁能源解决方案的倡议,进一步加速了需求。寻求实现永续发展目标的产业正在转向小容量电解器以实现高效的现场氢气生产,巩固其作为向低碳经济转型的关键组成部分的作用。
目录
第 1 章:方法论与范围
- 市场定义
- 基础估算与计算
- 预测计算
- 初步研究与验证
- 主要来源
- 资料探勘来源
- 市场定义
第 2 章:执行摘要
第 3 章:产业洞察
- 产业生态系统
- 监管格局
- 产业衝击力
- 成长动力
- 产业陷阱与挑战
- 成长潜力分析
- 波特的分析
- PESTEL 分析
第四章:竞争格局
- 介绍
- 战略仪表板
- 创新与永续发展格局
第 5 章:市场规模及预测:依产品,2021 – 2034 年
- 主要趋势
- 碱性
- 质子交换膜
- 固体氧化物
- 其他的
第六章:市场规模及预测:依产能,2021 – 2034 年
- 主要趋势
- ≤ 100 千瓦
- > 100 千瓦 - 300 千瓦
- > 300 千瓦 - 500 千瓦
第 7 章:市场规模与预测:按应用,2021 – 2034 年
- 主要趋势
- 发电
- 运输
- 工业能源
- 工业原料
- 其他的
第 8 章:市场规模与预测:按地区,2021 – 2034 年
- 主要趋势
- 北美洲
- 我们
- 加拿大
- 欧洲
- 德国
- 英国
- 法国
- 义大利
- 荷兰
- 丹麦
- 亚太地区
- 中国
- 日本
- 印度
- 澳洲
- 世界其他地区
第九章:公司简介
- Bloom Energy
- Enapter
- Giner
- Green Hydrogen Systems
- ITM Power
- Larsen & Toubro Limited
- Linde
- McPhy Energy
- Ostermeier H2ydrogen Solutions
- Sunfire
The Global Small Capacity Electrolyzer Market, valued at USD 220.6 million in 2024, is on track to experience steady growth with a projected CAGR of 3.6% from 2025 to 2034. These compact hydrogen generation systems, utilizing water electrolysis, are becoming essential for various localized applications, including research, small-scale industrial processes, residential hydrogen production, and fueling hydrogen-powered equipment. Their ability to generate hydrogen on-site without dependence on centralized infrastructure is a key driver of adoption. As the transition to clean energy accelerates worldwide, small capacity electrolyzers are emerging as a viable solution for decentralized hydrogen production.
The increasing focus on energy independence, sustainability, and the development of efficient hydrogen ecosystems is fueling demand across industries. Government incentives and policies promoting clean hydrogen initiatives are further boosting market expansion. Additionally, advancements in technology and manufacturing processes are reducing production and operational costs, making these electrolyzers more accessible. The ability to scale and integrate seamlessly into different setups enhances their appeal, particularly for industries and regions aiming to achieve carbon neutrality. Companies investing in hydrogen-based energy solutions are leveraging small capacity electrolyzers to enhance efficiency and reduce reliance on fossil fuels, driving long-term growth in this segment.
| Market Scope | |
|---|---|
| Start Year | 2024 |
| Forecast Year | 2025-2034 |
| Start Value | $220.6 Million |
| Forecast Value | $303.9 Million |
| CAGR | 3.6% |
By product type, the Proton Exchange Membrane (PEM) segment is poised to generate USD 183 million by 2034. The rising preference for PEM electrolyzers stems from their high current density, compact structure, and rapid response to voltage fluctuations. Their ability to minimize energy transmission losses and operate efficiently in off-grid locations makes them particularly advantageous for rural and remote areas. Continuous innovations in membrane materials and catalysts are improving the durability and cost-effectiveness of PEM technology, reinforcing its market potential and positioning it as a key driver of growth in the hydrogen economy.
In terms of application, the transportation segment is expected to grow at a robust CAGR of 8% through 2034. The increasing adoption of hydrogen-powered mobility solutions is propelling demand for small capacity electrolyzers, particularly in the development of fueling infrastructure. Strengthening hydrogen supply chains and fostering international trade partnerships are playing a crucial role in the expansion of this segment. As global efforts intensify to reduce carbon emissions and transition to sustainable energy sources, decentralized hydrogen production is gaining traction, further cementing electrolyzers' role in the future of transportation networks.
The U.S. small capacity electrolyzer market is projected to generate USD 10 million by 2034, driven by rising investments in localized hydrogen production. With businesses and policymakers prioritizing energy resilience and emissions reduction, the market is witnessing a surge in adoption. The growing number of renewable energy projects, coupled with corporate initiatives to integrate clean energy solutions, is further accelerating demand. Industries looking to meet sustainability targets are turning to small capacity electrolyzers for efficient on-site hydrogen generation, solidifying their role as a critical component in the transition to a low-carbon economy.
Table of Contents
Chapter 1 Methodology & Scope
- 1.1 Market definitions
- 1.2 Base estimates & calculations
- 1.3 Forecast calculation
- 1.4 Primary research & validation
- 1.4.1 Primary sources
- 1.4.2 Data mining sources
- 1.5 Market Definitions
Chapter 2 Executive Summary
- 2.1 Industry synopsis, 2021 – 2034
Chapter 3 Industry Insights
- 3.1 Industry ecosystem
- 3.2 Regulatory landscape
- 3.3 Industry impact forces
- 3.3.1 Growth drivers
- 3.3.2 Industry pitfalls & challenges
- 3.4 Growth potential analysis
- 3.5 Porter's analysis
- 3.5.1 Bargaining power of suppliers
- 3.5.2 Bargaining power of buyers
- 3.5.3 Threat of new entrants
- 3.5.4 Threat of substitutes
- 3.6 PESTEL analysis
Chapter 4 Competitive landscape, 2024
- 4.1 Introduction
- 4.2 Strategic dashboard
- 4.3 Innovation & sustainability landscape
Chapter 5 Market Size and Forecast, By Product, 2021 – 2034 (USD Million & kW)
- 5.1 Key trends
- 5.2 Alkaline
- 5.3 PEM
- 5.4 Solid oxide
- 5.5 Others
Chapter 6 Market Size and Forecast, By Capacity, 2021 – 2034 (USD Million & kW)
- 6.1 Key trends
- 6.2 ≤ 100 kW
- 6.3 > 100 kW - 300 kW
- 6.4 > 300 kW - 500 kW
Chapter 7 Market Size and Forecast, By Application, 2021 – 2034 (USD Million & kW)
- 7.1 Key trends
- 7.2 Power generation
- 7.3 Transportation
- 7.4 Industry energy
- 7.5 Industry feedstock
- 7.6 Others
Chapter 8 Market Size and Forecast, By Region, 2021 – 2034 (USD Million & kW)
- 8.1 Key trends
- 8.2 North America
- 8.2.1 U.S.
- 8.2.2 Canada
- 8.3 Europe
- 8.3.1 Germany
- 8.3.2 UK
- 8.3.3 France
- 8.3.4 Italy
- 8.3.5 Netherlands
- 8.3.6 Denmark
- 8.4 Asia Pacific
- 8.4.1 China
- 8.4.2 Japan
- 8.4.3 India
- 8.4.4 Australia
- 8.5 Rest of World
Chapter 9 Company Profiles
- 9.1 Bloom Energy
- 9.2 Enapter
- 9.3 Giner
- 9.4 Green Hydrogen Systems
- 9.5 ITM Power
- 9.6 Larsen & Toubro Limited
- 9.7 Linde
- 9.8 McPhy Energy
- 9.9 Ostermeier H2ydrogen Solutions
- 9.10 Sunfire
 全球 PEM 小容量电解器市场研究报告 - 产业分析、规模、份额、成长、趋势和预测 2025 年至 2033 年
 电解槽的全球市场:市场规模·占有率·趋势,产业分析 (各技术·各用途·各容量·各地区),未来预测 (2025年~2034年)
 2025 年全球电解槽市场报告
 电解器市场机会、成长动力、产业趋势分析与 2025 - 2034 年预测
 全球电解槽市场:按额定功率、按应用、按技术、按地区 - 到 2030 年的预测SOEC电解槽市场:预测(2025-2030)
 电解槽市场规模、份额、成长分析,按产品类型、产能、应用、地区 - 按行业预测,2024-2031 年
 世界OEM电解槽专案资料库
 电解槽市场:按类型、组件、供应范围、应用分类 - 2025-2030 年全球预测绿色氢电解槽市场:按技术、产能和应用划分 - 2025-2030 年全球预测