


 |
市场调查报告书
商品编码
1664847
P2P 租赁应用市场机会、成长动力、产业趋势分析与 2025 - 2034 年预测P2P Rental Apps Market Opportunity, Growth Drivers, Industry Trend Analysis, and Forecast 2025 - 2034 |
||||||
2024 年全球 P2P 租赁应用市场估值达到 177 亿美元,预计 2025 年至 2034 年期间复合年增长率为 10.9%。
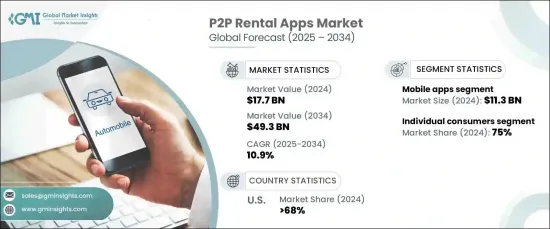
消费者正逐渐从所有权模式转向基于存取权的模式,青睐能够让个人之间共享资产的平台。行动技术、数位支付和直觉的应用程式介面的进步进一步简化了这一流程,使人们更容易租赁或共享车辆、工具和娱乐设备等物品。年轻一代,尤其是千禧世代和 Z 世代,由于倾向于永续性和临时获取商品的便利性而推动了这一趋势。
| 市场范围 | |
|---|---|
| 起始年份 | 2024 |
| 预测年份 | 2025-2034 |
| 起始值 | 177亿美元 |
| 预测值 | 493亿美元 |
| 复合年增长率 | 10.9% |
随着消费者寻求高价值物品的经济实惠的替代品,包括豪华车、休閒车和户外装备在内的专业租赁类别的需求正在增加。迎合这些细分市场的平台正在获得用户参与和忠诚度,而行销活动和社群媒体推广在扩大采用方面发挥关键作用。这种对多样化租赁类别的关注符合消费者对客製化解决方案的需求,有助于 P2P 租赁生态系统的发展。
市场按平台类型分为行动应用程式和基于网路的平台。 2024 年,行动应用程式占据该领域主导地位,创造了 113 亿美元的收入。行动应用程式仍然是首选,因为它们易于访问,并且能够与地理位置、安全支付和即时通知等智慧型手机功能整合。这些功能增强了整体用户体验,实现了即时通讯和顺畅的交易。此外,应用程式专属优惠和促销活动正在吸引更多用户,巩固行动平台作为 P2P 租赁基石的地位。
按终端用户细分,个人消费者在 2023 年占据了 75% 的市场份额。零工工作的兴起和灵活的生活方式推动了短期租赁的需求,使消费者无需长期承诺即可获得资产。用户友好的设计和社交媒体的影响进一步加速了采用,使这些平台成为满足个人和专业需求的首选。
在北美,美国在 2024 年占据了 68% 以上的区域市场份额。
目录
第 1 章:方法论与范围
- 研究设计
- 研究方法
- 资料收集方法
- 基础估计和计算
- 基准年计算
- 市场估计的主要趋势
- 预测模型
- 初步研究与验证
- 主要来源
- 资料探勘来源
- 市场定义
第 2 章:执行摘要
第 3 章:产业洞察
- 产业生态系统分析
- 供应商概况
- 软体供应商
- 技术提供者
- 云端服务供应商
- 系统整合商
- 最终用途
- 利润率分析
- 技术与创新格局
- 重要新闻及倡议
- 监管格局
- 衝击力
- 成长动力
- 越来越多地采用共享经济原则和资源优化
- 智慧型手机普及率不断提高,推动应用程式普及
- 实施安全且使用者友善的支付系统
- 环保意识增强推动协作消费
- 产业陷阱与挑战
- 不同市场的监管环境不同
- 用户之间的信任与安全问题
- 成长动力
- 成长潜力分析
- 波特的分析
- PESTEL 分析
第四章:竞争格局
- 介绍
- 公司市占率分析
- 竞争定位矩阵
- 战略展望矩阵
第五章:市场估计与预测:按租金,2021 - 2034 年
- 主要趋势
- 物业租赁
- 住宅
- 度假租赁
- 共享空间
- 车辆租赁
- 汽车
- 摩托车和踏板车
- 休閒车
- 设备租赁
- 工具和机械
- 体育及健身器材
- 摄影器材
- 其他的
第六章:市场估计与预测:依平台,2021 - 2034 年
- 主要趋势
- 行动应用程式
- 网路为基础的平台
第 7 章:市场估计与预测:按最终用途,2021 - 2034 年
- 主要趋势
- 个人消费者
- 企业和组织
第 8 章:市场估计与预测:按地区,2021 - 2034 年
- 主要趋势
- 北美洲
- 我们
- 加拿大
- 欧洲
- 英国
- 德国
- 法国
- 义大利
- 西班牙
- 北欧
- 亚太地区
- 中国
- 印度
- 日本
- 韩国
- 澳洲
- 东南亚
- 拉丁美洲
- 巴西
- 阿根廷
- 墨西哥
- 中东及非洲
- 阿联酋
- 沙乌地阿拉伯
- 南非
第九章:公司简介
- Airbnb
- BabyQuip
- Booking.com
- Fat Llama
- Getaround
- KitSplit
- Lime
- Neighbor
- Outdoorsy
- Peerby
- Poshmark
- Rent the Runway
- Ruckify
- RVshare
- ShareGrid
- Spinlister
- Style Lend
- Turo
- Vrbo
- Zillow Rentals
The Global P2P Rental Apps Market reached a valuation of USD 17.7 billion in 2024 and is expected to grow at a CAGR of 10.9% from 2025 to 2034. This robust expansion is primarily fueled by the rising popularity of the sharing economy and an increasing preference for on-demand services that offer flexibility and cost savings.
Consumers are gradually shifting from ownership to access-based models, favoring platforms that enable asset sharing between individuals. Advances in mobile technology, digital payments, and intuitive app interfaces have further streamlined this process, making it easier for people to rent or share items such as vehicles, tools, and recreational equipment. Younger generations, particularly millennials and Gen Z, are driving this trend due to their inclination toward sustainability and the convenience of temporary access to goods.
| Market Scope | |
|---|---|
| Start Year | 2024 |
| Forecast Year | 2025-2034 |
| Start Value | $17.7 Billion |
| Forecast Value | $49.3 Billion |
| CAGR | 10.9% |
Specialized rental categories, including luxury cars, recreational vehicles, and outdoor gear, are seeing heightened demand as consumers seek affordable alternatives to owning high-value items. Platforms catering to these niches are gaining user engagement and loyalty, with marketing campaigns and social media outreach playing a pivotal role in expanding adoption. This focus on diverse rental categories aligns with consumers' desire for tailored solutions, contributing to the growth of the P2P rental ecosystem.
The market is divided by platform type into mobile apps and web-based platforms. In 2024, mobile applications dominated the sector, generating USD 11.3 billion in revenue. Mobile apps remain the preferred choice due to their accessibility and integration with smartphone functionalities like geolocation, secure payments, and instant notifications. These features enhance the overall user experience, enabling real-time communication and smooth transactions. Moreover, app-exclusive deals and promotional campaigns are attracting more users, solidifying mobile platforms as the cornerstone of P2P rentals.
When segmented by end users, individual consumers represented 75% of the market share in 2023. These users are drawn to P2P platforms for their affordability, variety, and ease of use. The rise of gig work and flexible lifestyles has driven demand for short-term rentals, allowing consumers to access assets without long-term commitments. User-friendly designs and social media influence has further accelerated adoption, making these platforms a go-to option for personal and professional needs alike.
In North America, the United States accounted for over 68% of the regional market share in 2024. The country's tech-savvy population, widespread smartphone adoption, and thriving sharing economy have cemented its position as a leader in the P2P rental industry.
Table of Contents
Chapter 1 Methodology & Scope
- 1.1 Research design
- 1.1.1 Research approach
- 1.1.2 Data collection methods
- 1.2 Base estimates and calculations
- 1.2.1 Base year calculation
- 1.2.2 Key trends for market estimates
- 1.3 Forecast model
- 1.4 Primary research & validation
- 1.4.1 Primary sources
- 1.4.2 Data mining sources
- 1.5 Market definitions
Chapter 2 Executive Summary
- 2.1 Industry 3600 synopsis, 2021 - 2034
Chapter 3 Industry Insights
- 3.1 Industry ecosystem analysis
- 3.2 Supplier landscape
- 3.2.1 Software provider
- 3.2.2 Technology provider
- 3.2.3 Cloud service provider
- 3.2.4 System Integrators
- 3.2.5 End use
- 3.3 Profit margin analysis
- 3.4 Technology & innovation landscape
- 3.5 Key news & initiatives
- 3.6 Regulatory landscape
- 3.7 Impact forces
- 3.7.1 Growth drivers
- 3.7.1.1 Increasing adoption of shared economy principles and resource optimization
- 3.7.1.2 Rising smartphone penetration facilitating app adoption
- 3.7.1.3 Implementation of secure and user-friendly payment systems
- 3.7.1.4 Growing environmental consciousness promoting collaborative consumption
- 3.7.2 Industry pitfalls & challenges
- 3.7.2.1 Diverse regulatory landscapes across markets
- 3.7.2.2 Trust and security concerns among users
- 3.7.1 Growth drivers
- 3.8 Growth potential analysis
- 3.9 Porter’s analysis
- 3.10 PESTEL analysis
Chapter 4 Competitive Landscape, 2024
- 4.1 Introduction
- 4.2 Company market share analysis
- 4.3 Competitive positioning matrix
- 4.4 Strategic outlook matrix
Chapter 5 Market Estimates & Forecast, By Rental, 2021 - 2034 ($Mn)
- 5.1 Key trends
- 5.2 Property rental
- 5.2.1 Residential
- 5.2.2 Vacation rentals
- 5.2.3 Shared spaces
- 5.3 Vehicle rental
- 5.3.1 Cars
- 5.3.2 Motorcycle & scooter
- 5.3.3 Recreational vehicle
- 5.4 Equipment rental
- 5.4.1 Tools & machinery
- 5.4.2 Sports & fitness equipment
- 5.4.3 Photography equipment
- 5.5 Others
Chapter 6 Market Estimates & Forecast, By Platform, 2021 - 2034 ($Mn)
- 6.1 Key trends
- 6.2 Mobile apps
- 6.3 Web-based platform
Chapter 7 Market Estimates & Forecast, By End Use, 2021 - 2034 ($Mn)
- 7.1 Key trends
- 7.2 Individual consumers
- 7.3 Businesses & organizations
Chapter 8 Market Estimates & Forecast, By Region, 2021 - 2034 ($Mn)
- 8.1 Key trends
- 8.2 North America
- 8.2.1 U.S.
- 8.2.2 Canada
- 8.3 Europe
- 8.3.1 UK
- 8.3.2 Germany
- 8.3.3 France
- 8.3.4 Italy
- 8.3.5 Spain
- 8.3.6 Nordics
- 8.4 Asia Pacific
- 8.4.1 China
- 8.4.2 India
- 8.4.3 Japan
- 8.4.4 South Korea
- 8.4.5 Australia
- 8.4.6 Southeast Asia
- 8.5 Latin America
- 8.5.1 Brazil
- 8.5.2 Argentina
- 8.5.3 Mexico
- 8.6 MEA
- 8.6.1 UAE
- 8.6.2 Saudi Arabia
- 8.6.3 South Africa
Chapter 9 Company Profiles
- 9.1 Airbnb
- 9.2 BabyQuip
- 9.3 Booking.com
- 9.4 Fat Llama
- 9.5 Getaround
- 9.6 KitSplit
- 9.7 Lime
- 9.8 Neighbor
- 9.9 Outdoorsy
- 9.10 Peerby
- 9.11 Poshmark
- 9.12 Rent the Runway
- 9.13 Ruckify
- 9.14 RVshare
- 9.15 ShareGrid
- 9.16 Spinlister
- 9.17 Style Lend
- 9.18 Turo
- 9.19 Vrbo
- 9.20 Zillow Rentals
 销售培训和入职软体市场分析及预测(至2035年):按类型、产品类型、服务、技术、组件、应用、部署类型、最终用户、模组和功能划分
 招募CRM软体市场:功能、定价模式、部署模式、组织规模、产业垂直领域、全球预测(2026-2032年)按营运商类型、公司规模、仓库类型、服务类型、储存类型和最终用户产业分類的全球海关仓储市场预测(2026-2032 年)
 2025年全球云端列印服务市场报告联络人管理软体市场按产品类型、平台、应用、组织规模、部署类型和最终用户行业划分 - 全球预测 2025-2032
 Salesforce AppExchange 工具市场规模(全球),依工具类型、部署类型、垂直产业、区域覆盖范围和预测
 全球云端列印服务市场:截至 2031 年