


 |
市场调查报告书
商品编码
1664858
市政臭氧发生器市场机会、成长动力、产业趋势分析与预测 2025 - 2034Municipal Ozone Generator Market Opportunity, Growth Drivers, Industry Trend Analysis, and Forecast 2025 - 2034 |
||||||
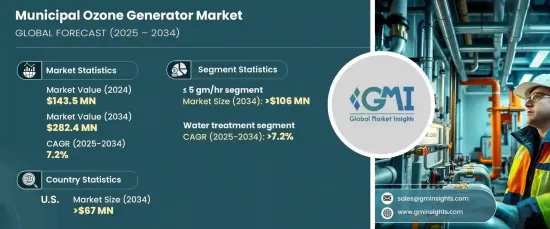
2024 年全球市政臭氧发生器市场价值为 1.435 亿美元,预计 2025 年至 2034 年期间将以 7.2% 的强劲复合年增长率增长。这确保了市政供水的安全分配和对环境负责的废水排放。
市政臭氧发生器日益普及的关键驱动因素之一是人们越来越重视环境永续性。这些环保系统不会留下任何有害残留物,符合全球保护环境的努力。此外,消除水中的药物、微塑胶和个人护理产品残留物等新兴污染物的挑战日益严峻,大大增加了对臭氧发生器的需求。它们能有效分解复杂污染物,成为寻求先进处理解决方案的市政当局的首选。
| 市场范围 | |
|---|---|
| 起始年份 | 2024 |
| 预测年份 | 2025-2034 |
| 起始值 | 1.435亿美元 |
| 预测值 | 2.824亿美元 |
| 复合年增长率 | 7.2% |
市场按容量进行细分,预计到 2034 年,<= 5 g/h 细分市场将产生 1.06 亿美元的收入。这一增长主要得益于对紧凑型发电机组日益增长的需求,这种发电机组非常适合处理较小的水库、局部供水和基础设施有限地区的补充系统。这些单位的成本效益使其对人口较少或预算有限的城市特别有吸引力,从而推动了它们的广泛采用。
按应用划分,预计到 2034 年,水处理领域的复合年增长率将达到 7.2%。这些系统提供无化学消毒,尽量减少副产品的形成,进而降低环境和健康风险。它们能够满足严格的污染物去除准则,这使它们成为现代水处理实践中必不可少的工具。
在美国,市政臭氧发生器市场预计到 2034 年将创收 6,700 万美元。此外,美国老化的水利基础设施正在推动现代化的需求,市政当局正在寻求提高营运效率的解决方案。臭氧发生器配备远端监控和能源优化等功能,作为升级水系统的可靠解决方案,正变得越来越受欢迎。
目录
第 1 章:方法论与范围
- 市场定义
- 基础估算与计算
- 预测计算
- 初步研究与验证
- 主要来源
- 资料探勘来源
- 市场定义
第 2 章:执行摘要
第 3 章:产业洞察
- 产业生态系统
- 监管格局
- 产业衝击力
- 成长动力
- 产业陷阱与挑战
- 成长潜力分析
- 波特的分析
- 供应商的议价能力
- 买家的议价能力
- 新进入者的威胁
- 替代品的威胁
- PESTEL 分析
第四章:竞争格局
- 介绍
- 战略仪表板
- 创新与技术格局
第 5 章:市场规模与预测:依技术,2021 – 2034 年
- 主要趋势
- 紫外线
- 冷等离子
- 电晕放电
- 电解
第 6 章:市场规模与预测:按应用,2021 – 2034 年
- 主要趋势
- 水处理
- 实验室和医疗设备
- 空气处理
- 其他的
第 7 章:市场规模及预测:依产能,2021 – 2034 年
- 主要趋势
- ≤ 5 克/小时
- 5 克/小时 - 100 克/小时
- 100 克/小时 - 1 公斤/小时
- 1 公斤/小时 - 5 公斤/小时
- > 5 公斤/小时
第 8 章:市场规模与预测:按地区,2021 – 2034 年
- 主要趋势
- 北美洲
- 我们
- 加拿大
- 欧洲
- 德国
- 英国
- 法国
- 俄罗斯
- 义大利
- 西班牙
- 亚太地区
- 中国
- 澳洲
- 印度
- 日本
- 韩国
- 中东和非洲
- 沙乌地阿拉伯
- 阿联酋
- 埃及
- 土耳其
- 南非
- 拉丁美洲
- 巴西
- 阿根廷
第九章:公司简介
- BIO-UV
- DEL Ozone
- Eltech Ozone
- Faraday Ozone
- Lenntech Water Treatment
- ORAIPL
- Oxidation Technologies
- Oxyzone International
- Ozone Solutions
- Primozone
- SUEZ Group
- Veolia
The Global Municipal Ozone Generator Market, valued at USD 143.5 million in 2024, is projected to grow at a robust CAGR of 7.2% from 2025 to 2034. These advanced systems are designed to produce ozone gas for large-scale water and wastewater treatment harnessing its powerful oxidizing properties to disinfect water, degrade pollutants, and remove odors and harmful chemicals. This ensures the safe distribution of municipal water and environmentally responsible wastewater discharge.
One of the key drivers behind the growing adoption of municipal ozone generators is the increasing emphasis on environmental sustainability. These eco-friendly systems leave no harmful residues, aligning with global efforts to protect the environment. Moreover, the rising challenge of eliminating emerging contaminants, such as pharmaceuticals, microplastics, and personal care product residues from water supplies, has significantly boosted the demand for ozone generators. Their effectiveness in breaking down complex pollutants makes them a top choice for municipalities looking for advanced treatment solutions.
| Market Scope | |
|---|---|
| Start Year | 2024 |
| Forecast Year | 2025-2034 |
| Start Value | $143.5 Million |
| Forecast Value | $282.4 Million |
| CAGR | 7.2% |
The market is segmented by capacity, with the <= 5 g/h segment expected to generate USD 106 million by 2034. This growth is largely driven by the increasing demand for compact generator units, ideal for treating smaller water reservoirs, localized water supplies, and supplementary systems in regions with limited infrastructure. The cost-effectiveness of these units makes them particularly appealing to municipalities with smaller populations or constrained budgets, fueling their widespread adoption.
By application, the water treatment segment is forecast to grow at a CAGR of 7.2% through 2034. Stricter regulations surrounding drinking water safety and wastewater discharge are driving the demand for ozone generators. These systems offer chemical-free disinfection with minimal byproduct formation, reducing environmental and health risks. Their ability to meet stringent guidelines for contaminant removal positions them as an essential tool in modern water treatment practices.
In the United States, the municipal ozone generator market is expected to generate USD 67 million by 2034. The need to address emerging contaminants, such as PFAS and microplastics, is fueling the demand for these high-efficiency systems. Furthermore, the aging water infrastructure in the U.S. is driving the need for modernization, with municipalities seeking solutions that improve operational efficiency. Ozone generators, equipped with features like remote monitoring and energy optimization, are becoming increasingly popular as reliable solutions to upgrade water systems.
Table of Contents
Chapter 1 Methodology & Scope
- 1.1 Market definitions
- 1.2 Base estimates & calculations
- 1.3 Forecast calculation
- 1.4 Primary research & validation
- 1.4.1 Primary sources
- 1.4.2 Data mining sources
- 1.5 Market definitions
Chapter 2 Executive Summary
- 2.1 Industry synopsis, 2021 – 2034
Chapter 3 Industry Insights
- 3.1 Industry ecosystem
- 3.2 Regulatory landscape
- 3.3 Industry impact forces
- 3.3.1 Growth drivers
- 3.3.2 Industry pitfalls & challenges
- 3.4 Growth potential analysis
- 3.5 Porter's analysis
- 3.5.1 Bargaining power of suppliers
- 3.5.2 Bargaining power of buyers
- 3.5.3 Threat of new entrants
- 3.5.4 Threat of substitutes
- 3.6 PESTEL analysis
Chapter 4 Competitive landscape, 2024
- 4.1 Introduction
- 4.2 Strategic dashboard
- 4.3 Innovation & technology landscape
Chapter 5 Market Size and Forecast, By Technology, 2021 – 2034 (USD Million & Units)
- 5.1 Key trends
- 5.2 Ultraviolet
- 5.3 Cold plasma
- 5.4 Corona discharge
- 5.5 Electrolytic
Chapter 6 Market Size and Forecast, By Application, 2021 – 2034 (USD Million & Units)
- 6.1 Key trends
- 6.2 Water treatment
- 6.3 Laboratory & medical equipment
- 6.4 Air Treatment
- 6.5 Others
Chapter 7 Market Size and Forecast, By Capacity, 2021 – 2034 (USD Million & Units)
- 7.1 Key trends
- 7.2 ≤ 5 gm/hr
- 7.3 5 gm/hr - 100 gm/hr
- 7.4 100 gm/hr - 1 kg/hr
- 7.5 1 kg/hr - 5 kg/hr
- 7.6 > 5 kg/hr
Chapter 8 Market Size and Forecast, By Region, 2021 – 2034 (USD Million & Units)
- 8.1 Key trends
- 8.2 North America
- 8.2.1 U.S.
- 8.2.2 Canada
- 8.3 Europe
- 8.3.1 Germany
- 8.3.2 UK
- 8.3.3 France
- 8.3.4 Russia
- 8.3.5 Italy
- 8.3.6 Spain
- 8.4 Asia Pacific
- 8.4.1 China
- 8.4.2 Australia
- 8.4.3 India
- 8.4.4 Japan
- 8.4.5 South Korea
- 8.5 Middle East & Africa
- 8.5.1 Saudi Arabia
- 8.5.2 UAE
- 8.5.3 Egypt
- 8.5.4 Turkey
- 8.5.5 South Africa
- 8.6 Latin America
- 8.6.1 Brazil
- 8.6.2 Argentina
Chapter 9 Company Profiles
- 9.1 BIO-UV
- 9.2 DEL Ozone
- 9.3 Eltech Ozone
- 9.4 Faraday Ozone
- 9.5 Lenntech Water Treatment
- 9.6 ORAIPL
- 9.7 Oxidation Technologies
- 9.8 Oxyzone International
- 9.9 Ozone Solutions
- 9.10 Primozone
- 9.11 SUEZ Group
- 9.12 Veolia
 紫外线臭氧消毒设备:全球市占率及排名、总收入及需求预测(2025-2031年)
 臭氧产生器市场按应用、最终用户、类型、技术和分销管道划分—全球预测 2025-2032
 全球工业製氧机市场(按气体类型/流量、尺寸、设计、技术、最终用途产业和地区划分)- 预测至2030年
 2025年全球臭氧产生器市场报告
 2025-2033年臭氧发生器市场报告(依技术、应用、最终用途及地区)
 全球市政臭氧发生器市场全球工业臭氧产生器市场臭氧产生器市场规模、份额和趋势分析报告:按技术、应用、最终用途、地区和细分市场预测,2025 年至 2033 年2025年全球水处理臭氧产生器市场报告日本臭氧发生器市场报告(按技术、应用、最终用户和地区)2025-2033