


 |
市场调查报告书
商品编码
1664873
货柜装卸设备市场机会、成长动力、产业趋势分析及 2025 - 2034 年预测Container Handling Equipment Market Opportunity, Growth Drivers, Industry Trend Analysis, and Forecast 2025 - 2034 |
||||||
2024 年全球货柜装卸设备市场价值为 86 亿美元,预计 2025 年至 2034 年期间将以 5.4% 的强劲复合年增长率增长。 这一增长是由对高效集装箱装卸解决方案的需求不断增长所推动的,而推动货物的偏好和对日益增长。随着全球供应链变得越来越复杂,起重机、堆迭机和自动化技术等先进系统的采用正在迅速增加。港口扩建和基础设施升级的投资进一步加速了对最先进设备的需求,以满足现代物流不断变化的需求。
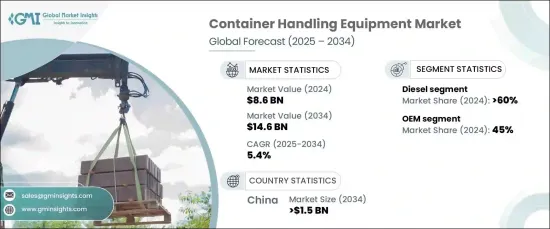
市场依推进方式分为柴油、电力和混合动力系统。 2024 年,柴油动力设备占据了 60% 的主导份额,预计到 2034 年将达到 60 亿美元。它可提供高功率输出,非常适合重型作业,特别是在电力基础设施有限的环境中。柴油动力系统的多功能性和可靠性确保它们将保持领先地位,特别是在大型港口和物流枢纽。
| 市场范围 | |
|---|---|
| 起始年份 | 2024 |
| 预测年份 | 2025-2034 |
| 起始值 | 86亿美元 |
| 预测值 | 146亿美元 |
| 复合年增长率 | 5.4% |
依容量,市场分为10吨以下、10-50吨、50吨以上。容量高达 10 吨的市场由于其经济实惠、灵活性以及在各个行业的广泛使用而引领市场。这些系统通常用于处理中型货物的仓库、製造工厂和港口。与大容量设备相比,它们的成本较低,因此可以被更广泛的营运商使用,这进一步加强了它们在市场上的主导地位。
2024 年,中国货柜装卸设备市场占全球份额的 30%,预计到 2034 年将创下 15 亿美元的市场价值。作为全球贸易强国,中国在市场上发挥着至关重要的作用,利用其大规模的生产能力和有竞争力的价格来满足日益增长的货柜装卸设备需求。
目录
第 1 章:方法论与范围
- 研究设计
- 研究方法
- 资料收集方法
- 基础估计和计算
- 基准年计算
- 市场估计的主要趋势
- 预测模型
- 初步研究与验证
- 主要来源
- 资料探勘来源
- 市场定义
第 2 章:执行摘要
第 3 章:产业洞察
- 产业生态系统分析
- 供应商概况
- 製造商
- 技术提供者
- 经销商
- 最终用户
- 利润率分析
- 设备成本明细
- 技术与创新格局
- 专利格局
- 使用案例
- 重要新闻及倡议
- 监管格局
- 衝击力
- 成长动力
- 全球贸易和货柜货运量成长
- 采用自动化和数位技术
- 港口扩建和基础设施发展
- 设备技术进步
- 产业陷阱与挑战
- 初期资本投入高
- 营运和维护成本
- 成长动力
- 成长潜力分析
- 波特的分析
- PESTEL 分析
第四章:竞争格局
- 介绍
- 公司市占率分析
- 竞争定位矩阵
- 战略展望矩阵
第 5 章:市场估计与预测:按设备,2021 - 2034 年
- 主要趋势
- 自动堆迭起重机 (ASC)
- 空箱搬运堆高机 (FLT)
- 载货堆高机 (FLT)
- 移动式港口起重机 (MHC)
- 轨道式龙门起重机 (RMG)
- 正面吊
- 轮胎式龙门起重机 (RTG)
- 船到岸 (STS) 起重机
- 其他的
第 6 章:市场估计与预测:按应用,2021 - 2034 年
- 主要趋势
- 港口码头
- 铁路枢纽
- 内陆货柜堆场 (ICD)
- 物流中心
第 7 章:市场估计与预测:按推进方式,2021 - 2034 年
- 主要趋势
- 柴油引擎
- 电的
- 杂交种
第 8 章:市场估计与预测:按产能,2021 - 2034 年
- 主要趋势
- 最多 10 吨
- 10-50吨
- 50吨及以上
第 9 章:市场估计与预测:按地区,2021 - 2034 年
- 主要趋势
- 北美洲
- 我们
- 加拿大
- 欧洲
- 英国
- 德国
- 法国
- 西班牙
- 义大利
- 俄罗斯
- 北欧
- 亚太地区
- 中国
- 印度
- 日本
- 韩国
- 澳新银行
- 东南亚
- 拉丁美洲
- 巴西
- 墨西哥
- 阿根廷
- 中东及非洲
- 阿联酋
- 南非
- 沙乌地阿拉伯
第十章:公司简介
- Konecranes
- Cargotec
- Liebherr Group
- ZPMC (Shanghai Zhenhua Heavy Industries Company)
- Terex
- Doosan Heavy Industries & Construction
- Hyster-Yale Materials Handling
- Toyota Industries
- Mitsubishi Heavy Industries
- SANY Group
- Caterpillar Inc.
- Hyundai Heavy Industries
- Kalmar
- Manitowoc Crane Group
- STILL GmbH
- Jungheinrich AG
- Palfinger AG
- TMEIC Corporation
- Furukawa Electric Co., Ltd.
- ABUS Kransysteme GmbH
The Global Container Handling Equipment Market was valued at USD 8.6 billion in 2024 and is expected to grow at a robust CAGR of 5.4% from 2025 to 2034. This growth is driven by the increasing demand for efficient container handling solutions, fueled by rising international trade and the growing preference for containerized cargo. As global supply chains become more complex, the adoption of advanced systems such as cranes, stackers, and automated technologies is rapidly increasing. Investments in port expansions and infrastructure upgrades are further accelerating the need for state-of-the-art equipment to meet the evolving demands of modern logistics.
The market is segmented by propulsion into diesel, electric, and hybrid systems. Diesel-powered equipment held a dominant 60% share in 2024 and is projected to reach USD 6 billion by 2034. Diesel continues to be a popular choice due to its reliability, well-established infrastructure, and cost-effectiveness. It delivers high power output, making it ideal for heavy-duty operations, especially in environments with limited electric infrastructure. The versatility and dependability of diesel-powered systems ensure they will maintain their lead, particularly in large-scale ports and logistics hubs.
| Market Scope | |
|---|---|
| Start Year | 2024 |
| Forecast Year | 2025-2034 |
| Start Value | $8.6 Billion |
| Forecast Value | $14.6 Billion |
| CAGR | 5.4% |
By capacity, the market is divided into up to 10 tons, 10-50 tons, and 50 tons and above. The up to 10 tons capacity segment is leading the market thanks to its affordability, flexibility, and widespread use across industries. These systems are commonly found in warehouses, manufacturing facilities, and ports handling medium-sized cargo. Their lower cost compared to higher-capacity equipment makes them accessible to a wider range of operators, further strengthening their dominance in the market.
The container handling equipment market in China accounted for 30% of the global share in 2024 and is set to generate USD 1.5 billion by 2034. The country's leadership is attributed to its strong manufacturing capabilities, cost-effective production, and strategic investments in port infrastructure. As a global trade powerhouse, China plays a crucial role in the market, leveraging its large-scale production capacity and competitive pricing to meet the growing demand for container handling equipment.
Table of Contents
Chapter 1 Methodology & Scope
- 1.1 Research design
- 1.1.1 Research approach
- 1.1.2 Data collection methods
- 1.2 Base estimates and calculations
- 1.2.1 Base year calculation
- 1.2.2 Key trends for market estimates
- 1.3 Forecast model
- 1.4 Primary research & validation
- 1.4.1 Primary sources
- 1.4.2 Data mining sources
- 1.5 Market definitions
Chapter 2 Executive Summary
- 2.1 Industry 3600 synopsis, 2021 - 2034
Chapter 3 Industry Insights
- 3.1 Industry ecosystem analysis
- 3.2 Supplier landscape
- 3.2.1 Manufacturers
- 3.2.2 Technology providers
- 3.2.3 Distributors
- 3.2.4 End users
- 3.3 Profit margin analysis
- 3.4 Cost Breakdown of equipment
- 3.5 Technology & innovation landscape
- 3.6 Patent landscape
- 3.7 Use cases
- 3.8 Key news & initiatives
- 3.9 Regulatory landscape
- 3.10 Impact forces
- 3.10.1 Growth drivers
- 3.10.1.1 Growth in global trade and containerized cargo
- 3.10.1.2 Adoption of automation and digital technologies
- 3.10.1.3 Port expansion and infrastructure development
- 3.10.1.4 Technological advancements in equipment
- 3.10.2 Industry pitfalls & challenges
- 3.10.2.1 High initial capital investment
- 3.10.2.2 Operational and maintenance costs
- 3.10.1 Growth drivers
- 3.11 Growth potential analysis
- 3.12 Porter’s analysis
- 3.13 PESTEL analysis
Chapter 4 Competitive Landscape, 2024
- 4.1 Introduction
- 4.2 Company market share analysis
- 4.3 Competitive positioning matrix
- 4.4 Strategic outlook matrix
Chapter 5 Market Estimates & Forecast, By Equipment, 2021 - 2034 ($Bn, Units)
- 5.1 Key trends
- 5.2 Automated Stacking Crane (ASC)
- 5.3 Empty Container Handling Forklift Truck (FLT)
- 5.4 Laden Forklift Truck (FLT)
- 5.5 Mobile Harbor Crane (MHC)
- 5.6 Rail Mounted Gantry (RMG) Crane
- 5.7 Reach Stacker
- 5.8 Rubber Tired Gantry (RTG) Crane
- 5.9 Ship to Shore (STS) Crane
- 5.10 Others
Chapter 6 Market Estimates & Forecast, By Application, 2021 - 2034 ($Bn, Units)
- 6.1 Key trends
- 6.2 Port terminals
- 6.3 Railway terminals
- 6.4 Inland Container Depots (ICDs)
- 6.5 Logistics Hubs
Chapter 7 Market Estimates & Forecast, By Propulsion, 2021 - 2034 ($Bn, Units)
- 7.1 Key trends
- 7.2 Diesel
- 7.3 Electric
- 7.4 Hybrid
Chapter 8 Market Estimates & Forecast, By Capacity, 2021 - 2034 ($Bn, Units)
- 8.1 Key trends
- 8.2 Up to 10 tons
- 8.3 10-50 tons
- 8.4 50 tons and above
Chapter 9 Market Estimates & Forecast, By Region, 2021 - 2034 ($Bn, Units)
- 9.1 Key trends
- 9.2 North America
- 9.2.1 U.S.
- 9.2.2 Canada
- 9.3 Europe
- 9.3.1 UK
- 9.3.2 Germany
- 9.3.3 France
- 9.3.4 Spain
- 9.3.5 Italy
- 9.3.6 Russia
- 9.3.7 Nordics
- 9.4 Asia Pacific
- 9.4.1 China
- 9.4.2 India
- 9.4.3 Japan
- 9.4.4 South Korea
- 9.4.5 ANZ
- 9.4.6 Southeast Asia
- 9.5 Latin America
- 9.5.1 Brazil
- 9.5.2 Mexico
- 9.5.3 Argentina
- 9.6 MEA
- 9.6.1 UAE
- 9.6.2 South Africa
- 9.6.3 Saudi Arabia
Chapter 10 Company Profiles
- 10.1 Konecranes
- 10.2 Cargotec
- 10.3 Liebherr Group
- 10.4 ZPMC (Shanghai Zhenhua Heavy Industries Company)
- 10.5 Terex
- 10.6 Doosan Heavy Industries & Construction
- 10.7 Hyster-Yale Materials Handling
- 10.8 Toyota Industries
- 10.9 Mitsubishi Heavy Industries
- 10.10 SANY Group
- 10.11 Caterpillar Inc.
- 10.12 Hyundai Heavy Industries
- 10.13 Kalmar
- 10.14 Manitowoc Crane Group
- 10.15 STILL GmbH
- 10.16 Jungheinrich AG
- 10.17 Palfinger AG
- 10.18 TMEIC Corporation
- 10.19 Furukawa Electric Co., Ltd.
- 10.20 ABUS Kransysteme GmbH
 单深度伸缩叉市场按负载能力、操作类型、材料类型、最终用途产业、分销管道和客户规模划分-全球预测,2026-2032年堆垛机伸缩叉市场:按产品类型、操作类型、承载能力、门架类型、驱动类型、叉长和最终用户产业划分,全球预测,2026-2032年三段式伸缩叉市场(依最终用户、应用、材料、通路和叉型划分)-全球预测,2026-2032年纸箱装卸伸缩叉市场:依终端使用者产业、驱动类型、提升能力、作业半径与销售管道划分,全球预测(2026-2032年)
 实心轮胎堆高机市场-2026-2031年预测STS(Ship-to-Shore)货柜起重机市场规模、占有率、成长及全球产业分析:依类型、应用和地区划分的洞察与未来预测(2026-2034)卡车升降坡道市场按类型、销售、通路、应用和最终用途划分-2026年至2032年全球预测堆高机货柜坡道市场:按产品类型、承载能力、操作类型、最终用户和分销管道划分 - 全球预测 2026-2032
 货柜装卸设备市场规模、份额、趋势分析报告:按设备类型、推进类型、起重能力、装卸模式、最终用途、地区、细分市场预测,2025-2030 年
 货柜装卸设备市场,规模,占有率,趋势,产业分析报告:类别,推动类别,钓上来按能力,处理模式别,各最终用途,各地区,2025年~2034年的市场预测