


 |
市场调查报告书
商品编码
1665061
加油站设备市场机会、成长动力、产业趋势分析与预测 2024 - 2032Gas Station Equipment Market Opportunity, Growth Drivers, Industry Trend Analysis, and Forecast 2024 - 2032 |
||||||
2023 年全球加油站设备市场价值为 71 亿美元,预计将实现稳步增长,2024 年至 2032 年期间的复合年增长率为 4.7%。随着对减少碳排放的关注度不断提高,人们明显转向使用替代燃料,例如压缩天然气(CNG)、氢气和电动车(EV)充电站。这种转变促使加油站业者采用先进的加油设备、创新的储存系统和整合软体解决方案来实现基础设施的现代化,以满足消费者不断变化的偏好。
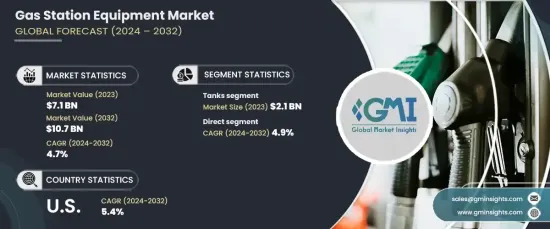
市场按类型细分为油箱、加油机、喷嘴、泵浦、软管、轮胎充气机、便利商店 (C-store) 设备和其他相关产品。其中,坦克占最大份额,2023 年贡献 21 亿美元。油箱对于燃料的储存和安全至关重要,是任何加油站运作的重要组成部分。他们确保遵守法规和降低环境风险的能力增强了他们在市场上的主导地位。
| 市场范围 | |
|---|---|
| 起始年份 | 2023 |
| 预测年份 | 2024-2032 |
| 起始值 | 71亿美元 |
| 预测值 | 107亿美元 |
| 复合年增长率 | 4.7% |
就分销通路而言,市场分为直接分销和间接分销。直接分销管道在 2023 年占据市场主导地位,占有 52.6% 的份额,预计到 2032 年将以 4.9% 的复合年增长率增长。这种方法可以提供客製化解决方案、更快交付和更好的售后服务。此外,它还为製造商提供即时回馈,从而不断改进并提高客户满意度。
美国加油站设备市场在 2023 年创造了 14 亿美元的收入,预计到 2032 年将以 5.4% 的强劲复合年增长率增长。对尖端加油技术的持续投资以及电动车充电网路的扩展将进一步推动其市场成长。
目录
第 1 章:方法论与范围
- 市场范围和定义
- 基础估算与计算
- 预测参数
- 资料来源
- 基本的
- 次要
- 付费来源
- 公共资源
第 2 章:执行摘要
第 3 章:产业洞察
- 产业生态系统分析
- 影响价值链的因素
- 利润率分析
- 中断
- 未来展望
- 製造商
- 经销商
- 供应商概况
- 利润率分析
- 重要新闻及倡议
- 监管格局
- 技术格局
- 衝击力
- 成长动力
- 替代燃料和电动车充电基础设施的采用日益增多。
- 燃料分配和自动化系统的技术进步。
- 对节能环保设备的需求不断增加。
- 扩大交通网络和都市化
- 产业陷阱与挑战
- 初期投资及维护成本较高。
- 法规遵从性和环境问题
- 成长动力
- 成长潜力分析
- 波特的分析
- PESTEL 分析
第四章:竞争格局
- 介绍
- 公司市占率分析
- 竞争定位矩阵
- 战略展望矩阵
第 5 章:市场估计与预测:按类型,2021 – 2032 年
- 主要趋势
- 坦克
- 加油机
- 喷嘴
- 泵浦
- 软管
- 轮胎充气机
- 便利商店设备
- 其他(泵浦过滤器等)
第六章:市场估计与预测:依燃料类型,2021 – 2032 年
- 主要趋势
- 汽油
- 柴油引擎
- 生物燃料
- 压缩天然气(CNG)
- 液化天然气(LNG)
- 氢气燃料
- 其他的
第 7 章:市场估计与预测:依最终用途,2021 年至 2032 年
- 主要趋势
- 零售加油站
- 商业船队
- 航空
- 海洋
- 军队
第 8 章:市场估计与预测:按配销通路,2021 年至 2032 年
- 主要趋势
- 直接的
- 间接
第 9 章:市场估计与预测:按地区,2021 年至 2032 年
- 主要趋势
- 北美洲
- 我们
- 加拿大
- 欧洲
- 英国
- 德国
- 法国
- 义大利
- 西班牙
- 亚太地区
- 中国
- 日本
- 印度
- 澳洲
- 拉丁美洲
- 巴西
- 墨西哥
- 中东及非洲
- 南非
- 沙乌地阿拉伯
- 阿联酋
第十章:公司简介
- Beijing Sanki Petroleum Technology
- Bennett Pump Company
- Censtar Science and Technology Corp. Ltd.
- China Hongyang
- Dover Corporation
- Franklin Fueling Systems
- Gilbarco Veeder-Root
- Jiangsu Furen Group
- Korea EnE Co. Ltd.
- Peltek
- Tatsuno Corporation
- Tokheim Group
- U-Fuel Corporate HongYang Group
- VeriFone
- Wayne Fueling Systems
The Global Gas Station Equipment Market was valued at USD 7.1 billion in 2023 and is expected to experience steady growth, expanding at a CAGR of 4.7% from 2024 to 2032. This growth is being driven by the increasing demand for advanced fueling systems and energy-efficient technologies. As the focus on reducing carbon emissions intensifies, there has been a marked shift toward alternative fuels such as compressed natural gas (CNG), hydrogen, and electric vehicle (EV) charging stations. This transition is prompting gas station operators to modernize their infrastructure with cutting-edge dispensing equipment, innovative storage systems, and integrated software solutions to meet the changing preferences of consumers.
The market is segmented by type into tanks, fuel dispensers, nozzles, pumps, hoses, tire inflators, convenience store (C-store) equipment, and other related products. Among these, tanks hold the largest share, contributing USD 2.1 billion in 2023. They are projected to grow at a CAGR of 4.6% over the forecast period. Tanks are crucial for fuel storage and safety, making them an essential part of any gas station operation. Their ability to ensure compliance with regulations and minimize environmental risks reinforces their dominance in the market.
| Market Scope | |
|---|---|
| Start Year | 2023 |
| Forecast Year | 2024-2032 |
| Start Value | $7.1 Billion |
| Forecast Value | $10.7 Billion |
| CAGR | 4.7% |
In terms of distribution channels, the market is divided into direct and indirect segments. The direct segment led the market in 2023, holding a 52.6% share, and is expected to grow at a CAGR of 4.9% through 2032. Direct distribution channels are favored due to their ability to create stronger relationships between manufacturers and end-users. This approach allows for tailored solutions, faster delivery, and better after-sales service. Additionally, it provides manufacturers with real-time feedback, allowing for continuous improvement and enhanced customer satisfaction.
The U.S. gas station equipment market generated USD 1.4 billion in 2023 and is forecast to grow at a robust CAGR of 5.4% through 2032. The country's well-established fueling infrastructure and high vehicle ownership rates contribute to its dominant market position. Ongoing investments in cutting-edge fueling technologies, along with the expansion of EV charging networks, will further boost its market growth.
Table of Contents
Chapter 1 Methodology & Scope
- 1.1 Market scope & definition
- 1.2 Base estimates & calculations
- 1.3 Forecast parameters
- 1.4 Data sources
- 1.4.1 Primary
- 1.5 Secondary
- 1.5.1 Paid sources
- 1.5.2 Public sources
Chapter 2 Executive Summary
- 2.1 Industry synopsis, 2021 - 2032
Chapter 3 Industry Insights
- 3.1 Industry ecosystem analysis
- 3.1.1 Factor affecting the value chain
- 3.1.2 Profit margin analysis
- 3.1.3 Disruptions
- 3.1.4 Future outlook
- 3.1.5 Manufacturers
- 3.1.6 Distributors
- 3.2 Supplier landscape
- 3.3 Profit margin analysis
- 3.4 Key news & initiatives
- 3.5 Regulatory landscape
- 3.6 Technological landscape
- 3.7 Impact forces
- 3.7.1 Growth drivers
- 3.7.1.1 Increasing adoption of alternative fuels and EV charging infrastructure.
- 3.7.1.2 Technological advancements in fuel dispensing and automation systems.
- 3.7.1.3 Rising demand for energy-efficient and eco-friendly equipment.
- 3.7.1.4 Expanding transportation networks and urbanization
- 3.7.2 Industry pitfalls & challenges
- 3.7.2.1 High initial investment and maintenance costs.
- 3.7.2.2 Regulatory compliance and environmental concerns
- 3.7.1 Growth drivers
- 3.8 Growth potential analysis
- 3.9 Porter’s analysis
- 3.10 PESTEL analysis
Chapter 4 Competitive Landscape, 2023
- 4.1 Introduction
- 4.2 Company market share analysis
- 4.3 Competitive positioning matrix
- 4.4 Strategic outlook matrix
Chapter 5 Market Estimates and Forecast, By Type, 2021 – 2032 (USD Billion) (Thousand units)
- 5.1 Key trends
- 5.2 Tanks
- 5.3 Fuel dispensers
- 5.4 Nozzles
- 5.5 Pumps
- 5.6 Hoses
- 5.7 Tire inflators
- 5.8 C-Store equipment
- 5.9 Others (pump filters, etc.)
Chapter 6 Market Estimates and Forecast, By Fuel Type, 2021 – 2032 (USD Billion) (Thousand units)
- 6.1 Key trends
- 6.2 Gasoline
- 6.3 Diesel
- 6.4 Biofuel
- 6.5 Compressed Natural Gas (CNG)
- 6.6 Liquefied Natural Gas (LNG)
- 6.7 Hydrogen fueling
- 6.8 Others
Chapter 7 Market Estimates and Forecast, By End Use, 2021 – 2032 (USD Billion) (Thousand units)
- 7.1 Key trends
- 7.2 Retail gas stations
- 7.3 Commercial fleets
- 7.4 Aviation
- 7.5 Marine
- 7.6 Military
Chapter 8 Market Estimates & Forecast, By Distribution Channel, 2021 – 2032, (USD Billion) (Thousand units)
- 8.1 Key trends
- 8.2 Direct
- 8.3 Indirect
Chapter 9 Market Estimates & Forecast, By Region, 2021 – 2032, (USD Billion) (Thousand units)
- 9.1 Key trends
- 9.2 North America
- 9.2.1 U.S.
- 9.2.2 Canada
- 9.3 Europe
- 9.3.1 UK
- 9.3.2 Germany
- 9.3.3 France
- 9.3.4 Italy
- 9.3.5 Spain
- 9.4 Asia Pacific
- 9.4.1 China
- 9.4.2 Japan
- 9.4.3 India
- 9.4.4 Australia
- 9.5 Latin America
- 9.5.1 Brazil
- 9.5.2 Mexico
- 9.6 MEA
- 9.6.1 South Africa
- 9.6.2 Saudi Arabia
- 9.6.3 UAE
Chapter 10 Company Profiles (Business Overview, Financial Data, Product Landscape, Strategic Outlook, SWOT Analysis)
- 10.1 Beijing Sanki Petroleum Technology
- 10.2 Bennett Pump Company
- 10.3 Censtar Science and Technology Corp. Ltd.
- 10.4 China Hongyang
- 10.5 Dover Corporation
- 10.6 Franklin Fueling Systems
- 10.7 Gilbarco Veeder-Root
- 10.8 Jiangsu Furen Group
- 10.9 Korea EnE Co. Ltd.
- 10.10 Peltek
- 10.11 Tatsuno Corporation
- 10.12 Tokheim Group
- 10.13 U-Fuel Corporate HongYang Group
- 10.14 VeriFone
- 10.15 Wayne Fueling Systems
 2026年全球加油站设备市场报告
 2024-2028年全球加油站设备市场
 加油站设备市场(类型:油箱、加油机、喷嘴、泵浦、软管、轮胎充气机、便利商店设备等)- 2024-2034 年全球产业分析、规模、份额、成长、趋势与预测