


 |
市场调查报告书
商品编码
1665212
显示材料市场机会、成长动力、产业趋势分析与 2025 - 2034 年预测Display Material Market Opportunity, Growth Drivers, Industry Trend Analysis, and Forecast 2025 - 2034 |
||||||
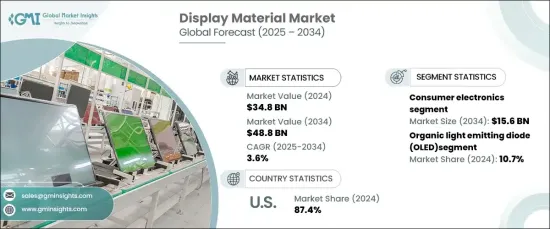
2024 年全球显示材料市场价值为 348 亿美元,预计 2025 年至 2034 年期间将以 3.6% 的强劲复合年增长率增长。
显示材料的技术创新正在彻底改变这个行业,使製造商能够创造出高品质的视觉体验,同时满足节能要求。柔性和可折迭显示器的日益普及也推动了市场需求,尤其是在高端设备领域。显示技术的不断发展进一步加速了这一趋势,使消费者更容易获得具有先进视觉功能的产品,同时促进节能。
| 市场范围 | |
|---|---|
| 起始年份 | 2024 |
| 预测年份 | 2025-2034 |
| 起始值 | 348亿美元 |
| 预测值 | 488亿美元 |
| 复合年增长率 | 3.6% |
显示器材料市场主要按技术细分,包括微型 LED 显示器、有机发光二极体 (OLED)、液晶显示器 (LCD)、量子点显示器和电子纸显示器 (EPD)。 OLED技术在2024年占据主导地位,占据10.7%的显着份额。该技术因其自发光像素而闻名,它可以提供更深的黑色、鲜艳的色彩和更快的响应时间。 OLED 的纤薄、灵活设计使其成为智慧型手机、电视以及新兴扩增实境 (AR) 和虚拟实境 (VR) 应用中高阶显示器的理想选择,巩固了其作为尖端设备首选技术的地位。
从应用方面来看,显示材料市场涵盖消费性电子、汽车、医疗保健、零售、工业和企业部门等多个行业。预计到 2034 年,消费性电子产品市场规模将达到 156 亿美元,继续成为市场最大的收入来源。这种扩展归因于消费者对笔记型电脑、游戏显示器和智慧穿戴装置等产品中高解析度、节能显示器的偏好日益增加。显示器如今已成为必不可少的组成部分,增强了现代消费性电子产品的功能性和美感。
受技术快速进步、消费者支出高企以及创新设备的迅速采用推动,美国显示材料市场在 2024 年占据 87.4% 的主导份额。 AR、VR、汽车显示器和医疗保健成像系统中显示技术的日益整合进一步刺激了该地区的市场需求。此外,领先製造商在研发方面的大量投资有助于巩固美国在显示材料创新领域的全球领先地位。
目录
第 1 章:方法论与范围
- 市场范围和定义
- 基础估算与计算
- 预测计算
- 资料来源
- 基本的
- 次要
- 付费来源
- 公共资源
第 2 章:执行摘要
第 3 章:产业洞察
- 产业生态系统分析
- 影响价值链的因素
- 利润率分析
- 中断
- 未来展望
- 製造商
- 经销商
- 供应商概况
- 利润率分析
- 重要新闻及倡议
- 监管格局
- 衝击力
- 成长动力
- 先进消费性电子产品需求激增
- 汽车显示器产业的成长
- 显示技术的快速进步
- 高解析度显示器的普及率不断提高
- 产业陷阱与挑战
- 生产成本高,资本投资要求高
- 供应链中断和资源依赖
- 成长动力
- 成长潜力分析
- 波特的分析
- PESTEL 分析
第四章:竞争格局
- 介绍
- 公司市占率分析
- 竞争定位矩阵
- 战略展望矩阵
第 5 章:市场估计与预测:按材料,2021 年至 2034 年
- 主要趋势
- 偏光镜
- 玻璃基板
- 彩色滤光片
- 液晶(LC)
- 背光单元 (BLU)
- 黏合剂
- 氧化铟锡(ITO)
- 其他的
第 6 章:市场估计与预测:按应用,2021 年至 2034 年
- 主要趋势
- 消费性电子产品
- 汽车
- 卫生保健
- 零售
- 工业及企业
- 其他的
第 7 章:市场估计与预测:按技术,2021 年至 2034 年
- 主要趋势
- 液晶显示器(LCD)
- 有机发光二极体 (OLED)
- 量子点显示器
- 微型 LED 显示器
- 电子纸显示器(EPD)
第 8 章:市场估计与预测:按地区,2021 年至 2034 年
- 主要趋势
- 北美洲
- 我们
- 加拿大
- 欧洲
- 英国
- 德国
- 法国
- 义大利
- 西班牙
- 俄罗斯
- 亚太地区
- 中国
- 印度
- 日本
- 韩国
- 澳洲
- 拉丁美洲
- 巴西
- 墨西哥
- 中东及非洲
- 南非
- 沙乌地阿拉伯
- 阿联酋
第九章:公司简介
- 3M Company
- AGC Inc. (Asahi Glass Co., Ltd.)
- AU Optronics Corporation
- BOE Technology Group Co., Ltd.
- Corning Incorporated
- DIC Corporation
- DowDuPont Inc.
- Hitachi Chemical Co., Ltd.
- Idemitsu Kosan Co., Ltd.
- Innolux Corporation
- Japan Display Inc.
- JNC Corporation
- Kyulux, Inc.
- LG Chem, Ltd.
- Lumileds Holding BV
- Merck KGaA
- Nanoco Technologies Limited
- Nitto Denko Corporation
- Samsung Display Co., Ltd.
- Sumitomo Chemical Co., Ltd.
- Toray Industries, Inc.
- Universal Display Corporation
The Global Display Material Market was valued at USD 34.8 billion in 2024 and is expected to expand at a robust CAGR of 3.6% from 2025 to 2034. This growth is fueled by the rising demand for advanced consumer electronics, such as smartphones, tablets, and wearables, as consumers increasingly seek devices with enhanced visual quality, vibrant colors, and superior energy efficiency.
Technological innovations in display materials are revolutionizing the industry, enabling manufacturers to create high-quality visual experiences that also meet energy-saving demands. The growing popularity of flexible and foldable displays is also driving market demand, especially in premium devices. This trend is further accelerated by the continuous evolution of display technologies, making it easier for consumers to access products with advanced visual capabilities while promoting energy conservation.
| Market Scope | |
|---|---|
| Start Year | 2024 |
| Forecast Year | 2025-2034 |
| Start Value | $34.8 Billion |
| Forecast Value | $48.8 Billion |
| CAGR | 3.6% |
The display material market is primarily segmented by technology, including micro-LED display, organic light-emitting diode (OLED), liquid crystal display (LCD), quantum dot display, and e-paper display (EPD). OLED technology dominated in 2024, accounting for a significant share of 10.7%. This technology is recognized for its self-emissive pixels, which deliver deeper blacks, vibrant colors, and faster response times. OLED's thin, flexible design makes it an ideal choice for high-end displays in smartphones, televisions, and emerging augmented reality (AR) and virtual reality (VR) applications, solidifying its position as the go-to technology for cutting-edge devices.
In terms of application, the display material market spans several industries, including consumer electronics, automotive, healthcare, retail, industrial and enterprise sectors, among others. The consumer electronics segment is projected to reach USD 15.6 billion by 2034, continuing to be the largest source of revenue in the market. This expansion is attributed to the increasing consumer preference for high-resolution, energy-efficient displays in products such as laptops, gaming monitors, and smart wearables. Displays are now an essential component, enhancing both the functionality and aesthetic appeal of modern consumer electronics.
The U.S. display material market held a dominant share of 87.4% in 2024, driven by rapid technological advancements, high consumer spending, and the swift adoption of innovative devices. The growing integration of display technologies in AR, VR, automotive displays, and healthcare imaging systems further fuels market demand in the region. Furthermore, substantial investments in research and development by leading manufacturers help reinforce the U.S.'s position as a global leader in display material innovation.
Table of Contents
Chapter 1 Methodology & Scope
- 1.1 Market scope & definitions
- 1.2 Base estimates & calculations
- 1.3 Forecast calculations
- 1.4 Data sources
- 1.4.1 Primary
- 1.4.2 Secondary
- 1.4.2.1 Paid sources
- 1.4.2.2 Public sources
Chapter 2 Executive Summary
- 2.1 Industry synopsis, 2021-2034
Chapter 3 Industry Insights
- 3.1 Industry ecosystem analysis
- 3.1.1 Factor affecting the value chain
- 3.1.2 Profit margin analysis
- 3.1.3 Disruptions
- 3.1.4 Future outlook
- 3.1.5 Manufacturers
- 3.1.6 Distributors
- 3.2 Supplier landscape
- 3.3 Profit margin analysis
- 3.4 Key news & initiatives
- 3.5 Regulatory landscape
- 3.6 Impact forces
- 3.6.1 Growth drivers
- 3.6.1.1 Surging demand for advanced consumer electronics
- 3.6.1.2 Growth of the automotive display sector
- 3.6.1.3 Rapid advancements in display technologies
- 3.6.1.4 Increasing penetration of high-resolution displays
- 3.6.2 Industry pitfalls & challenges
- 3.6.2.1 High production costs and capital investment requirements
- 3.6.2.2 Supply chain disruptions and resource dependence
- 3.6.1 Growth drivers
- 3.7 Growth potential analysis
- 3.8 Porter’s analysis
- 3.9 PESTEL analysis
Chapter 4 Competitive Landscape, 2024
- 4.1 Introduction
- 4.2 Company market share analysis
- 4.3 Competitive positioning matrix
- 4.4 Strategic outlook matrix
Chapter 5 Market Estimates & Forecast, By Material, 2021-2034 (USD Billion)
- 5.1 Key trends
- 5.2 Polarizers
- 5.3 Glass substrates
- 5.4 Color filters
- 5.5 Liquid crystals (LC)
- 5.6 Backlighting units (BLU)
- 5.7 Adhesives
- 5.8 Indium tin oxide (ITO)
- 5.9 Others
Chapter 6 Market Estimates & Forecast, By Application, 2021-2034 (USD Billion)
- 6.1 Key trends
- 6.2 Consumer electronics
- 6.3 Automotive
- 6.4 Healthcare
- 6.5 Retail
- 6.6 Industrial and enterprise
- 6.7 Others
Chapter 7 Market Estimates & Forecast, By Technology, 2021-2034 (USD Billion)
- 7.1 Key trends
- 7.2 Liquid crystal display (LCD)
- 7.3 Organic light emitting diode (OLED)
- 7.4 Quantum dot display
- 7.5 Micro LED display
- 7.6 E-paper display (EPD)
Chapter 8 Market Estimates & Forecast, By Region, 2021-2034 (USD Billion)
- 8.1 Key trends
- 8.2 North America
- 8.2.1 U.S.
- 8.2.2 Canada
- 8.3 Europe
- 8.3.1 UK
- 8.3.2 Germany
- 8.3.3 France
- 8.3.4 Italy
- 8.3.5 Spain
- 8.3.6 Russia
- 8.4 Asia Pacific
- 8.4.1 China
- 8.4.2 India
- 8.4.3 Japan
- 8.4.4 South Korea
- 8.4.5 Australia
- 8.5 Latin America
- 8.5.1 Brazil
- 8.5.2 Mexico
- 8.6 MEA
- 8.6.1 South Africa
- 8.6.2 Saudi Arabia
- 8.6.3 UAE
Chapter 9 Company Profiles
- 9.1 3M Company
- 9.2 AGC Inc. (Asahi Glass Co., Ltd.)
- 9.3 AU Optronics Corporation
- 9.4 BOE Technology Group Co., Ltd.
- 9.5 Corning Incorporated
- 9.6 DIC Corporation
- 9.7 DowDuPont Inc.
- 9.8 Hitachi Chemical Co., Ltd.
- 9.9 Idemitsu Kosan Co., Ltd.
- 9.10 Innolux Corporation
- 9.11 Japan Display Inc.
- 9.12 JNC Corporation
- 9.13 Kyulux, Inc.
- 9.14 LG Chem, Ltd.
- 9.15 Lumileds Holding B.V.
- 9.16 Merck KGaA
- 9.17 Nanoco Technologies Limited
- 9.18 Nitto Denko Corporation
- 9.19 Samsung Display Co., Ltd.
- 9.20 Sumitomo Chemical Co., Ltd.
- 9.21 Toray Industries, Inc.
- 9.22 Universal Display Corporation
 2026年全球超快雷射图形化显示器市场报告
 彩色滤光玻璃市场按类型、厚度、技术和应用划分-2026年至2032年全球预测液晶间隔微球市场依产品类型、间隔尺寸、表面处理、应用、终端用户产业及通路划分,全球预测(2026-2032年)
 铟镓锌氧化物(IGZO):市场占有率分析、产业趋势与统计、成长预测(2026-2031)
 采用量子点薄膜的新型显示器:全球市场份额和排名、总收入和需求预测(2025-2031年)
 钙钛矿量子点显示应用市场机会、成长驱动因素、产业趋势分析及预测(2025-2034年)铟镓锌氧化物(IGZO):全球市场份额和排名、总收入和需求预测(2025-2031年)IGZO市场按应用、装置类型、终端用户产业、沉淀方法、基材、厚度和迁移率范围划分-全球预测,2025-2032年
 全球显示材料市场研究报告 - 产业分析、规模、份额、成长、趋势及预测(2025 年至 2033 年)
 透明电极的全球市场