


 |
市场调查报告书
商品编码
1871150
钙钛矿量子点显示应用市场机会、成长驱动因素、产业趋势分析及预测(2025-2034年)Perovskite Quantum Dots for Display Applications Market Opportunity, Growth Drivers, Industry Trend Analysis, and Forecast 2025 - 2034 |
||||||
2024 年全球钙钛矿量子点显示应用市场价值为 2.471 亿美元,预计到 2034 年将以 25% 的复合年增长率增长至 23 亿美元。
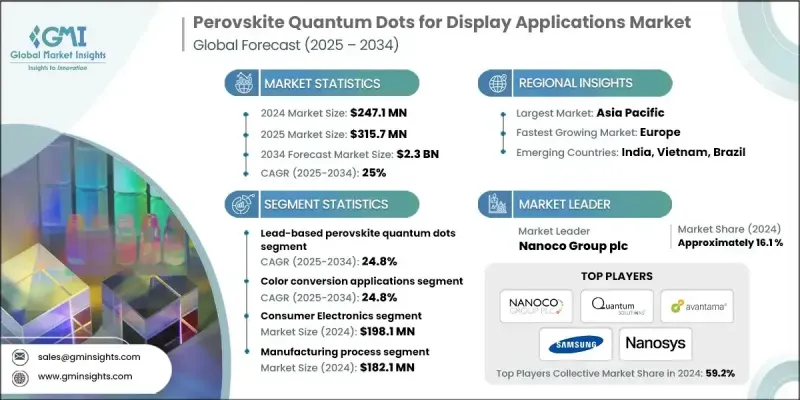
专业和消费性电子产品对广色域和节能显示器的需求不断增长,推动了钙钛矿量子点(PQD)技术的快速发展。 PQD 具有高亮度、卓越的色彩精准度和低功耗等优点,是液晶显示器(LCD)色彩转换膜和新一代电致发光装置的理想选择。随着製造商开发环保替代品以符合严格的法规(尤其是在欧洲),向无铅 PQD 的过渡正在重塑整个产业。这些先进材料的光致发光量子产率(PLQY)接近 99%,在提高显示器亮度和效率的同时,确保符合全球安全标准。向永续材料的转变正在为高端消费性电子产品、穿戴式装置和医用显示器带来新的机会。随着 PQD 技术的不断发展,其鲜艳的色彩表现、卓越的能源效率和环保的特性使其成为全球下一代显示器创新发展的关键推动力。
| 市场范围 | |
|---|---|
| 起始年份 | 2024 |
| 预测年份 | 2025-2034 |
| 起始值 | 2.471亿美元 |
| 预测值 | 23亿美元 |
| 复合年增长率 | 25% |
2024年,铅基钙钛矿量子点市场规模达到1.92亿美元,预计2034年将维持24.8%的复合年增长率。铅基和无铅钙钛矿量子点均呈现成长势头,其中铅基量子点凭藉其卓越的色彩纯度和发光效率,在目前的商业化过程中占据主导地位。然而,日益增长的环境合规性需求以及符合RoHS标准的替代材料的推出,正在加速锡基和铋基材料的应用。在实现最佳性能和满足监管标准之间取得平衡,并持续推动材料创新,全球供应商正调整研发路线图,以满足显示器製造商的技术需求。
2024年,色彩转换应用领域的市场规模为1.673亿美元,预计2025年至2034年间将以24.8%的复合年增长率成长。采用钙钛矿量子点的色彩转换膜因其卓越的光学效率和在显示器整合方面的灵活性而广泛应用。随着製造商在追求永续发展的同时又不牺牲视觉质量,无铅材料与含铅材料一样日益受到重视。符合环保标准的高性能钙钛矿量子点的持续研发,反映了原始设备製造商对可靠、可扩展的先进显示系统解决方案日益增长的需求。
2024年,中国钙钛矿量子点显示应用市场规模达7,440万美元,预计2034年将以25.2%的复合年增长率成长。中国仍然是全球钙钛矿量子点创新和大规模显示器製造的中心,这得益于强劲的国内需求和对先进显示技术的巨额投资。中国在显示面板生产领域的领先地位正在推动钙钛矿量子点加速整合到商用显示器中,巩固其在这一新兴市场的主导地位。
钙钛矿量子点显示应用市场的主要参与者包括Nanoco Group plc、Quantum Solutions、Avantama AG、三星电子和Nanosys Inc.。为了巩固市场地位,这些领导企业正优先考虑永续创新和策略合作。他们大力投资研发,以开发无铅、高效、稳定性更高且相容性更强的钙钛矿量子点,以实现大规模生产。与显示器製造商和材料供应商的合作有助于加速商业化进程并确保符合监管要求。此外,各公司也正在扩大产能,以满足全球对环保显示技术日益增长的需求。
目录
第一章:方法论
- 市场范围和定义
- 研究设计
- 研究方法
- 资料收集方法
- 资料探勘来源
- 全球的
- 地区/国家
- 基准估算和计算
- 基准年计算
- 市场估算的关键趋势
- 初步研究和验证
- 原始资料
- 预测模型
- 研究假设和局限性
第二章:执行概要
第三章:行业洞察
- 产业生态系分析
- 供应商格局
- 利润率
- 每个阶段的价值增加
- 影响价值链的因素
- 中断
- 产业影响因素
- 成长驱动因素
- 产业陷阱与挑战
- 市场机会
- 成长潜力分析
- 监管环境
- 北美洲
- 欧洲
- 亚太地区
- 拉丁美洲
- 中东和非洲
- 波特的分析
- PESTEL 分析
- 价格趋势
- 按地区
- 未来市场趋势
- 专利格局
- 贸易统计(HS编码)(註:仅提供重点国家的贸易统计资料)
- 主要进口国
- 主要出口国
- 永续性和环境方面
- 永续实践
- 减少废弃物策略
- 生产中的能源效率
- 环保倡议
- 碳足迹考量
第四章:竞争格局
- 介绍
- 公司市占率分析
- 按地区
- 北美洲
- 欧洲
- 亚太地区
- 拉丁美洲
- MEA
- 按地区
- 公司矩阵分析
- 主要市场参与者的竞争分析
- 竞争定位矩阵
- 关键进展
- 併购
- 合作伙伴关係与合作
- 新产品发布
- 扩张计划
第五章:市场估计与预测:依技术组成划分,2025-2034年
- 主要趋势
- 铅基钙钛矿量子点
- 全无机铯铅卤化物(CsPbX3)
- 有机-无机杂化钙钛矿
- 无铅钙钛矿量子点
- 铋基钙钛矿
- 其他无铅替代品
第六章:市场估算与预测:依显示技术整合度划分,2025-2034年
- 主要趋势
- 颜色转换应用
- LCD背光增强
- 微型LED颜色转换
- OLED色彩增强
- 电致发光应用
第七章:市场估算与预测:依最终用途应用划分,2025-2034年
- 主要趋势
- 消费性电子产品
- 电视显示器
- 智慧型手机和行动显示器
- 显示器和IT显示器
- 新兴高价值应用
- 扩增实境/虚拟实境(AR/VR)
- 汽车显示器
- 柔性穿戴显示器
第八章:市场估算与预测:依製造流程划分,2025-2034年
- 合成方法
- 热注入胶体合成
- 室温反溶剂法
- 连续流和放大方法
- 模式化和整合技术
- 喷墨列印
- 光刻
- 卷对卷加工
第九章:市场估计与预测:依地区划分,2025-2034年
- 主要趋势
- 北美洲
- 我们
- 加拿大
- 欧洲
- 德国
- 英国
- 法国
- 义大利
- 西班牙
- 欧洲其他地区
- 亚太地区
- 中国
- 印度
- 日本
- 澳洲
- 韩国
- 亚太其他地区
- 拉丁美洲
- 巴西
- 墨西哥
- 阿根廷
- 拉丁美洲其他地区
- 中东和非洲
- 沙乌地阿拉伯
- 南非
- 阿联酋
- 中东和非洲其他地区
第十章:公司简介
- Nanoco Group plc
- Quantum Solutions
- Avantama AG
- Samsung Electronics (SAIT)
- Nanosys Inc.
- QNOVA (formerly Quantum Solutions USA)
- BASF SE
- LG Display
- QustomDot (Spin-off from Ghent University)
- Ossila Ltd.
- Merck KGaA (EMD Performance Materials)
- UbiQD Inc.
The Global Perovskite Quantum Dots for Display Applications Market was valued at USD 247.1 million in 2024 and is estimated to grow at a CAGR of 25% to reach USD 2.3 Billion by 2034.
The rapid expansion is driven by the increasing demand for wide color gamut and energy-efficient displays across professional and consumer electronics. Perovskite quantum dots (PQDs) deliver high brightness, excellent color accuracy, and reduced power consumption, making them ideal for LCD color-conversion films and next-generation electroluminescent devices. The ongoing transition toward lead-free PQDs is reshaping the industry as manufacturers develop environmentally friendly alternatives to comply with stringent regulations, particularly in Europe. These advanced materials achieve photoluminescence quantum yields (PLQY) close to 99%, enhancing display brightness and efficiency while ensuring compliance with global safety standards. The shift toward sustainable materials is unlocking new opportunities in high-end consumer electronics, wearable devices, and medical-grade displays. As PQD technology continues to evolve, the combination of vivid color performance, energy efficiency, and eco-friendly composition positions it as a key enabler of next-generation display innovation worldwide.
| Market Scope | |
|---|---|
| Start Year | 2024 |
| Forecast Year | 2025-2034 |
| Start Value | $247.1 Million |
| Forecast Value | $2.3 Billion |
| CAGR | 25% |
The lead-based perovskite quantum dots segment reached USD 192 million in 2024 and is estimated to record a CAGR of 24.8% through 2034. Both lead-based and lead-free PQDs are gaining traction, with the former dominating current commercialization due to their superior color purity and luminous efficiency. However, the growing focus on environmental compliance and the introduction of RoHS-compatible alternatives are accelerating the adoption of tin- and bismuth-based materials. The balance between achieving optimal performance and meeting regulatory standards continues to drive material innovation, as global suppliers align R&D roadmaps to match the technological needs of display manufacturers.
The color conversion application segment was valued at USD 167.3 million in 2024 and is projected to grow at a CAGR of 24.8% between 2025 and 2034. Color conversion films using perovskite quantum dots are witnessing widespread adoption due to their superior optical efficiency and flexibility in display integration. Lead-free materials are gaining relevance alongside their lead-based counterparts as manufacturers pursue sustainability without compromising visual quality. The constant development of eco-compliant, high-performance PQDs reflects the growing expectations of original equipment manufacturers seeking reliable, scalable solutions for advanced display systems.
China Perovskite Quantum Dots for Display Applications Market generated USD 74.4 million in 2024 and is expected to grow at a CAGR of 25.2% through 2034. The country remains the global hub for PQD innovation and large-scale display manufacturing, benefiting from strong domestic demand and substantial investment in advanced display technologies. China's leadership in display panel production is fueling accelerated PQD integration into commercial displays, solidifying its dominance in this emerging market.
Key players active in the Perovskite Quantum Dots for Display Applications Market include Nanoco Group plc, Quantum Solutions, Avantama AG, Samsung Electronics, and Nanosys Inc. To strengthen their foothold, leading companies in the perovskite quantum dots for display applications market are prioritizing sustainable innovation and strategic collaboration. They are investing heavily in R&D to develop lead-free, high-efficiency PQDs with improved stability and compatibility for mass production. Partnerships with display manufacturers and material suppliers are helping accelerate commercialization and ensure regulatory compliance. Companies are also expanding production capacities to meet the rising global demand for eco-friendly display technologies.
Table of Contents
Chapter 1 Methodology
- 1.1 Market scope and definition
- 1.2 Research design
- 1.2.1 Research approach
- 1.2.2 Data collection methods
- 1.3 Data mining sources
- 1.3.1 Global
- 1.3.2 Regional/Country
- 1.4 Base estimates and calculations
- 1.4.1 Base year calculation
- 1.4.2 Key trends for market estimation
- 1.5 Primary research and validation
- 1.5.1 Primary sources
- 1.6 Forecast model
- 1.7 Research assumptions and limitations
Chapter 2 Executive Summary
- 2.1 Industry 360° synopsis
- 2.2 Key market trends
- 2.2.1 Regional
- 2.2.2 Technology Composition
- 2.2.3 Display Technology Integration
- 2.2.4 End Use Application
- 2.3 TAM Analysis, 2025-2034
- 2.4 CXO perspectives: Strategic imperatives
- 2.4.1 Executive decision points
- 2.4.2 Critical success factors
- 2.5 Future Outlook and Strategic Recommendations
Chapter 3 Industry Insights
- 3.1 Industry ecosystem analysis
- 3.1.1 Supplier Landscape
- 3.1.2 Profit Margin
- 3.1.3 Value addition at each stage
- 3.1.4 Factor affecting the value chain
- 3.1.5 Disruptions
- 3.2 Industry impact forces
- 3.2.1 Growth drivers
- 3.2.2 Industry pitfalls and challenges
- 3.2.3 Market opportunities
- 3.3 Growth potential analysis
- 3.4 Regulatory landscape
- 3.4.1 North America
- 3.4.2 Europe
- 3.4.3 Asia Pacific
- 3.4.4 Latin America
- 3.4.5 Middle East & Africa
- 3.5 Porter's analysis
- 3.6 PESTEL analysis
- 3.6.1 Technology and Innovation landscape
- 3.6.2 Current technological trends
- 3.6.3 Emerging technologies
- 3.7 Price trends
- 3.7.1 By region
- 3.8 Future market trends
- 3.9 Patent Landscape
- 3.10 Trade statistics (HS code) (Note: the trade statistics will be provided for key countries only)
- 3.10.1 Major importing countries
- 3.10.2 Major exporting countries
- 3.11 Sustainability and Environmental Aspects
- 3.11.1 Sustainable Practices
- 3.11.2 Waste Reduction Strategies
- 3.11.3 Energy Efficiency in Production
- 3.11.4 Eco-friendly Initiatives
- 3.12 Carbon Footprint Considerations
Chapter 4 Competitive Landscape, 2024
- 4.1 Introduction
- 4.2 Company market share analysis
- 4.2.1 By region
- 4.2.1.1 North America
- 4.2.1.2 Europe
- 4.2.1.3 Asia Pacific
- 4.2.1.4 LATAM
- 4.2.1.5 MEA
- 4.2.1 By region
- 4.3 Company matrix analysis
- 4.4 Competitive analysis of major market players
- 4.5 Competitive positioning matrix
- 4.6 Key developments
- 4.6.1 Mergers & acquisitions
- 4.6.2 Partnerships & collaborations
- 4.6.3 New Product Launches
- 4.6.4 Expansion Plans
Chapter 5 Market Estimates and Forecast, By Technology Composition, 2025 - 2034 (USD Million)
- 5.1 Key trends
- 5.2 Lead-Based Perovskite Quantum Dots
- 5.2.1 All-Inorganic Cesium Lead Halide (CsPbX3)
- 5.2.2 Hybrid Organic-Inorganic Perovskites
- 5.3 Lead-Free Perovskite Quantum Dots
- 5.3.1 Bismuth-Based Perovskites
- 5.3.2 Other Lead-Free Alternatives
Chapter 6 Market Estimates and Forecast, By Display Technology Integration, 2025 - 2034 (USD Million)
- 6.1 Key trends
- 6.2 Color Conversion Applications
- 6.2.1 LCD Backlight Enhancement
- 6.2.2 Micro-LED Color Conversion
- 6.2.3 OLED Color Enhancement
- 6.3 Electroluminescent Applications
Chapter 7 Market Estimates and Forecast, By End Use Application, 2025 - 2034 (USD Million)
- 7.1 Key trends
- 7.2 Consumer Electronics
- 7.2.1 Television Displays
- 7.2.2 Smartphone and Mobile Displays
- 7.2.3 Monitor and IT Displays
- 7.3 Emerging High-Value Applications
- 7.3.1 Augmented Reality/Virtual Reality (AR/VR)
- 7.3.2 Automotive Displays
- 7.3.3 Flexible and Wearable Displays
Chapter 8 Market Estimates and Forecast, By Manufacturing Process, 2025 - 2034 (USD Million)
- 8.1 Synthesis Methods
- 8.1.1 Hot-Injection Colloidal Synthesis
- 8.1.2 Room-Temperature Anti-Solvent Methods
- 8.1.3 Continuous Flow and Scale-Up Methods
- 8.2 Patterning and Integration Technologies
- 8.2.1 Inkjet Printing
- 8.2.2 Photolithography
- 8.2.3 Roll-to-Roll Processing
Chapter 9 Market Estimates and Forecast, By Region, 2025 - 2034 (USD Million)
- 9.1 Key trends
- 9.2 North America
- 9.2.1 U.S.
- 9.2.2 Canada
- 9.3 Europe
- 9.3.1 Germany
- 9.3.2 UK
- 9.3.3 France
- 9.3.4 Italy
- 9.3.5 Spain
- 9.3.6 Rest of Europe
- 9.4 Asia Pacific
- 9.4.1 China
- 9.4.2 India
- 9.4.3 Japan
- 9.4.4 Australia
- 9.4.5 South Korea
- 9.4.6 Rest of Asia Pacific
- 9.5 Latin America
- 9.5.1 Brazil
- 9.5.2 Mexico
- 9.5.3 Argentina
- 9.5.4 Rest of Latin America
- 9.6 Middle East & Africa
- 9.6.1 Saudi Arabia
- 9.6.2 South Africa
- 9.6.3 UAE
- 9.6.4 Rest of Middle East & Africa
Chapter 10 Company Profiles
- 10.1 Nanoco Group plc
- 10.2 Quantum Solutions
- 10.3 Avantama AG
- 10.4 Samsung Electronics (SAIT)
- 10.5 Nanosys Inc.
- 10.6 QNOVA (formerly Quantum Solutions USA)
- 10.7 BASF SE
- 10.8 LG Display
- 10.9 QustomDot (Spin-off from Ghent University)
- 10.10 Ossila Ltd.
- 10.11 Merck KGaA (EMD Performance Materials)
- 10.12 UbiQD Inc.
 2026年全球超快雷射图形化显示器市场报告
 彩色滤光玻璃市场按类型、厚度、技术和应用划分-2026年至2032年全球预测液晶间隔微球市场依产品类型、间隔尺寸、表面处理、应用、终端用户产业及通路划分,全球预测(2026-2032年)
 铟镓锌氧化物(IGZO):市场占有率分析、产业趋势与统计、成长预测(2026-2031)
 采用量子点薄膜的新型显示器:全球市场份额和排名、总收入和需求预测(2025-2031年)铟镓锌氧化物(IGZO):全球市场份额和排名、总收入和需求预测(2025-2031年)IGZO市场按应用、装置类型、终端用户产业、沉淀方法、基材、厚度和迁移率范围划分-全球预测,2025-2032年
 全球显示材料市场研究报告 - 产业分析、规模、份额、成长、趋势及预测(2025 年至 2033 年)
 透明电极的全球市场
 显示材料市场机会、成长动力、产业趋势分析与 2025 - 2034 年预测