


 |
市场调查报告书
商品编码
1665235
石油和天然气市场中的数位孪生机会、成长动力、产业趋势分析和 2025 - 2034 年预测Digital Twin in Oil And Gas Market Opportunity, Growth Drivers, Industry Trend Analysis, and Forecast 2025 - 2034 |
||||||
2024 年全球石油和天然气市场的数字孪生价值为 12 亿美元,预计 2025 年至 2034 年期间将以 11.2% 的强劲复合年增长率增长。这一令人印象深刻的增长是由整个行业对数字化转型的不断推动、对运营效率的不断增长的需求以及对预测性维护的日益重视所推动的。随着石油和天然气公司寻求简化流程、提高生产力和最大限度地减少停机时间,数位孪生技术正成为实现这些目标不可或缺的一部分。
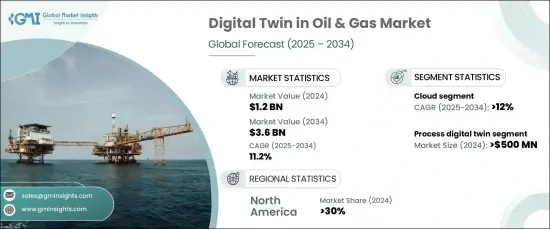
市场主要分为三种:产品、流程、系统数位孪生。其中,流程数位孪生领域预计将实现最显着的成长,到 2024 年其价值将达到 5 亿美元。这部分对于建模和模拟各种石油和天然气作业的复杂工作流程至关重要。透过提供对整个流程的洞察,流程数位孪生使组织能够优化生产、增强决策能力并提高整体绩效。这些数位孪生在精炼流程、勘探和钻探方面特别有效,有助于提高安全标准和操作准确性。
| 市场范围 | |
|---|---|
| 起始年份 | 2024 |
| 预测年份 | 2025-2034 |
| 起始值 | 12亿美元 |
| 预测值 | 36亿美元 |
| 复合年增长率 | 11.2% |
谈到部署模式,市场分为内部部署和基于云端的解决方案。预计云端运算领域将在 2025 年至 2034 年间以 12% 的强劲复合年增长率成长,这得益于其可扩展性、成本效益以及支援远端监控的能力。云端解决方案提供无缝即时资料集成,支援跨地理位置分散的团队进行协作操作。云端平台的灵活性使企业能够快速适应不断变化的营运条件并实施效能驱动的更新,使其成为石油和天然气行业的首选。
受数位技术的快速发展、自动化投资的增加以及对资料分析的日益关注的推动,北美在 2024 年占据全球市场的 30% 的主导份额。该地区对数位孪生解决方案的采用在资产管理和营运优化方面尤为强劲。特别是上游和中游产业的公司正在利用这些技术来加强安全协议、降低营运成本并满足严格的监管标准。该地区领先的技术提供者和行业先驱的存在进一步支持了市场的强劲成长。
目录
第 1 章:方法论与范围
- 研究设计
- 研究方法
- 资料收集方法
- 基础估算与计算
- 基准年计算
- 市场估计的主要趋势
- 预测模型
- 初步研究和验证
- 主要来源
- 资料探勘来源
- 市场范围和定义
第 2 章:执行摘要
第 3 章:产业洞察
- 产业生态系统分析
- 供应商概况
- 技术提供者
- 平台提供者
- 石油和天然气营运商
- 经销商
- 最终用户
- 利润率分析
- 技术与创新格局
- 专利分析
- 监管格局
- 使用案例
- 使用案例1
- 好处
- 投资报酬率
- 使用案例2
- 好处
- 投资报酬率
- 使用案例1
- 案例研究
- 案例研究 1
- 消费者姓名
- 挑战
- 解决方案
- 影响
- 案例研究 2
- 消费者姓名
- 挑战
- 解决方案
- 影响
- 案例研究 1
- 衝击力
- 成长动力
- 即时监控需求日益增加
- 预测性维护的采用率不断提高
- 越来越重视永续发展倡议
- 基于云端的数位孪生技术的进步
- 产业陷阱与挑战
- 实施成本高
- 资料安全问题
- 成长动力
- 成长潜力分析
- 波特的分析
- PESTEL 分析
第四章:竞争格局
- 介绍
- 公司市占率分析
- 竞争定位矩阵
- 战略展望矩阵
第五章:市场估计与预测:依供应量,2021 - 2034 年
- 主要趋势
- 产品数位孪生
- 流程数位孪生
- 系统数位孪生
第六章:市场估计与预测:依部署模式,2021 - 2034 年
- 主要趋势
- 云
- 本地
第 7 章:市场估计与预测:按运营,2021 - 2034 年
- 主要趋势
- 上游
- 中游
- 下游
第 8 章:市场估计与预测:按应用,2021 - 2034 年
- 主要趋势
- 勘探与生产
- 钻井作业
- 水库管理
- 管道管理
- 炼油业务
- 资产绩效管理
- 其他的
第 9 章:市场估计与预测:按最终用途,2021 - 2034 年
- 主要趋势
- 国家石油公司 (NOC)
- 独立石油公司 (IOC)
第 10 章:市场估计与预测:按地区,2021 - 2034 年
- 主要趋势
- 北美洲
- 我们
- 加拿大
- 欧洲
- 英国
- 德国
- 法国
- 义大利
- 西班牙
- 俄罗斯
- 北欧
- 亚太地区
- 中国
- 印度
- 日本
- 澳洲
- 韩国
- 东南亚
- 拉丁美洲
- 巴西
- 墨西哥
- 阿根廷
- 中东及非洲
- 阿联酋
- 南非
- 沙乌地阿拉伯
第 11 章:公司简介
- AVEVA
- Baker Hughes
- BP
- Chevron
- Emerson
- Eni Analytics
- Equinor
- General Electric
- Halliburton
- Honeywell
- IBM
- Petrobras
- Repsol
- Saudi Aramco
- Schlumberger
- Siemens Energy
- TechnipFMC
- TotalEnergies
- Wood
- Yokogawa
The Global Digital Twin In Oil And Gas Market was valued at USD 1.2 billion in 2024 and is projected to grow at a robust CAGR of 11.2% from 2025 to 2034. This impressive growth is driven by the increasing push for digital transformation across the industry, a heightened demand for operational efficiency, and a growing emphasis on predictive maintenance. As oil and gas companies seek to streamline their processes, enhance productivity, and minimize downtime, digital twin technologies are becoming integral to achieving these goals.
The market is primarily segmented by offering into three types: product, process, and system digital twins. Among these, the process digital twin segment, valued at USD 500 million in 2024, is expected to experience the most significant growth. This segment is crucial for modeling and simulating complex workflows across various oil and gas operations. By providing insights into the entire process, process digital twins enable organizations to optimize production, enhance decision-making, and boost overall performance. These digital twins are particularly effective in refining processes, exploration, and drilling, helping improve safety standards and operational accuracy.
| Market Scope | |
|---|---|
| Start Year | 2024 |
| Forecast Year | 2025-2034 |
| Start Value | $1.2 Billion |
| Forecast Value | $3.6 Billion |
| CAGR | 11.2% |
When it comes to deployment modes, the market is divided into on-premises and cloud-based solutions. The cloud segment is projected to grow at a strong CAGR of 12% from 2025 to 2034, driven by its scalability, cost-effectiveness, and ability to support remote monitoring. Cloud solutions offer seamless real-time data integration, enabling collaborative operations across geographically dispersed teams. The flexibility of cloud platforms allows businesses to quickly adapt to changing operational conditions and implement performance-driven updates, making them a preferred choice for the oil and gas industry.
North America held a dominant 30% share of the global market in 2024, fueled by rapid advancements in digital technologies, increased investments in automation, and a growing focus on data analytics. The region's adoption of digital twin solutions is especially strong in asset management and operational optimization. In particular, companies in the upstream and midstream sectors are leveraging these technologies to enhance safety protocols, reduce operational costs, and meet stringent regulatory standards. The presence of leading technology providers and industry pioneers in the region further supports the market's robust growth.
Table of Contents
Chapter 1 Methodology & Scope
- 1.1 Research design
- 1.1.1 Research approach
- 1.1.2 Data collection methods
- 1.2 Base estimates & calculations
- 1.2.1 Base year calculation
- 1.2.2 Key trends for market estimation
- 1.3 Forecast model
- 1.4 Primary research and validation
- 1.4.1 Primary sources
- 1.4.2 Data mining sources
- 1.5 Market scope & definition
Chapter 2 Executive Summary
- 2.1 Industry 3600 synopsis, 2021 - 2034
Chapter 3 Industry Insights
- 3.1 Industry ecosystem analysis
- 3.2 Supplier landscape
- 3.2.1 Technology providers
- 3.2.2 Platform providers
- 3.2.3 Oil & gas operators
- 3.2.4 Distributors
- 3.2.5 End users
- 3.3 Profit margin analysis
- 3.4 Technology & innovation landscape
- 3.5 Patent analysis
- 3.6 Regulatory landscape
- 3.7 Used cases
- 3.7.1 Used case 1
- 3.7.1.1 Benefits
- 3.7.1.2 ROI
- 3.7.2 Used case 2
- 3.7.2.1 Benefits
- 3.7.2.2 ROI
- 3.7.1 Used case 1
- 3.8 Case study
- 3.8.1 Case study 1
- 3.8.1.1 Consumer name
- 3.8.1.2 Challenge
- 3.8.1.3 Solution
- 3.8.1.4 Impact
- 3.8.2 Case study 2
- 3.8.2.1 Consumer name
- 3.8.2.2 Challenge
- 3.8.2.3 Solution
- 3.8.2.4 Impact
- 3.8.1 Case study 1
- 3.9 Impact forces
- 3.9.1 Growth drivers
- 3.9.1.1 Increasing demand for real-time monitoring
- 3.9.1.2 Rising adoption of predictive maintenance
- 3.9.1.3 Growing emphasis on sustainability initiatives
- 3.9.1.4 Advancements in cloud-based digital twin technologies
- 3.9.2 Industry pitfalls & challenges
- 3.9.2.1 High implementation costs
- 3.9.2.2 Data security concerns
- 3.9.1 Growth drivers
- 3.10 Growth potential analysis
- 3.11 Porter’s analysis
- 3.12 PESTEL analysis
Chapter 4 Competitive Landscape, 2024
- 4.1 Introduction
- 4.2 Company market share analysis
- 4.3 Competitive positioning matrix
- 4.4 Strategic outlook matrix
Chapter 5 Market Estimates & Forecast, By Offering, 2021 - 2034 ($Bn)
- 5.1 Key trends
- 5.2 Product digital twin
- 5.3 Process digital twin
- 5.4 System digital twin
Chapter 6 Market Estimates & Forecast, By Deployment Mode, 2021 - 2034 ($Bn)
- 6.1 Key trends
- 6.2 Cloud
- 6.3 On-premises
Chapter 7 Market Estimates & Forecast, By Operation, 2021 - 2034 ($Bn)
- 7.1 Key trends
- 7.2 Upstream
- 7.3 Midstream
- 7.4 Downstream
Chapter 8 Market Estimates & Forecast, By Application, 2021 - 2034 ($Bn)
- 8.1 Key trends
- 8.2 Exploration & production
- 8.3 Drilling operations
- 8.4 Reservoir management
- 8.5 Pipeline management
- 8.6 Refining operations
- 8.7 Asset performance management
- 8.8 Others
Chapter 9 Market Estimates & Forecast, By End Use, 2021 - 2034 ($Bn)
- 9.1 Key trends
- 9.2 National Oil Companies (NOCs)
- 9.3 Independent Oil Companies (IOCs)
Chapter 10 Market Estimates & Forecast, By Region, 2021 - 2034 ($Bn)
- 10.1 Key trends
- 10.2 North America
- 10.2.1 U.S.
- 10.2.2 Canada
- 10.3 Europe
- 10.3.1 UK
- 10.3.2 Germany
- 10.3.3 France
- 10.3.4 Italy
- 10.3.5 Spain
- 10.3.6 Russia
- 10.3.7 Nordics
- 10.4 Asia Pacific
- 10.4.1 China
- 10.4.2 India
- 10.4.3 Japan
- 10.4.4 Australia
- 10.4.5 South Korea
- 10.4.6 Southeast Asia
- 10.5 Latin America
- 10.5.1 Brazil
- 10.5.2 Mexico
- 10.5.3 Argentina
- 10.6 MEA
- 10.6.1 UAE
- 10.6.2 South Africa
- 10.6.3 Saudi Arabia
Chapter 11 Company Profiles
- 11.1 AVEVA
- 11.2 Baker Hughes
- 11.3 BP
- 11.4 Chevron
- 11.5 Emerson
- 11.6 Eni Analytics
- 11.7 Equinor
- 11.8 General Electric
- 11.9 Halliburton
- 11.10 Honeywell
- 11.11 IBM
- 11.12 Petrobras
- 11.13 Repsol
- 11.14 Saudi Aramco
- 11.15 Schlumberger
- 11.16 Siemens Energy
- 11.17 TechnipFMC
- 11.18 TotalEnergies
- 11.19 Wood
- 11.20 Yokogawa
 2026年全球能源网管理物联网(IoT)市场报告
 物联网能源市场:2026-2032年全球市场预测(按服务类型、连接技术、部署模式、应用程式和最终用户划分)2026年全球能源物联网市场报告
 能源领域物联网 (IoT) 市场规模、份额和成长分析(按组件、解决方案、服务、网路技术、应用和地区划分)—产业预测 (2026-2033)
 全球油气数位孪生市场:依类型、应用、部署模式和公司规模划分 - 市场规模、行业趋势、机会分析和预测(2025-2033 年)
 全球物联网 (IoT) 能源市场规模研究与预测,按组件(解决方案和服务)、按应用(石油天然气和煤矿)、按部署、按连接性和区域预测 2025-2035
 能源领域的物联网:市场占有率分析、产业趋势、统计数据和成长预测(2025-2030 年)
 能源电网管理中的物联网-2025-2029 年全球市场
 石油和天然气领域的全球物联网市场
 石油和天然气市场中的物联网 (IoT) 机会、成长动力、产业趋势分析和 2025 - 2034 年预测