


 |
市场调查报告书
商品编码
1998747
智慧型运输收费系统市场机会、成长驱动因素、产业趋势分析及预测(2026-2035年)Advanced Transportation Pricing System Market Opportunity, Growth Drivers, Industry Trend Analysis, and Forecast 2026 - 2035 |
||||||
2025 年全球智慧型运输票价系统市场价值 80 亿美元,预计到 2035 年将以 11.2% 的复合年增长率增长至 228 亿美元。
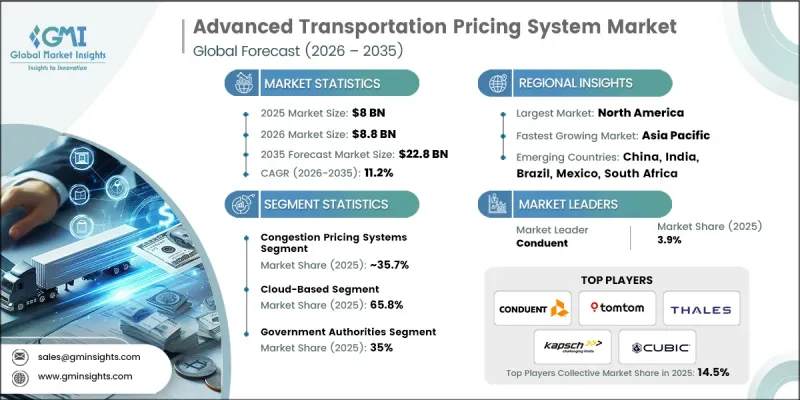
快速的都市化、不断增长的车辆保有量以及主要城市日益严重的交通拥堵,正在推动对先进收费解决方案的需求。政府和私人营运商正在实施电子收费、里程监控和动态定价模式,以有效管理道路使用、缓解拥塞并创造收入。对扩充性、技术主导的基础设施的需求,以及适用于高速公路和都市区道路网络的需求,也在推动市场成长。即时交通监控、数据分析和自动收费计算引擎使管理部门能够优化交通出行,同时支援智慧城市建设,这使得先进的收费系统成为现代城市规划中不可或缺的工具。全球向无障碍和自由流动收费的转变正在改变收费解决方案的实施方式。全自动多车道收费系统正在推动对软体、执法解决方案和定价引擎的需求。车辆侦测、数据处理和支付技术的进步正在提高这些系统的准确性和效率。无线射频识别 (RFID)、自动车牌识别和车辆分类技术的改进,在降低系统供应商营运成本的同时,实现了更精准的定价。
| 市场范围 | |
|---|---|
| 开始年份 | 2025 |
| 预测年份 | 2026-2035 |
| 起始金额 | 80亿美元 |
| 预测金额 | 228亿美元 |
| 复合年增长率 | 11.2% |
预计到2025年,拥堵收费方案将占总市场份额的35.7%,并在2035年之前以11.6%的复合年增长率增长。这些系统正在主要都市区道路和城市区域实施,旨在为交通管理、排放气体和改善公共交通提供资金筹措。政府部门受益于空气品质的改善、交通流量的优化和永续的产生收入,拥塞收费方案已成为ATPS解决方案的关键策略组成部分。
预计到 2025 年,基于云端的采用细分市场将占 65.8% 的市场份额,并从 2026 年到 2035 年以 11.4% 的复合年增长率增长。云端解决方案可降低营运成本,实现即时系统更新,并提供高度扩充性的基础设施,使交通管理部门能够比使用传统的本地系统更有效地管理收费和拥塞收费。
美国智慧型运输系统(EES)市场预计到2025年将达23亿美元。美国市场的扩张主要得益于联邦、州和地方政府的各项倡议,以及私人企业实施电子收费、拥堵收费和里程监控等技术的积极活动。电动车的兴起导致燃油税收入下降,从而增加了对替代性高速公路资金筹措方案的需求;同时,日益严重的都市区拥堵也推动了对创新型交通管理和专项交通计划资金的需求。
目录
第一章:调查方法
第二章执行摘要
第三章业界考察
- 产业生态系分析
- 供应商情况
- 利润率
- 成本结构
- 每个阶段增加的价值
- 影响价值链的因素
- 中断
- 影响产业的因素
- 成长驱动因素
- 扩大智慧城市与旅游解决方案的应用
- 扩大交通运输系统中的官民合作关係
- 政府为促进永续交通基础设施和政策所做的努力
- 随着都市区交通拥堵日益严重,高效率的交通管理解决方案需求日益增长。
- 产业潜在风险与挑战
- 高昂的初始设定和维护成本
- 消费者对动态定价模式的抗拒情绪
- 市场机会
- 与智慧城市基础建设的融合
- 对永续和环保交通方式的需求日益增长
- 物联网、人工智慧和巨量资料分析的进展
- 扩大官民合作关係(PPP)在交通运输计划的应用
- 成长驱动因素
- 成长潜力分析
- 监理情势
- 北美洲
- 联邦公路管理局 (FHWA) - 通行费和定价计划
- E-ZPass跨机构小组 - ETC互通性标准
- 加拿大:加拿大运输部-智慧型运输系统(ITS) 标准
- 欧洲
- 欧洲电子收费服务 (EETS) - 欧盟指令 2019/520
- 欧盟智慧交通系统指令(2010/40/EU)及相关授权条例
- 亚太地区
- 中国:交通运输部 - ETC 国家标准(GB/T 标准)
- 印度:印度国家公路管理局 (NHAI) - FASTag 标准
- 拉丁美洲
- 巴西:ANTT(国家陆路交通管理局)的收费规定
- 墨西哥:SCT - 基础设施、通讯和运输部
- 中东和非洲
- 阿联酋:道路运输管理局 (RTA) - 收费系统监管
- 沙乌地阿拉伯:SASO和运输部-道路通行费标准
- 非洲联盟:非洲基础建设发展计画(PIDA)
- 北美洲
- 波特五力分析
- PESTEL 分析
- 科技与创新趋势
- 当前技术趋势
- 新兴技术
- 经营模式和获利框架
- 收入模式
- 价值炼和生态系统
- 打入市场策略
- 品质标准、合规性和产品风险
- 零件安全和法规遵循性
- 与产品性能和耐用性相关的风险
- 商业营运和供应链中的风险
- ATPS平台架构
- 多层ATPS系统结构模型
- V2I(车路通讯)与互联出行的融合。
- 专利分析(基于初步研究)
- 价格分析(基于初步调查)
- 对过去价格趋势的分析
- 按业务类型分類的定价策略
- 生产统计
- 生产基地
- 消费中心
- 交易数据分析(基于付费资料库)
- 进出口量及进口额趋势
- 主要贸易走廊和关税的影响
- 永续性和环境方面
- 永续实践
- 生产和营运中的能源效率
- 关于碳足迹的考量
- GenAI 应用案例和实施蓝图:按细分市场划分
- 胎面花纹设计与生成
- 客户服务聊天机器人和技术支援
- 行销内容创作
- 风险、限制和监管考量
- GenAI 应用案例和实施蓝图:按细分市场划分
- 预测假设和情境分析(基于初步研究)
- 基本案例-驱动复合年增长率的关键宏观经济与产业变量
- 乐观情境-宏观经济与产业的顺风
- 悲观情景-宏观经济放缓或产业逆风
第四章 竞争情势
- 介绍
- 企业市占率分析
- 北美洲
- 欧洲
- 亚太地区
- 拉丁美洲
- 中东和非洲(MEA)
- 主要市场公司的竞争分析
- 竞争定位矩阵
- 战略展望矩阵
- 主要进展
- 併购
- 伙伴关係与合作
- 新产品发布
- 业务拓展计划及资金筹措
第五章 市场估计与预测:依解法划分,2022-2035年
- 交通拥堵收费系统
- 里程(VMT)监测
- 电子收费系统(ETC)
- 动态票价管理
- 停车定价与管理
- 其他解决方案
第六章 市场估计与预测:依组件划分,2022-2035年
- 硬体
- 应答器/车载单元
- 车牌辨识/自动车牌辨识摄影机
- RFID读取器
- 通讯设备
- 其他的
- 软体
- 后勤部门收费平台
- 支付结算软体
- 交通拥堵收费软体
- 其他的
- 服务
- 专业服务
- 託管服务
第七章 市场估计与预测:依发展阶段划分,2022-2035年
- 基于云端的
- 现场
第八章 市场估计与预测:依应用领域划分,2022-2035年
- 城市交通壅塞管理
- 与智慧城市的融合
- 货运和物流费用
- 停车管理
- 其他的
第九章 市场估计与预测:依最终用途划分,2022-2035年
- 政府机构
- 私人运输公司
- 物流/车辆管理公司
- 车主
第十章 市场估价与预测:依地区划分,2022-2035年
- 北美洲
- 我们
- 加拿大
- 欧洲
- 德国
- 英国
- 法国
- 义大利
- 西班牙
- 北欧国家
- 俄罗斯
- 挪威
- 丹麦
- 荷兰
- 比利时
- 亚太地区
- 中国
- 印度
- 日本
- 韩国
- ANZ
- 越南
- 印尼
- 新加坡
- 马来西亚
- 泰国
- 拉丁美洲
- 巴西
- 墨西哥
- 阿根廷
- 中东和非洲
- 南非
- 沙乌地阿拉伯
- 阿拉伯聯合大公国
第十一章:公司简介
- 世界公司
- Conduent
- Cubic
- Ericsson
- IBM
- Fluor
- Hewlett Packard
- International Road Dynamics
- Kapsch TrafficCom
- Siemens Mobility
- TomTom
- TransCore
- Worldline
- 当地公司
- ACS
- INIT
- Iteris
- Mobiliya
- Moovit
- Q-Free
- TollPlus
- Viaplus
The Global Advanced Transportation Pricing System Market was valued at USD 8 billion in 2025 and is estimated to grow at a CAGR of 11.2% to reach USD 22.8 billion by 2035.
Rapid urbanization, rising vehicle ownership, and escalating traffic congestion in major cities are driving the need for sophisticated pricing solutions. Governments and private operators are adopting electronic toll collection, vehicle miles traveled monitoring, and dynamic pricing models to better manage road usage, reduce congestion, and generate revenue. The market is also being propelled by the requirement for scalable, technology-driven infrastructure that can serve both highways and urban road networks. Real-time traffic monitoring, data analytics, and automated pricing engines are enabling authorities to optimize mobility while supporting smart city initiatives, making advanced transportation pricing systems a critical tool for modern urban planning. The global shift toward barrier-free and free-flow tolling is transforming how transportation pricing solutions are deployed. Fully automated, multi-lane tolling systems are driving demand for software, enforcement solutions, and pricing engines. Advances in vehicle detection, data processing, and payment technologies are enhancing the accuracy and efficiency of these systems. Improvements in RFID, automatic license plate recognition, and vehicle classification are enabling more precise pricing while lowering operational costs for system providers.
| Market Scope | |
|---|---|
| Start Year | 2025 |
| Forecast Year | 2026-2035 |
| Start Value | $8 Billion |
| Forecast Value | $22.8 Billion |
| CAGR | 11.2% |
The congestion pricing systems segment held a 35.7% share in 2025 and is expected to grow at a CAGR of 11.6% through 2035. These systems are increasingly implemented in urban corridors and citywide zones to manage traffic, reduce emissions, and fund public transport improvements. Authorities benefit from improved air quality, optimized traffic flow, and sustainable revenue generation, establishing congestion pricing as a key strategic segment of ATPS solutions.
The cloud-based deployment segment held 65.8% share in 2025 and is projected to grow at a CAGR of 11.4% from 2026 to 2035. Cloud solutions reduce operational costs, enable real-time system updates, and provide scalable infrastructure, allowing transport authorities to manage tolling and congestion pricing more efficiently than traditional on-premise systems.
U.S. Advanced Transportation Pricing System Market reached USD 2.3 billion in 2025. Expansion in the U.S. is fueled by federal, state, and municipal initiatives, along with private operators implementing electronic tolling, congestion pricing, and vehicle miles traveled monitoring. Declining fuel tax revenues due to electric vehicle adoption have created a need for alternative highway funding solutions, while rising urban congestion has increased demand for innovative traffic management and dedicated transportation project funding.
Key players operating in the Global Advanced Transportation Pricing System Market include Conduent, Thales, Kapsch TrafficCom, TomTom, Cubic, TransCore, IBM, Siemens Mobility, Q Free, and International Road Dynamics. Key strategies adopted by companies in the Global Advanced Transportation Pricing System Market include investing in R&D to develop integrated, AI-driven pricing engines and real-time monitoring platforms. Firms are focusing on cloud-based and scalable solutions that improve operational efficiency and reduce costs for transport authorities. Strategic partnerships with government agencies and private concessionaires help expand geographic reach and project adoption. Companies are also enhancing cybersecurity, compliance, and interoperability to meet regulatory standards and integrate with smart mobility ecosystems. Market leaders are emphasizing advanced data analytics, predictive traffic management, and IoT-enabled devices to strengthen customer loyalty and maintain competitive advantage in both developed and emerging markets.
Table of Contents
Chapter 1 Methodology
- 1.1 Research approach
- 1.2 Quality commitments
- 1.2.1 GMI AI policy & data integrity commitment
- 1.3 Research trail & confidence scoring
- 1.3.1 Research trail components
- 1.3.2 Scoring components
- 1.4 Data collection
- 1.4.1 Partial list of primary sources
- 1.5 Data mining sources
- 1.5.1 Paid sources
- 1.6 Base estimates and calculations
- 1.6.1 Base year calculation
- 1.7 Forecast model
- 1.8 Research transparency addendum
Chapter 2 Executive Summary
- 2.1 Industry 360° synopsis
- 2.2 Key market trends
- 2.2.1 Regional
- 2.2.2 Solution
- 2.2.3 Component
- 2.2.4 Deployment
- 2.2.5 Application
- 2.2.6 End Use
- 2.3 TAM analysis, 2026-2035
- 2.4 CXO perspectives: Strategic imperatives
- 2.4.1 Executive decision points
- 2.4.2 Critical success factors
- 2.5 Future outlook
- 2.6 Strategic recommendations
Chapter 3 Industry Insights
- 3.1 Industry ecosystem analysis
- 3.1.1 Supplier landscape
- 3.1.2 Profit margin
- 3.1.3 Cost structure
- 3.1.4 Value addition at each stage
- 3.1.5 Factor affecting the value chain
- 3.1.6 Disruptions
- 3.2 Industry impact forces
- 3.2.1 Growth drivers
- 3.2.1.1 Increasing adoption of smart city and mobility solutions
- 3.2.1.2 Expansion of public-private partnerships in transportation systems
- 3.2.1.3 Government initiatives promoting sustainable transport infrastructure and policies
- 3.2.1.4 Rising urban congestion demands efficient traffic management solutions
- 3.2.2 Industry pitfalls and challenges
- 3.2.2.1 High initial implementation and maintenance costs
- 3.2.2.2 Resistance from consumers to dynamic pricing models
- 3.2.3 Market opportunities
- 3.2.3.1 Integration with smart city infrastructure
- 3.2.3.2 Rising demand for sustainable and eco-friendly transport
- 3.2.3.3 Advancements in IoT, AI, and big data analytics
- 3.2.3.4 Expansion of public-private partnerships (PPP) in transport projects
- 3.2.1 Growth drivers
- 3.3 Growth potential analysis
- 3.4 Regulatory landscape
- 3.4.1 North America
- 3.4.1.1 Federal Highway Administration (FHWA) - Tolling and Pricing Program
- 3.4.1.2 E-ZPass Interagency Group - ETC Interoperability Standards
- 3.4.1.3 Canada: Transport Canada - Intelligent Transportation Systems Standards
- 3.4.2 Europe
- 3.4.2.1 European Electronic Toll Service (EETS) - EU Directive 2019/520
- 3.4.2.2 EU Intelligent Transport Systems Directive (2010/40/EU) and Delegated Regulations
- 3.4.3 Asia Pacific
- 3.4.3.1 China: Ministry of Transport - ETC National Standards (GB/T Standards)
- 3.4.3.2 India: National Highways Authority of India (NHAI) - FASTag Standards
- 3.4.4 Latin America
- 3.4.4.1 Brazil: ANTT - National Land Transportation Agency Tolling Regulation
- 3.4.4.2 Mexico: SCT - Secretariat of Infrastructure, Communications and Transport
- 3.4.5 Middle East & Africa
- 3.4.5.1 UAE: Roads and Transport Authority (RTA) - Toll System Regulations
- 3.4.5.2 Saudi Arabia: SASO and Ministry of Transport - Road Pricing Standards
- 3.4.5.3 African Union: Programme for Infrastructure Development in Africa (PIDA)
- 3.4.1 North America
- 3.5 Porter's analysis
- 3.6 PESTEL analysis
- 3.7 Technology and innovation landscape
- 3.7.1 Current technological trends
- 3.7.2 Emerging technologies
- 3.8 Business Models and Monetization Framework
- 3.8.1 Revenue Models
- 3.8.2 Value Chain and Ecosystem
- 3.8.3 Go-to-Market Strategy
- 3.9 Quality Standards, Compliance, and Product Risk
- 3.9.1 Component Safety and Regulatory Compliance
- 3.9.2 Product Performance and Durability Risk
- 3.9.3 Operational and Supply Chain Risks
- 3.10 ATPS Platform Architecture
- 3.10.1 Multi-Layer ATPS System Architecture Models
- 3.10.2 Vehicle-to-Infrastructure and Connected Mobility Integration
- 3.11 Patent analysis (Driven by Primary Research)
- 3.12 Pricing Analysis (Driven by Primary Research)
- 3.12.1 Historical Price Trend Analysis
- 3.12.2 Pricing Strategy by Player Type
- 3.13 Production statistics
- 3.13.1 Production hubs
- 3.13.2 Consumption hubs
- 3.14 Trade Data Analysis (Driven by Paid Database)
- 3.14.1 Import/Export Volume & Value Trends
- 3.14.2 Key Trade Corridors & Tariff Impact
- 3.15 Sustainability and environmental aspects
- 3.15.1 Sustainable Manufacturing Practices
- 3.15.2 Energy Efficiency in Production and Operations
- 3.15.3 Carbon footprint considerations
- 3.15.3.1 GenAI use cases & adoption roadmap by segment
- 3.15.3.1.1 Tread pattern design generation
- 3.15.3.1.2 Customer service chatbots & technical support
- 3.15.3.1.3 Marketing content creation
- 3.15.3.1.4 Risks, limitations & regulatory considerations
- 3.15.3.1 GenAI use cases & adoption roadmap by segment
- 3.16 Forecast assumptions & scenario analysis (Driven by Primary Research)
- 3.16.1 Base Case - key macro & industry variables driving CAGR
- 3.16.2 Optimistic Scenarios - Favorable Macro and Industry Tailwinds
- 3.16.3 Pessimistic Scenario - Macroeconomic slowdown or industry headwinds
Chapter 4 Competitive Landscape, 2025
- 4.1 Introduction
- 4.2 Company market share analysis
- 4.2.1 North America
- 4.2.2 Europe
- 4.2.3 Asia Pacific
- 4.2.4 LATAM
- 4.2.5 MEA
- 4.3 Competitive analysis of major market players
- 4.4 Competitive positioning matrix
- 4.5 Strategic outlook matrix
- 4.6 Key developments
- 4.6.1 Mergers & acquisitions
- 4.6.2 Partnerships & collaborations
- 4.6.3 New product launches
- 4.6.4 Expansion plans and funding
Chapter 5 Market Estimates & Forecast, By Solution, 2022 - 2035 ($Mn)
- 5.1 Key trends
- 5.2 Congestion Pricing Systems
- 5.3 Vehicle Miles Traveled (VMT) Monitoring
- 5.4 Electronic Toll Collection (ETC)
- 5.5 Dynamic Fare Management
- 5.6 Parking Pricing & Management
- 5.7 Other Solutions
Chapter 6 Market Estimates & Forecast, By Component, 2022 - 2035 ($Mn, Units)
- 6.1 Key trends
- 6.2 Hardware
- 6.2.1 Transponders / OBUs
- 6.2.2 ANPR / ALPR Cameras
- 6.2.3 RFID Readers
- 6.2.4 Communication Equipment
- 6.2.5 Others
- 6.3 Software
- 6.3.1 Back-Office Tolling Platform
- 6.3.2 Payment & Settlement Software
- 6.3.3 Congestion Pricing Software
- 6.3.4 Others
- 6.4 Services
- 6.4.1 Professional Services
- 6.4.2 Managed Services
Chapter 7 Market Estimates & Forecast, By Deployment, 2022 - 2035 ($Mn)
- 7.1 Key trends
- 7.2 Cloud-based
- 7.3 On-premise
Chapter 8 Market Estimates & Forecast, By Application, 2022 - 2035 ($Mn)
- 8.1 Key trends
- 8.2 Urban Congestion Management
- 8.3 Smart City Integration
- 8.4 Freight & Logistics Pricing
- 8.5 Parking Management
- 8.6 Others
Chapter 9 Market Estimates & Forecast, By End Use, 2022 - 2035 ($Mn)
- 9.1 Key trends
- 9.2 Government Authorities
- 9.3 Private Transport Companies
- 9.4 Logistics / Fleet Operators
- 9.5 Vehicle Owners
Chapter 10 Market Estimates & Forecast, By Region, 2022 - 2035 ($Mn)
- 10.1 Key trends
- 10.2 North America
- 10.2.1 US
- 10.2.2 Canada
- 10.3 Europe
- 10.3.1 Germany
- 10.3.2 UK
- 10.3.3 France
- 10.3.4 Italy
- 10.3.5 Spain
- 10.3.6 Nordics
- 10.3.7 Russia
- 10.3.8 Norway
- 10.3.9 Denmark
- 10.3.10 Netherlands
- 10.3.11 Belgium
- 10.4 Asia Pacific
- 10.4.1 China
- 10.4.2 India
- 10.4.3 Japan
- 10.4.4 South Korea
- 10.4.5 ANZ
- 10.4.6 Vietnam
- 10.4.7 Indonesia
- 10.4.8 Singapore
- 10.4.9 Malaysia
- 10.4.10 Thailand
- 10.5 Latin America
- 10.5.1 Brazil
- 10.5.2 Mexico
- 10.5.3 Argentina
- 10.6 MEA
- 10.6.1 South Africa
- 10.6.2 Saudi Arabia
- 10.6.3 UAE
Chapter 11 Company Profiles
- 11.1 Global companies
- 11.1.1 Conduent
- 11.1.2 Cubic
- 11.1.3 Ericsson
- 11.1.4 IBM
- 11.1.5 Fluor
- 11.1.6 Hewlett Packard
- 11.1.7 International Road Dynamics
- 11.1.8 Kapsch TrafficCom
- 11.1.9 Siemens Mobility
- 11.1.10 TomTom
- 11.1.11 TransCore
- 11.1.12 Worldline
- 11.2 Regional players
- 11.2.1 ACS
- 11.2.2 INIT
- 11.2.3 Iteris
- 11.2.4 Mobiliya
- 11.2.5 Moovit
- 11.2.6 Q-Free
- 11.2.7 TollPlus
- 11.2.8 Viaplus
 先进电池市场:按化学成分、电芯形式、电池类型、应用和最终用户划分-2026-2032年全球市场预测
 先进电池材料市场预测至2034年—全球材料类型、电池类型、形状、技术、应用、最终用户和区域分析
 全球先进电池市场规模、份额、趋势和成长分析报告(2026-2034年)大型圆柱形电池雷射焊接市场:按雷射源类型、电池化学成分、电池容量、功率输出、焊接技术和应用划分-全球预测,2026-2032年
 2026年全球先进电池技术市场报告2026年全球大型圆柱形电池市场报告
 先进电池技术市场-全球产业规模、份额、趋势、机会与预测:按技术、最终用户、地区和竞争对手划分,2021-2031年浸没式液冷电池系统市场按应用、化学成分、模组类型、冷却液类型和电压划分-2026-2032年全球预测
 硅奈米线电池技术市场机会、成长驱动因素、产业趋势分析及预测(2025-2034年)
 全球资料中心电池市场