


 |
市场调查报告书
商品编码
1665253
先进公共运输系统 (APTS) 市场机会、成长动力、产业趋势分析与 2025 - 2034 年预测Advanced Public Transportation System (APTS) Market Opportunity, Growth Drivers, Industry Trend Analysis, and Forecast 2025 - 2034 |
||||||
2024 年全球先进公共交通系统市场价值为 64 亿美元,预计将经历令人瞩目的成长,2025 年至 2034 年的复合年增长率为 8.3%。这项扩张背后的关键因素是对智慧城市日益增长的需求,智慧城市优先减少碳排放、提高公共交通效率并提供创新解决方案以增强城市流动性。
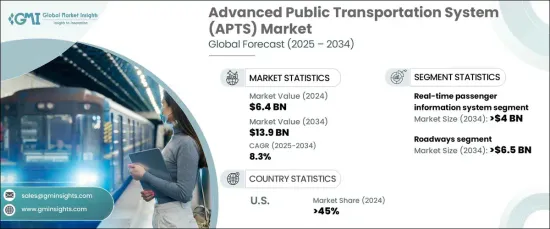
APTS 市场涵盖多个技术驱动领域,包括即时乘客资讯系统、自动车辆定位 (AVL)、电脑辅助调度、电子支付系统 (EPS) 和乘客资讯系统 (PIS)。其中,即时乘客资讯系统领域在 2024 年占据 30% 的主导份额,预计到 2034 年将产生 40 亿美元的收入。透过分析历史数据和即时资料,这些系统可以预测需求、优化运输路线、识别拥塞热点,最终提高服务交付和效率。
| 市场范围 | |
|---|---|
| 起始年份 | 2024 |
| 预测年份 | 2025-2034 |
| 起始值 | 64亿美元 |
| 预测值 | 139亿美元 |
| 复合年增长率 | 8.3% |
就运输方式而言,APTS市场分为公路运输、铁路运输、航空运输及水路运输。在几个新兴趋势的推动下,公路部门预计到 2034 年将达到 65 亿美元。许多城市正在投资专为自动公共交通设计的道路,配备专用车道、先进的感测器网路和智慧交通系统。这些智慧走廊专为优先考虑公车和班车等自动驾驶汽车而设计,整合车辆到基础设施 (V2I) 通信,以缓解交通拥堵、提高安全性并确保更可预测的旅行时间。这种尖端技术与周到的城市规划的整合旨在简化交通运输并提高交通系统的整体效率。
在美国,APTS 市场在 2024 年占据了 45% 的显着份额。这些人工智慧班车有助于解决劳动力短缺问题、降低营运成本并提高安全性和效率。美国着名的科技中心处于这项创新的前沿,致力于最大限度地减少人为错误并推动智慧城市交通基础设施的发展。这种集中的努力使得美国在全球 APTS 市场占据主导地位。
目录
第 1 章:方法论与范围
- 研究设计
- 研究方法
- 资料收集方法
- 基础估计和计算
- 基准年计算
- 市场估计的主要趋势
- 预测模型
- 初步研究与验证
- 主要来源
- 资料探勘来源
- 市场定义
第 2 章:执行摘要
第 3 章:产业洞察
- 产业生态系统分析
- 供应商概况
- 大众运输业者
- 技术提供者
- 系统整合商
- 最终用户
- 利润率分析
- 技术差异化
- 即时资料分析
- 车辆与基础设施通信
- 电动和永续移动解决方案
- 非接触式支付解决方案
- 其他的
- 重要新闻及倡议
- 专利分析
- 监管格局
- 衝击力
- 成长动力
- 城市交通拥挤加剧
- 公共交通车队数位化的兴起
- 政府的基础建设投资
- 改变出行偏好
- 产业陷阱与挑战
- 监管标准化挑战
- 初期基础建设投资高
- 成长动力
- 成长潜力分析
- 波特的分析
- PESTEL 分析
第四章:竞争格局
- 介绍
- 公司市占率分析
- 竞争定位矩阵
- 战略展望矩阵
第五章:市场估计与预测:按组件,2021 - 2034 年
- 主要趋势
- 硬体
- 感应器
- 显示面板
- 通讯设备
- 机载计算机
- 其他的
- 软体
- 服务
- 专业服务
- 託管服务
第六章:市场估计与预测:依技术,2021 - 2034 年
- 主要趋势
- 即时乘客资讯系统
- 自动车辆定位 (AVL)
- 电脑辅助调度(CAD)
- 电子支付系统(EPS)
- 乘客资讯系统 (PIS)
第 7 章:市场估计与预测:按应用,2021 - 2034 年
- 主要趋势
- 交通管理
- 车队管理
- 乘客安全与保障
- 票务解决方案
- 公共资讯传播
第 8 章:市场估计与预测:按运输方式,2021 - 2034 年
- 主要趋势
- 道路
- 铁路
- 航空
- 水路
第 9 章:市场估计与预测:按地区,2021 - 2034 年
- 主要趋势
- 北美洲
- 我们
- 加拿大
- 欧洲
- 英国
- 德国
- 法国
- 西班牙
- 义大利
- 俄罗斯
- 北欧
- 亚太地区
- 中国
- 印度
- 日本
- 韩国
- 澳新银行
- 东南亚
- 拉丁美洲
- 巴西
- 墨西哥
- 阿根廷
- 中东及非洲
- 阿联酋
- 南非
- 沙乌地阿拉伯
第十章:公司简介
- Alstom
- Bombardier
- CAF
- Cisco
- Conduent Transportation
- CRRC
- Cubic Transportation Systems
- EasyMile
- Garmin
- Hitachi Rail
- Huawei
- Indra
- Kapsch
- New Flyer
- Parsons
- Raytheon
- Siemens
- Stadler
- Thales Group
- Transdev
- Trapeze
- Volvo
The Global Advanced Public Transportation System Market was valued at USD 6.4 billion in 2024 and is expected to experience impressive growth, with a CAGR of 8.3% from 2025 to 2034. This growth is largely driven by increasing government investments in smart transportation solutions and the shift toward sustainable urban mobility. A key factor behind this expansion is the growing demand for smarter cities, which prioritize reducing carbon emissions, improving public transport efficiency, and offering innovative solutions to enhance urban mobility.
The APTS market spans several technology-driven segments, including real-time passenger information systems, Automated Vehicle Location (AVL), computer-aided dispatch, Electronic Payment Systems (EPS), and Passenger Information Systems (PIS). Among these, the real-time passenger information systems segment held a dominant 30% share in 2024 and is projected to generate USD 4 billion by 2034. These advanced systems leverage artificial intelligence and machine learning to deliver predictive analytics, improving the passenger experience. By analyzing both historical and real-time data, these systems forecast demand, optimize transportation routes, and identify congestion hotspots, ultimately enhancing service delivery and efficiency.
| Market Scope | |
|---|---|
| Start Year | 2024 |
| Forecast Year | 2025-2034 |
| Start Value | $6.4 Billion |
| Forecast Value | $13.9 Billion |
| CAGR | 8.3% |
In terms of transportation modes, the APTS market is divided into roadways, railways, airways, and waterways. The roadways segment is expected to reach USD 6.5 billion by 2034, driven by several emerging trends. Many cities are investing in specialized roadways designed for autonomous public transport, equipped with dedicated lanes, advanced sensor networks, and intelligent traffic systems. These smart corridors are tailored to prioritize autonomous vehicles like buses and shuttles, integrating vehicle-to-infrastructure (V2I) communication to alleviate congestion, boost safety, and ensure more predictable travel times. This fusion of cutting-edge technology with thoughtful urban planning is set to streamline mobility and enhance the overall efficiency of transportation systems.
In the U.S., the APTS market held a significant 45% share in 2024. U.S. cities are leading the charge in deploying autonomous electric shuttle services, particularly in controlled environments such as airports, campuses, and business districts. These AI-powered shuttles are helping to address labor shortages, reduce operational costs, and improve both safety and efficiency. Prominent tech hubs in the U.S. are at the forefront of this innovation, focusing on minimizing human error and advancing the development of smart urban mobility infrastructure. This concentrated effort has positioned the U.S. as a dominant player in the global APTS market.
Table of Contents
Chapter 1 Methodology & Scope
- 1.1 Research design
- 1.1.1 Research approach
- 1.1.2 Data collection methods
- 1.2 Base estimates and calculations
- 1.2.1 Base year calculation
- 1.2.2 Key trends for market estimates
- 1.3 Forecast model
- 1.4 Primary research & validation
- 1.4.1 Primary sources
- 1.4.2 Data mining sources
- 1.5 Market definitions
Chapter 2 Executive Summary
- 2.1 Industry 3600 synopsis, 2021 - 2034
Chapter 3 Industry Insights
- 3.1 Industry ecosystem analysis
- 3.2 Supplier landscape
- 3.2.1 Public transportation operators
- 3.2.2 Technology providers
- 3.2.3 System integrators
- 3.2.4 End users
- 3.3 Profit margin analysis
- 3.4 Technology differentiators
- 3.4.1 Real-time data analytics
- 3.4.2 Vehicle-to-infrastructure communication
- 3.4.3 Electric and sustainable mobility solutions
- 3.4.4 Contactless payment solutions
- 3.4.5 Others
- 3.5 Key news & initiatives
- 3.6 Patent analysis
- 3.7 Regulatory landscape
- 3.8 Impact forces
- 3.8.1 Growth drivers
- 3.8.1.1 Growth in urban traffic congestion
- 3.8.1.2 Emerging digitization in public transportation fleets
- 3.8.1.3 Infrastructure investments by governments
- 3.8.1.4 Changing mobility preferences
- 3.8.2 Industry pitfalls & challenges
- 3.8.2.1 Regulatory standardization challenges
- 3.8.2.2 High initial infrastructure investment
- 3.8.1 Growth drivers
- 3.9 Growth potential analysis
- 3.10 Porter’s analysis
- 3.11 PESTEL analysis
Chapter 4 Competitive Landscape, 2024
- 4.1 Introduction
- 4.2 Company market share analysis
- 4.3 Competitive positioning matrix
- 4.4 Strategic outlook matrix
Chapter 5 Market Estimates & Forecast, By Component, 2021 - 2034 ($Bn)
- 5.1 Key trends
- 5.2 Hardware
- 5.2.1 Sensors
- 5.2.2 Display panels
- 5.2.3 Communication devices
- 5.2.4 Onboard computers
- 5.2.5 Others
- 5.3 Software
- 5.4 Services
- 5.4.1 Professional services
- 5.4.2 Managed services
Chapter 6 Market Estimates & Forecast, By Technology, 2021 - 2034 ($Bn)
- 6.1 Key trends
- 6.2 Real-time passenger information system
- 6.3 Automated Vehicle Location (AVL)
- 6.4 Computer-aided dispatch (CAD)
- 6.5 Electronic Payment Systems (EPS)
- 6.6 Passenger Information Systems (PIS)
Chapter 7 Market Estimates & Forecast, By Application, 2021 - 2034 ($Bn)
- 7.1 Key trends
- 7.2 Traffic management
- 7.3 Fleet management
- 7.4 Passenger safety & security
- 7.5 Ticketing solutions
- 7.6 Public information dissemination
Chapter 8 Market Estimates & Forecast, By Mode of Transportation, 2021 - 2034 ($Bn)
- 8.1 Key trends
- 8.2 Roadways
- 8.3 Railways
- 8.4 Airways
- 8.5 Waterways
Chapter 9 Market Estimates & Forecast, By Region, 2021 - 2034 ($Bn)
- 9.1 Key trends
- 9.2 North America
- 9.2.1 U.S.
- 9.2.2 Canada
- 9.3 Europe
- 9.3.1 UK
- 9.3.2 Germany
- 9.3.3 France
- 9.3.4 Spain
- 9.3.5 Italy
- 9.3.6 Russia
- 9.3.7 Nordics
- 9.4 Asia Pacific
- 9.4.1 China
- 9.4.2 India
- 9.4.3 Japan
- 9.4.4 South Korea
- 9.4.5 ANZ
- 9.4.6 Southeast Asia
- 9.5 Latin America
- 9.5.1 Brazil
- 9.5.2 Mexico
- 9.5.3 Argentina
- 9.6 MEA
- 9.6.1 UAE
- 9.6.2 South Africa
- 9.6.3 Saudi Arabia
Chapter 10 Company Profiles
- 10.1 Alstom
- 10.2 Bombardier
- 10.3 CAF
- 10.4 Cisco
- 10.5 Conduent Transportation
- 10.6 CRRC
- 10.7 Cubic Transportation Systems
- 10.8 EasyMile
- 10.9 Garmin
- 10.10 Hitachi Rail
- 10.11 Huawei
- 10.12 Indra
- 10.13 Kapsch
- 10.14 New Flyer
- 10.15 Parsons
- 10.16 Raytheon
- 10.17 Siemens
- 10.18 Stadler
- 10.19 Thales Group
- 10.20 Transdev
- 10.21 Trapeze
- 10.22 Volvo
 高阶身分验证市场:2026-2032 年全球预测,依身分验证方法、元件、产业、部署类型和企业规模划分
 2026年金融服务领域高阶身分验证全球市场报告
 2035 年健康记录高级生物识别市场分析与预测:按类型、产品类型、服务、技术、组件、应用、部署类型和最终用户划分FIDO认证市场分析及预测(至2035年):依类型、产品、服务、技术、组件、应用、部署、最终用户及解决方案划分
 全球FIDO认证市场规模、份额、趋势和成长分析报告(2026-2034年)
 高阶身分验证市场规模、份额和成长分析(按身分验证类型、身分验证方法、部署类型、组织规模、最终用户产业和地区划分)—产业预测(2026-2033 年)
 2025-2029年全球高级认证市场
 2025 年至 2033 年进阶身分验证市场报告(依身分验证方法、部署、解决方案、最终使用者产业和地区划分)
 高级认证-市场占有率分析、行业趋势和统计、成长预测(2025-2030 年)