


 |
市场调查报告书
商品编码
1665407
建筑垃圾市场机会、成长动力、产业趋势分析与 2024 - 2032 年预测Construction Waste Market Opportunity, Growth Drivers, Industry Trend Analysis, and Forecast 2024 - 2032 |
||||||
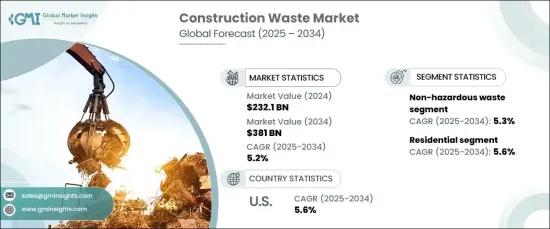
2023 年全球建筑废弃物市场价值为 2,321 亿美元,预计 2025 年至 2034 年期间的复合年增长率为 5.2%。这种快速发展导致建筑和拆除废弃物的产生量大幅增加,从而推动了对高效废弃物管理解决方案的需求。
世界各国政府正在推出严格的法规来减轻建筑废弃物对环境的影响。这些政策强调回收材料、减少对垃圾掩埋场的依赖以及提倡永续的做法。此外,全球推动循环经济原则凸显了重复使用和回收建筑材料的重要性,有助于市场成长。然而,垃圾分类、处理和回收的高成本仍然是该行业面临的主要挑战。许多公司在采用永续废弃物管理实务方面面临财务障碍,尤其是在缺乏强有力的监管诱因的情况下。
| 市场范围 | |
|---|---|
| 起始年份 | 2023 |
| 预测年份 | 2024-2032 |
| 起始值 | 2321亿美元 |
| 预测值 | 3810亿美元 |
| 复合年增长率 | 5.2% |
无害废弃物在 2024 年将达到 1,864 亿美元,预计到 2034 年将以 5.3% 的复合年增长率增长。此外,越来越多地采用环保建筑方法和政府要求回收无害废物也进一步推动了这一领域的成长。
住宅建筑业在 2024 年获得了 40.6% 的收入份额,预计到 2034 年将以 5.6% 的复合年增长率增长。全球范围内经济适用房计划的扩张和城市基础设施的发展也在推动该领域的垃圾量增长方面发挥着重要作用。
仅美国建筑废弃物市场规模在 2024 年就超过了 441 亿美元,预计到 2034 年复合年增长率将达到 5.6%。随着建筑企业持续成长,对废弃物管理解决方案的需求可能仍将保持强劲,确保市场稳定成长。
目录
第 1 章:方法论与范围
- 市场范围和定义
- 基础估算与计算
- 预测参数
- 资料来源
- 基本的
- 次要
- 付费来源
- 公共资源
第 2 章:执行摘要
第 3 章:产业洞察
- 产业生态系统分析
- 影响价值链的因素
- 利润率分析
- 中断
- 未来展望
- 製造商
- 经销商
- 零售商
- 衝击力
- 成长动力
- 都市化和基础建设加快
- 政府法规和永续发展倡议
- 建筑和拆除活动增加
- 产业陷阱与挑战
- 回收和废弃物管理成本高
- 缺乏高效率的回收基础设施
- 成长动力
- 技术与创新格局
- 消费者购买行为分析
- 人口趋势
- 影响购买决策的因素
- 消费者产品采用
- 首选配销通路
- 成长潜力分析
- 监管格局
- 定价分析
- 波特的分析
- PESTEL 分析
第四章:竞争格局
- 介绍
- 公司市占率分析
- 竞争定位矩阵
- 战略展望矩阵
第五章:市场估计与预测:依废弃物类型,2021 – 2034 年
- 主要趋势
- 危险
- 无害
第 6 章:市场估计与预测:按材料,2021 – 2034 年
- 主要趋势
- 土壤、沙子和砾石
- 具体的
- 砖块和砖石
- 木头
- 金属
- 其他的
第 7 章:市场估计与预测:按来源,2021 年至 2034 年
- 主要趋势
- 住宅
- 商业的
- 工业的
第 8 章:市场估计与预测:按服务,2021 年至 2034 年
- 主要趋势
- 收藏
- 运输
- 处理
第 9 章:市场估计与预测:按地区,2021 年至 2034 年
- 主要趋势
- 北美洲
- 我们
- 加拿大
- 欧洲
- 德国
- 英国
- 法国
- 义大利
- 西班牙
- 亚太地区
- 中国
- 印度
- 日本
- 韩国
- 澳洲
- 马来西亚
- 印尼
- 拉丁美洲
- 巴西
- 墨西哥
- 中东及非洲
- 沙乌地阿拉伯
- 阿联酋
- 南非
第十章:公司简介
- Casella Waste Systems, Inc.
- Clean Harbors, Inc.
- Cleanaway Waster Management Limited
- Daiseki Co., Ltd.
- FCC Environment Limited
- GFL Environmental Inc.
- Kiverco
- Metso Corporation
- Remondis
- Renewi plc
- Republic Services
- Veolia Environment SA
- Waste Connections
- Windsor Waste
- WM Intellectual Property Holdings, LLC
The Global Construction Waste Market was valued at USD 232.1 billion in 2023 and is projected to expand at a CAGR of 5.2% from 2025 to 2034. The increasing pace of urbanization and infrastructure expansion is driving a notable surge in construction activities across developed and developing regions. This rapid development has led to a significant rise in construction and demolition waste generation, fueling the demand for efficient waste management solutions.
Governments worldwide are introducing stringent regulations to mitigate the environmental impact of construction waste. These policies emphasize recycling materials, reducing landfill dependency, and promoting sustainable practices. Additionally, the global push toward circular economy principles highlights the importance of reusing and recycling construction materials, which is contributing to market growth. However, the high costs associated with waste sorting, processing, and recycling remain a key challenge for the industry. Many companies face financial barriers to adopting sustainable waste management practices, especially in the absence of strong regulatory incentives.
| Market Scope | |
|---|---|
| Start Year | 2023 |
| Forecast Year | 2024-2032 |
| Start Value | $232.1 Billion |
| Forecast Value | $381 Billion |
| CAGR | 5.2% |
Non-hazardous waste, which accounted for USD 186.4 billion in 2024, is expected to grow at a CAGR of 5.3% through 2034. This segment benefits from the ease of recycling materials like concrete, bricks, and wood, which dominate construction and demolition waste streams. Additionally, increasing adoption of eco-friendly building methods and government mandates for recycling non-hazardous waste are further driving this segment's growth.
The residential construction sector secured a 40.6% revenue share in 2024 and is forecasted to grow at a CAGR of 5.6% through 2034. Residential projects contribute heavily to waste generation, especially during new construction, renovation, or demolition activities. The expansion of affordable housing initiatives and urban infrastructure development worldwide are also playing a significant role in driving waste volumes from this segment.
The US construction waste market alone surpassed USD 44.1 billion in 2024, with expectations of a 5.6% CAGR through 2034. Population growth and increased construction activity have contributed to this rise, with the sector playing a pivotal role in the national economy. As construction establishments continue to grow, demand for waste management solutions will likely remain strong, ensuring steady market growth.
Table of Contents
Chapter 1 Methodology & Scope
- 1.1 Market scope & definition
- 1.2 Base estimates & calculations
- 1.3 Forecast parameters
- 1.4 Data sources
- 1.4.1 Primary
- 1.4.2 Secondary
- 1.4.2.1 Paid sources
- 1.4.2.2 Public sources
Chapter 2 Executive Summary
- 2.1 Industry 3600 synopsis, 2021 - 2034
Chapter 3 Industry Insights
- 3.1 Industry ecosystem analysis
- 3.1.1 Factors affecting the value chain
- 3.1.2 Profit margin analysis
- 3.1.3 Disruptions
- 3.1.4 Future outlook
- 3.1.5 Manufacturers
- 3.1.6 Distributors
- 3.1.7 Retailers
- 3.2 Impact forces
- 3.2.1 Growth drivers
- 3.2.1.1 Increase in urbanization and infrastructure development
- 3.2.1.2 Government regulations and sustainability initiatives
- 3.2.1.3 Increasing construction and demolition activities
- 3.2.2 Industry pitfalls & challenges
- 3.2.2.1 High costs of recycling and waste management
- 3.2.2.2 Lack of efficient recycling infrastructure
- 3.2.1 Growth drivers
- 3.3 Technology & innovation landscape
- 3.4 Consumer buying behavior analysis
- 3.4.1 Demographic trends
- 3.4.2 Factors affecting buying decision
- 3.4.3 Consumer product adoption
- 3.4.4 Preferred distribution channel
- 3.5 Growth potential analysis
- 3.6 Regulatory landscape
- 3.7 Pricing analysis
- 3.8 Porter’s analysis
- 3.9 PESTEL analysis
Chapter 4 Competitive Landscape, 2024
- 4.1 Introduction
- 4.2 Company market share analysis
- 4.3 Competitive positioning matrix
- 4.4 Strategic outlook matrix
Chapter 5 Market Estimates & Forecast, By Waste Type, 2021 – 2034, (USD Billion)
- 5.1 Key trends
- 5.2 Hazardous
- 5.3 Non-hazardous
Chapter 6 Market Estimates & Forecast, By Material, 2021 – 2034, (USD Billion)
- 6.1 Key trends
- 6.2 Soil, sand, & gravel
- 6.3 Concrete
- 6.4 Bricks & masonry
- 6.5 Wood
- 6.6 Metal
- 6.7 Others
Chapter 7 Market Estimates & Forecast, By Source, 2021 – 2034, (USD Billion)
- 7.1 Key trends
- 7.2 Residential
- 7.3 Commercial
- 7.4 Industrial
Chapter 8 Market Estimates & Forecast, By Service, 2021 – 2034, (USD Billion)
- 8.1 Key trends
- 8.2 Collection
- 8.3 Transportation
- 8.4 Disposal
Chapter 9 Market Estimates & Forecast, By Region, 2021 – 2034, (USD Billion)
- 9.1 Key trends
- 9.2 North America
- 9.2.1 U.S.
- 9.2.2 Canada
- 9.3 Europe
- 9.3.1 Germany
- 9.3.2 UK
- 9.3.3 France
- 9.3.4 Italy
- 9.3.5 Spain
- 9.4 Asia Pacific
- 9.4.1 China
- 9.4.2 India
- 9.4.3 Japan
- 9.4.4 South Korea
- 9.4.5 Australia
- 9.4.6 Malaysia
- 9.4.7 Indonesia
- 9.5 Latin America
- 9.5.1 Brazil
- 9.5.2 Mexico
- 9.6 MEA
- 9.6.1 Saudi Arabia
- 9.6.2 UAE
- 9.6.3 South Africa
Chapter 10 Company Profiles (Business Overview, Financial Data, Product Landscape, Strategic Outlook, SWOT Analysis)
- 10.1 Casella Waste Systems, Inc.
- 10.2 Clean Harbors, Inc.
- 10.3 Cleanaway Waster Management Limited
- 10.4 Daiseki Co., Ltd.
- 10.5 FCC Environment Limited
- 10.6 GFL Environmental Inc.
- 10.7 Kiverco
- 10.8 Metso Corporation
- 10.9 Remondis
- 10.10 Renewi plc
- 10.11 Republic Services
- 10.12 Veolia Environment S.A.
- 10.13 Waste Connections
- 10.14 Windsor Waste
- 10.15 WM Intellectual Property Holdings, LLC
 自动化垃圾收集系统市场:按组件、系统类型、最终用户和垃圾类型划分-2026-2032年全球市场预测气动废弃物收集系统市场:按系统类型、组件、废弃物类型、安装方式、应用和销售管道,全球预测,2026-2032年
 自动化废弃物收集系统市场 - 全球产业规模、份额、趋势、机会、预测:按类型、营运方式、应用、地区和竞争格局划分,2021-2031年
 2026-2030年全球自动化废弃物收集系统市场
 2032 年自动废弃物分类和回收系统市场预测:按组件、废弃物分类类型、技术、最终用户和地区进行的全球分析
 全球气动废弃物收集服务市场
 自动废弃物收集系统市场,按产品类型、按组件、按操作模式、按废弃物类型、按最终用户、按国家/地区 - 2025 年至 2032 年全球行业分析、市场规模、市场份额和预测自动废弃物收集系统 (AWCS) 的全球市场全球废弃物收集设备市场,预测到 2030 年:按设备类型、按废弃物类型、按最终用户、按地区智慧垃圾收集技术市场,按服务、按解决方案、按最终用户、按国家和地区划分 - 2024-2032 年行业分析、市场规模、市场份额和预测