


 |
市场调查报告书
商品编码
1666956
连续油管市场机会、成长动力、产业趋势分析及 2025 - 2034 年预测Coiled Tubing Market Opportunity, Growth Drivers, Industry Trend Analysis, and Forecast 2025 - 2034 |
||||||
2024 年全球连续油管市场规模达到 30 亿美元,预计 2025 年至 2034 年期间的复合年增长率为 4.5%。对高效营运、成本效益和永续解决方案的日益关注进一步推动了市场扩张。
由于营运商优先考虑提高油井完整性和延长老化资产的使用寿命,预计到 2034 年油井干预服务部门将创造 21 亿美元。自动化、井下感测器和即时资料分析等先进技术的采用,透过提高操作效率和精度,正在改变干预活动。为了应对恶劣的井况和复杂的油藏,产业参与者正在开发专门的材料和设备,包括高压控制系统和耐腐蚀合金,进一步推动该领域的成长。
| 市场范围 | |
|---|---|
| 起始年份 | 2024 |
| 预测年份 | 2025-2034 |
| 起始值 | 30亿美元 |
| 预测值 | 46亿美元 |
| 复合年增长率 | 4.5% |
预计到 2034 年,陆上连续油管市场将实现 4% 的成长率,这得益于石油和天然气作业对经济高效的解决方案的需求不断增长。远端监控和自动化等技术的进步正在简化连续油管操作、提高准确性并最大限度地减少停机时间。井改造和压裂服务正在获得发展势头,特别是对于需要提高产量或进行维护的陆上油田。这种趋势在老化油井中尤其明显,操作员的目标是优化性能和提高生产力。
到 2034 年,美国连续油管市场预计将创收 10 亿美元,这主要得益于水平钻井和水力压裂等技术对碳氢化合物生产的大力推动。能源密集产业的投资不断增长以及对石油和天然气资源的需求不断上升强化了市场的成长轨迹。正在进行的勘探活动以及高效资源开采的需求也促使该地区越来越多地采用连续油管解决方案。
由于能源需求的不断增长、石油和天然气勘探活动的不断扩大以及对优化油井性能的重视,连续油管市场将经历持续成长。技术创新与可持续且经济高效的解决方案相结合,正在重塑营运并推动采用。对先进干预服务和陆上应用的日益重视进一步凸显了未来十年市场稳步扩张的潜力。
目录
第 1 章:方法论与范围
- 市场定义
- 基础估算与计算
- 预测计算
- 资料来源
- 基本的
- 次要
- 有薪资的
- 民众
第 2 章:执行摘要
第 3 章:产业洞察
- 产业生态系统分析
- 监管格局
- 产业衝击力
- 成长动力
- 产业陷阱与挑战
- 成长潜力分析
- 波特的分析
- 供应商的议价能力
- 买家的议价能力
- 新进入者的威胁
- 替代品的威胁
- PESTEL 分析
第四章:竞争格局
- 介绍
- 战略仪表板
- 创新与永续发展格局
第 5 章:市场规模及预测:依服务,2021 – 2034 年
- 主要趋势
- 油井干预
- 井清洁
- 完井
- 钓鱼
- 穿孔
- 日誌记录
- 其他的
- 钻孔
- 控压钻井
- 定向钻井
第 6 章:市场规模与预测:按应用,2021 – 2034 年
- 主要趋势
- 陆上
- 服务
- 井干预
- 井清洁
- 完井
- 钓鱼
- 服务
6.2.1.3.2 穿孔
6.2.1.3.3 日誌记录
6.2.1.3.4 其他
- 钻孔
- 控压钻井
- 定向钻井
- 海上
- 浅的
- 井干预
- 井清洁
- 完井
- 钓鱼
- 穿孔
- 日誌记录
- 其他的
- 钻孔
- 控压钻井
- 定向钻井
- 深的
- 井干预
- 井清洁
- 完井
- 钓鱼
- 穿孔
- 日誌记录
- 其他的
- 钻孔
- 控压钻井
- 定向钻井
- 超深
- 井干预
- 井清洁
- 完井
- 钓鱼
- 穿孔
- 日誌记录
- 其他的
- 钻孔
- 控压钻井
- 定向钻井
- 浅的
第 7 章:市场规模及预测:按地区,2021 – 2034 年
- 主要趋势
- 北美洲
- 我们
- 加拿大
- 欧洲
- 俄罗斯
- 英国
- 挪威
- 荷兰
- 亚太地区
- 中国
- 印度
- 澳洲
- 印尼
- 中东和非洲
- 沙乌地阿拉伯
- 阿联酋
- 埃及
- 拉丁美洲
- 巴西
- 墨西哥
- 阿根廷
第八章:公司简介
- Baker Hughes
- Calfrac Well Services
- CJ Well Services
- Halliburton
- KLX Energy
- Nabors Industries
- National Oilwell Varco
- Nine Energy Service
- Royal IHC
- Schlumberger
- STEP Energy Services
- Tenaris
- Trican
- Weatherford
- Well Service Group
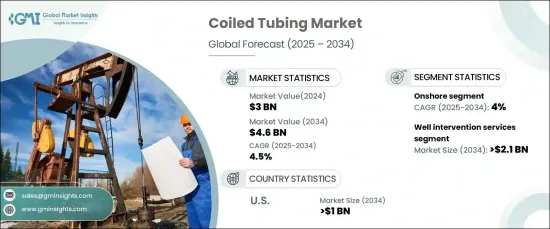
The Global Coiled Tubing Market reached USD 3 billion in 2024 and is anticipated to grow at a CAGR of 4.5% from 2025 to 2034. This growth is primarily driven by rising exploration and production (E&P) investments, surging energy demands, and the need for enhanced services to maintain mature oil fields. Increasing focus on efficient operations, cost-effectiveness, and sustainable solutions is further propelling market expansion.
The well intervention services segment is expected to generate USD 2.1 billion by 2034 as operators prioritize improving well integrity and extending the lifespan of aging assets. The adoption of advanced technologies, such as automation, downhole sensors, and real-time data analytics, is transforming intervention activities by enhancing operational efficiency and precision. To address harsh well conditions and complex reservoirs, industry players are developing specialized materials and equipment, including high-pressure control systems and corrosion-resistant alloys, further driving growth in this segment.
| Market Scope | |
|---|---|
| Start Year | 2024 |
| Forecast Year | 2025-2034 |
| Start Value | $3 Billion |
| Forecast Value | $4.6 Billion |
| CAGR | 4.5% |
The onshore coiled tubing market is projected to witness a growth rate of 4% through 2034, fueled by the increasing demand for cost-effective solutions in oil and gas operations. Advancements in technology, such as remote monitoring and automation, are streamlining coiled tubing operations, improving accuracy, and minimizing downtime. Well stimulation and fracturing services are gaining momentum, particularly for onshore fields requiring production enhancements or maintenance. This trend is particularly evident in aging wells where operators aim to optimize performance and extend productivity.
U.S. coiled tubing market is poised to generate USD 1 billion through 2034, driven by a strong focus on hydrocarbon production through technologies like horizontal drilling and hydraulic fracturing. Growing investments in energy-intensive sectors and the rising demand for oil and gas resources reinforce the market's growth trajectory. Ongoing exploration activities, along with the need for efficient resource extraction, are also contributing to the increased adoption of coiled tubing solutions across the region.
The coiled tubing market is set to experience consistent growth due to rising energy needs, expanding oil and gas exploration activities, and the focus on optimizing well performance. Technological innovations, coupled with sustainable and cost-efficient solutions, are reshaping operations and driving adoption. The increasing emphasis on advanced intervention services and onshore applications further highlights the market's potential for steady expansion over the coming decade.
Table of Contents
Chapter 1 Methodology & Scope
- 1.1 Market definitions
- 1.2 Base estimates & calculations
- 1.3 Forecast calculation
- 1.4 Data sources
- 1.4.1 Primary
- 1.4.2 Secondary
- 1.4.2.1 Paid
- 1.4.2.2 Public
Chapter 2 Executive Summary
- 2.1 Industry 360° synopsis, 2021 - 2034
Chapter 3 Industry Insights
- 3.1 Industry ecosystem analysis
- 3.2 Regulatory landscape
- 3.3 Industry impact forces
- 3.3.1 Growth drivers
- 3.3.2 Industry pitfalls & challenges
- 3.4 Growth potential analysis
- 3.5 Porter's analysis
- 3.5.1 Bargaining power of suppliers
- 3.5.2 Bargaining power of buyers
- 3.5.3 Threat of new entrants
- 3.5.4 Threat of substitutes
- 3.6 PESTEL analysis
Chapter 4 Competitive Landscape, 2024
- 4.1 Introduction
- 4.2 Strategic dashboard
- 4.3 Innovation & sustainability landscape
Chapter 5 Market Size and Forecast, By Service, 2021 – 2034 (USD Million, Units)
- 5.1 Key trends
- 5.2 Well Intervention
- 5.3 Well cleaning
- 5.4 Well completion
- 5.4.1 Fishing
- 5.4.2 Perforation
- 5.4.3 Logging
- 5.4.4 Others
- 5.5 Drilling
- 5.5.1 Managed pressure drilling
- 5.5.2 Directional drilling
Chapter 6 Market Size and Forecast, By Application, 2021 – 2034 (USD Million, Units)
- 6.1 Key trends
- 6.2 Onshore
- 6.2.1 Service
- 6.2.1.1 Well intervention
- 6.2.1.2 Well cleaning
- 6.2.1.3 Well completion
- 6.2.1.3.1 Fishing
- 6.2.1.3.2 Perforation
- 6.2.1.3.3 Logging
- 6.2.1.3.4 Others
- 6.2.1 Service
- 6.2.4 Drilling
- 6.2.4.1 Managed pressure drilling
- 6.2.4.2 Directional drilling
- 6.3 Offshore
- 6.3.1 Shallow
- 6.3.1.1 Well intervention
- 6.3.1.2 Well cleaning
- 6.3.1.3 Well completion
- 6.3.1.3.1 Fishing
- 6.3.1.3.2 Perforation
- 6.3.1.3.3 Logging
- 6.3.1.3.4 Others
- 6.3.1.4 Drilling
- 6.3.1.4.1 Managed pressure drilling
- 6.3.1.4.2 Directional drilling
- 6.3.2 Deep
- 6.3.2.1 Well intervention
- 6.3.2.2 Well cleaning
- 6.3.2.3 Well completion
- 6.3.2.3.1 Fishing
- 6.3.2.3.2 Perforation
- 6.3.2.3.3 Logging
- 6.3.2.3.4 Others
- 6.3.2.4 Drilling
- 6.3.2.4.1 Managed pressure drilling
- 6.3.2.4.2 Directional drilling
- 6.3.3 Ultra-Deep
- 6.3.3.1 Well intervention
- 6.3.3.2 Well cleaning
- 6.3.3.3 Well completion
- 6.3.3.3.1 Fishing
- 6.3.3.3.2 Perforation
- 6.3.3.3.3 Logging
- 6.3.3.3.4 Others
- 6.3.3.4 Drilling
- 6.3.3.4.1 Managed pressure drilling
- 6.3.3.4.2 Directional drilling
- 6.3.1 Shallow
Chapter 7 Market Size and Forecast, By Region, 2021 – 2034 (USD Million, Units)
- 7.1 Key trends
- 7.2 North America
- 7.2.1 U.S.
- 7.2.2 Canada
- 7.3 Europe
- 7.3.1 Russia
- 7.3.2 UK
- 7.3.3 Norway
- 7.3.4 Netherlands
- 7.4 Asia Pacific
- 7.4.1 China
- 7.4.2 India
- 7.4.3 Australia
- 7.4.4 Indonesia
- 7.5 Middle East & Africa
- 7.5.1 Saudi Arabia
- 7.5.2 UAE
- 7.5.3 Egypt
- 7.6 Latin America
- 7.6.1 Brazil
- 7.6.2 Mexico
- 7.6.3 Argentina
Chapter 8 Company Profiles
- 8.1 Baker Hughes
- 8.2 Calfrac Well Services
- 8.3 CJ Well Services
- 8.4 Halliburton
- 8.5 KLX Energy
- 8.6 Nabors Industries
- 8.7 National Oilwell Varco
- 8.8 Nine Energy Service
- 8.9 Royal IHC
- 8.10 Schlumberger
- 8.11 STEP Energy Services
- 8.12 Tenaris
- 8.13 Trican
- 8.14 Weatherford
- 8.15 Well Service Group
 2026年全球挠曲油管服务市场报告2026年全球盘管市场报告
 挠曲油管市场规模、份额和趋势分析报告:按服务、营运、应用、地区和细分市场预测(2026-2033 年)
 连续油管市场-全球产业规模、份额、趋势、机会、预测:按服务类型、应用、地区和竞争格局划分,2021-2031年
 全球挠曲油管服务市场:市场规模、占有率、成长率、产业分析、依类型、应用和地区划分的考察、未来预测(2026-2034)
 挠曲油管市场规模、份额和成长分析(按服务、应用、船队和地区划分)-2026-2033年产业预测
 连续油管钻井服务市场机会、成长驱动因素、产业趋势分析及预测(2025-2034年)
 挠曲油管市场(按产品和地区)
 2032 年挠曲油管服务市场预测:按服务类型、应用、最终用户和地区进行的全球分析
 连续油管的全球市场:市场规模·占有率·趋势,产业分析 (各类服务·工作·各用途·各地区),未来预测 (2025年~2034年)