


 |
市场调查报告书
商品编码
1667043
自动驾驶巴士市场机会、成长动力、产业趋势分析及 2025 - 2034 年预测Autonomous Bus Market Opportunity, Growth Drivers, Industry Trend Analysis, and Forecast 2025 - 2034 |
||||||
2024 年全球自动驾驶公车市场价值为 21 亿美元,预计在 2025 年至 2034 年期间将实现 18.9% 的显着复合年增长率,这得益于对高效和可持续公共交通解决方案的需求不断增长。随着世界各国政府优先考虑智慧城市计画以缓解交通拥堵和减少碳排放,自动驾驶公车的采用已获得广泛关注。这些无人驾驶汽车代表了城市交通的关键进步,透过优化路线效率、降低营运成本和提高安全性为公共交通提供了创新方法。
快速的城市化加上大都会人口密度的不断上升,进一步增加了对先进交通解决方案的需求。配备尖端技术的自动驾驶公车正在透过与智慧交通管理系统无缝整合来改变传统的交通系统,以改善连接性,最大限度地减少延误并确保更顺畅的通勤体验。人们越来越关注减少温室气体排放和对化石燃料的依赖,也促使交通运输机构采用这些环保替代品,进一步推动市场成长。
| 市场范围 | |
|---|---|
| 起始年份 | 2024 |
| 预测年份 | 2025-2034 |
| 起始值 | 21亿美元 |
| 预测值 | 124亿美元 |
| 复合年增长率 | 18.9% |
市场分为 1 级、2 级、3 级和 4 级自动化,每个级别都提供不同程度的自动化。 2024 年,1 级自动化占据了 40% 的主导市场份额,预计到 2034 年先进驾驶辅助系统创造 40 亿美元的市场价值。这些功能无需进行重大的基础设施升级即可提高安全性和营运效率,使其成为广泛部署的有吸引力的选择。
就车辆类型而言,市场分为柴油、电动和混合动力公车,其中电动公车将占据主导地位,到 2024 年将占据 65% 的份额。在全球环境法规和电池技术进步的支持下,电动公车现在具有更大的续航里程、更高的效率和更实惠的价格,成为城市和区域交通网络的首选解决方案。
2024 年,美国自动驾驶公车市场占有率高达 90%,预计到 2034 年将达到 30 亿美元。美国完善的基础设施和自动驾驶汽车测试的支持政策为在城市和郊区部署自动驾驶公车创造了有利的环境,巩固了美国作为这一转型市场的领先地位。
目录
第 1 章:方法论与范围
- 研究设计
- 研究方法
- 资料收集方法
- 基础估计和计算
- 基准年计算
- 市场估计的主要趋势
- 预测模型
- 初步研究与验证
- 主要来源
- 资料探勘来源
- 市场定义
第 2 章:执行摘要
第 3 章:产业洞察
- 产业生态系统分析
- 供应商概况
- 技术提供者
- 服务提供者
- 经销商
- 最终用途
- 利润率分析
- 定价分析
- 成本明细
- 技术与创新格局
- 重要新闻及倡议
- 监管格局
- 衝击力
- 成长动力
- 政府对智慧交通系统的倡议和资金
- 人工智慧和物联网的进步使安全高效的自主导航成为可能
- 推动自动驾驶电动公车发展的环保法规
- 为解决城市交通拥挤问题,对高效公共交通的需求日益增长
- 产业陷阱与挑战
- 自主技术开发与部署成本高
- 监管和安全问题阻碍了大规模采用
- 成长动力
- 成长潜力分析
- 波特的分析
- PESTEL 分析
第四章:竞争格局
- 介绍
- 公司市占率分析
- 竞争定位矩阵
- 战略展望矩阵
第五章:市场估计与预测:依自主性,2021 - 2034 年
- 主要趋势
- 1级
- 2 级
- 3 级
- 4 级
第六章:市场估计与预测:按燃料,2021 - 2034 年
- 主要趋势
- 柴油引擎
- 电的
- 杂交种
第 7 章:市场估计与预测:按应用,2021 - 2032 年
- 主要趋势
- 城际
- 城内
第 8 章:市场估计与预测:按地区,2021 - 2034 年
- 主要趋势
- 北美洲
- 我们
- 加拿大
- 欧洲
- 英国
- 德国
- 法国
- 西班牙
- 义大利
- 俄罗斯
- 北欧
- 亚太地区
- 中国
- 印度
- 日本
- 韩国
- 澳新银行
- 东南亚
- 拉丁美洲
- 巴西
- 墨西哥
- 阿根廷
- 中东及非洲
- 阿联酋
- 南非
- 沙乌地阿拉伯
第九章:公司简介
- 客车製造商
- AB Volvo
- Apollo Baidu
- BYD Co. Ltd.
- Easymile
- MAN Truck & Bus
- Daimler AG
- Navya
- New Flyer
- Toyotas Motor Corporation
- Yutong Group Co. Ltd.
- 自动驾驶解决方案提供商
- Continental AG
- Denso Corporation
- Robert Bosch GmbH
- SB Drive Corp
- ST Engineering
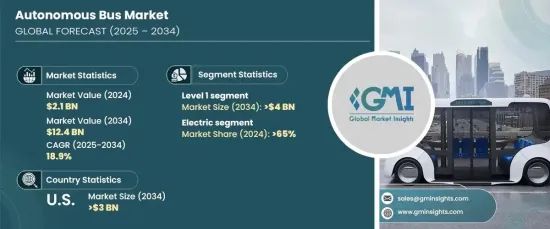
The Global Autonomous Bus Market was valued at USD 2.1 billion in 2024 and is expected to witness a remarkable CAGR of 18.9% from 2025 to 2034, driven by the increasing demand for efficient and sustainable public transportation solutions. With governments worldwide prioritizing smart city initiatives to mitigate traffic congestion and curb carbon emissions, the adoption of autonomous buses has gained substantial traction. These driverless vehicles represent a pivotal advancement in urban mobility, offering an innovative approach to public transit by optimizing route efficiency, reducing operational costs, and enhancing safety.
Rapid urbanization, coupled with rising population density in metropolitan areas, has further escalated the need for advanced transit solutions. Autonomous buses, equipped with cutting-edge technologies, are transforming traditional transportation systems by seamlessly integrating with smart traffic management systems to improve connectivity, minimize delays, and ensure a smoother commuting experience. The increasing focus on reducing greenhouse gas emissions and dependency on fossil fuels is also pushing transit agencies to adopt these eco-friendly alternatives, further driving market growth.
| Market Scope | |
|---|---|
| Start Year | 2024 |
| Forecast Year | 2025-2034 |
| Start Value | $2.1 Billion |
| Forecast Value | $12.4 Billion |
| CAGR | 18.9% |
The market is segmented into Level 1, Level 2, Level 3, and Level 4 autonomy, each offering varying degrees of automation. In 2024, Level 1 automation accounted for a dominant 40% market share and is projected to generate USD 4 billion by 2034. Level 1 autonomy, which includes advanced driver assistance systems like adaptive cruise control and lane-keeping assistance, has become a preferred choice for transit agencies due to its cost-effectiveness and seamless integration into existing vehicles. These features enhance safety and operational efficiency without requiring significant infrastructure upgrades, making them an attractive option for widespread deployment.
In terms of vehicle type, the market is categorized into diesel, electric, and hybrid buses, with electric buses leading the pack at a commanding 65% share in 2024. The adoption of electric buses has surged as governments and transit operators worldwide emphasize sustainability and carbon neutrality. Supported by global environmental regulations and advancements in battery technology, electric buses now offer improved range, efficiency, and affordability, making them the go-to solution for urban and regional transportation networks.
The United States autonomous bus market held an impressive 90% share in 2024 and is forecast to reach USD 3 billion by 2034. This growth is fueled by robust investments in research and development, combined with a strong commitment to technological innovation. The country's well-established infrastructure and supportive policies for autonomous vehicle testing have created a conducive environment for the deployment of autonomous buses in both urban and suburban areas, cementing the US as a leader in this transformative market.
Table of Contents
Chapter 1 Methodology & Scope
- 1.1 Research design
- 1.1.1 Research approach
- 1.1.2 Data collection methods
- 1.2 Base estimates and calculations
- 1.2.1 Base year calculation
- 1.2.2 Key trends for market estimates
- 1.3 Forecast model
- 1.4 Primary research & validation
- 1.4.1 Primary sources
- 1.4.2 Data mining sources
- 1.5 Market definitions
Chapter 2 Executive Summary
- 2.1 Industry 3600 synopsis, 2021 - 2034
Chapter 3 Industry Insights
- 3.1 Industry ecosystem analysis
- 3.2 Supplier landscape
- 3.2.1 Technology providers
- 3.2.2 Service providers
- 3.2.3 Distributors
- 3.2.4 End use
- 3.3 Profit margin analysis
- 3.4 Pricing analysis
- 3.5 Cost Breakdown
- 3.6 Technology & innovation landscape
- 3.7 Key news & initiatives
- 3.8 Regulatory landscape
- 3.9 Impact forces
- 3.9.1 Growth drivers
- 3.9.1.1 Government Initiatives and Funding for smart transportation systems
- 3.9.1.2 Advancements in AI and IoT enabling safe and efficient autonomous navigation
- 3.9.1.3 Environmental regulations promoting autonomous electric buses
- 3.9.1.4 Growing demand for efficient public transit to address urban congestion
- 3.9.2 Industry pitfalls & challenges
- 3.9.2.1 High development and deployment costs of autonomous technology
- 3.9.2.2 Regulatory and safety concerns delaying large-scale adoption
- 3.9.1 Growth drivers
- 3.10 Growth potential analysis
- 3.11 Porter’s analysis
- 3.12 PESTEL analysis
Chapter 4 Competitive Landscape, 2024
- 4.1 Introduction
- 4.2 Company market share analysis
- 4.3 Competitive positioning matrix
- 4.4 Strategic outlook matrix
Chapter 5 Market Estimates & Forecast, By Autonomy, 2021 - 2034 ($Bn, Units)
- 5.1 Key trends
- 5.2 Level 1
- 5.3 Level 2
- 5.4 Level 3
- 5.5 Level 4
Chapter 6 Market Estimates & Forecast, By Fuel, 2021 - 2034 ($Bn, Units)
- 6.1 Key trends
- 6.2 Diesel
- 6.3 Electric
- 6.4 Hybrid
Chapter 7 Market Estimates & Forecast, By Application, 2021 - 2032 ($Bn, Units)
- 7.1 Key trends
- 7.2 Intercity
- 7.3 Intracity
Chapter 8 Market Estimates & Forecast, By Region, 2021 - 2034 ($Bn, Units)
- 8.1 Key trends
- 8.2 North America
- 8.2.1 U.S.
- 8.2.2 Canada
- 8.3 Europe
- 8.3.1 UK
- 8.3.2 Germany
- 8.3.3 France
- 8.3.4 Spain
- 8.3.5 Italy
- 8.3.6 Russia
- 8.3.7 Nordics
- 8.4 Asia Pacific
- 8.4.1 China
- 8.4.2 India
- 8.4.3 Japan
- 8.4.4 South Korea
- 8.4.5 ANZ
- 8.4.6 Southeast Asia
- 8.5 Latin America
- 8.5.1 Brazil
- 8.5.2 Mexico
- 8.5.3 Argentina
- 8.6 MEA
- 8.6.1 UAE
- 8.6.2 South Africa
- 8.6.3 Saudi Arabia
Chapter 9 Company Profiles
- 9.1 Bus Manufacturers
- 9.1.1 AB Volvo
- 9.1.2 Apollo Baidu
- 9.1.3 BYD Co. Ltd.
- 9.1.4 Easymile
- 9.1.5 MAN Truck & Bus
- 9.1.6 Daimler AG
- 9.1.7 Navya
- 9.1.8 New Flyer
- 9.1.9 Toyotas Motor Corporation
- 9.1.10 Yutong Group Co. Ltd.
- 9.2 Autonomous driving solution providers
- 9.2.1 Continental AG
- 9.2.2 Denso Corporation
- 9.2.3 Robert Bosch GmbH
- 9.2.4 SB Drive Corp
- 9.2.5 ST Engineering


