


 |
市场调查报告书
商品编码
1667111
多平台钻井市场机会、成长动力、产业趋势分析与 2025 - 2034 年预测Multi Pad Drilling Market Opportunity, Growth Drivers, Industry Trend Analysis, and Forecast 2025 - 2034 |
||||||
2024 年全球多平台钻井市场价值为 779 亿美元,预计 2025 年至 2034 年期间将以 7.8% 的强劲复合年增长率增长。此外,市场还受益于技术进步,这些技术进步有助于降低钻井和基础设施成本,同时提高效率并最大限度地减少环境影响。政府旨在保护环境的法规以及鼓励勘探未开发储备的政策将进一步支持该行业的成长轨迹。
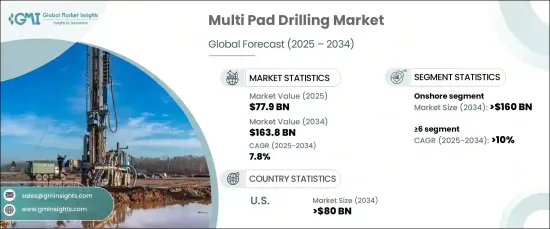
预计到 2034 年,陆上钻井产业的规模将超过 1,600 亿美元。技术创新和增强的勘探能力以及资源再开发的支持性监管框架预计将推动市场需求。采用多平台系统等先进钻井技术将在满足不断增长的能源需求、维持较低营运成本和优化开采过程方面发挥关键作用。
| 市场范围 | |
|---|---|
| 起始年份 | 2024 |
| 预测年份 | 2025-2034 |
| 起始值 | 779亿美元 |
| 预测值 | 1638亿美元 |
| 复合年增长率 | 7.8% |
预计到 2034 年,多平台钻井系统市场(特别是 >=6 细分市场)的复合年增长率将超过 10%。多平台钻井使操作员能够从单一位置挖掘多个碳氢化合物储层,从而提高钻井作业的效率和获利能力。对更大垫块配置的追求,以及对资源优化和尽量减少环境破坏的日益关注,将进一步推动该领域的市场扩张。
受页岩气和其他油气资源持续勘探和生产的推动,美国多平台钻井市场规模预计到 2034 年将达到 800 亿美元。预计各能源项目资本支出的增加将持续推动市场需求。为了维持生产和实现扩张目标而对石油基础设施进行的大量投资将对市场成长产生积极影响,特别是在海上钻井活动和常规资源可用性持续上升的情况下。
目录
第 1 章:方法论与范围
- 市场定义
- 基础估算与计算
- 预测计算
- 资料来源
- 基本的
- 次要
- 有薪资的
- 民众
第 2 章:执行摘要
第 3 章:产业洞察
- 产业生态系统分析
- 监管格局
- 产业衝击力
- 成长动力
- 产业陷阱与挑战
- 成长潜力分析
- 波特的分析
- 供应商的议价能力
- 买家的议价能力
- 新进入者的威胁
- 替代品的威胁
- PESTEL 分析
第四章:竞争格局
- 介绍
- 战略仪表板
- 创新与永续发展格局
第 5 章:市场规模及预测:按 Pad,2021 – 2034 年
- 主要趋势
- <6
- ≥6
第 6 章:市场规模与预测:按应用,2021 – 2034 年
- 主要趋势
- 陆上
- 海上
第 7 章:市场规模及预测:按地区,2021 – 2034 年
- 主要趋势
- 北美洲
- 我们
- 加拿大
- 墨西哥
- 欧洲
- 英国
- 俄罗斯
- 挪威
- 亚太地区
- 中国
- 印度
- 印尼
- 泰国
- 中东和非洲
- 沙乌地阿拉伯
- 阿联酋
- 卡达
- 奈及利亚
- 拉丁美洲
- 巴西
- 阿根廷
第八章:公司简介
- Baker Hughes
- Chevron
- ConocoPhillips
- Continental
- Devon
- ExxonMobil
- Halliburton
- Hess
- Nabors
- NOV
- Nostra Terra
- Petrofac
- Schlumberger
- Weatherford
The Global Multi Pad Drilling Market was valued at USD 77.9 billion in 2024 and is projected to expand at a robust CAGR of 7.8% from 2025 to 2034. This growth is primarily driven by the increased exploration and production of unconventional resources such as tight gas and shale oil, as well as the rising number of rigs being deployed. Additionally, the market is benefiting from technological advancements that help reduce drilling and infrastructure costs while improving efficiency and minimizing environmental impact. Government regulations aimed at protecting the environment, along with policies encouraging the exploration of untapped reserves, will further support the sector's growth trajectory.
The onshore drilling segment is expected to surpass USD 160 billion by 2034. This rise will be fueled by higher investment levels and the rich resource potential found in remote locations across various regions. Technological innovations and enhanced exploration capabilities, along with supportive regulatory frameworks for resource redevelopment, are expected to propel market demand. The adoption of advanced drilling techniques, such as multi-pad systems, will play a key role in meeting the rising demand for energy while keeping operational costs low and optimizing extraction processes.
| Market Scope | |
|---|---|
| Start Year | 2024 |
| Forecast Year | 2025-2034 |
| Start Value | $77.9 Billion |
| Forecast Value | $163.8 Billion |
| CAGR | 7.8% |
The market for multi-pad drilling systems, specifically in the >=6 segment, is forecasted to grow at a CAGR exceeding 10% through 2034. This surge is largely driven by extensive investments in offshore drilling, where significant capital is being allocated for oil and gas projects. Multi-pad drilling enables operators to tap into multiple hydrocarbon reservoirs from a single location, enhancing both the efficiency and profitability of drilling operations. The push for larger pad configurations, as well as a growing focus on resource optimization with minimal environmental disruption, will further drive market expansion in this segment.
The multi-pad drilling market in the U.S. is projected to reach USD 80 billion by 2034, spurred by the ongoing exploration and production of shale gas and other oil and gas resources. The increase in capital expenditure across various energy projects is expected to continue driving market demand. Significant investments in oil infrastructure to sustain production and achieve expansion goals will positively impact market growth, particularly as offshore drilling activities and conventional resource availability continue to rise.
Table of Contents
Chapter 1 Methodology & Scope
- 1.1 Market definitions
- 1.2 Base estimates & calculations
- 1.3 Forecast calculation
- 1.4 Data sources
- 1.4.1 Primary
- 1.4.2 Secondary
- 1.4.2.1 Paid
- 1.4.2.2 Public
Chapter 2 Executive Summary
- 2.1 Industry synopsis, 2021 - 2034
Chapter 3 Industry Insights
- 3.1 Industry ecosystem analysis
- 3.2 Regulatory landscape
- 3.3 Industry impact forces
- 3.3.1 Growth drivers
- 3.3.2 Industry pitfalls & challenges
- 3.4 Growth potential analysis
- 3.5 Porter's analysis
- 3.5.1 Bargaining power of suppliers
- 3.5.2 Bargaining power of buyers
- 3.5.3 Threat of new entrants
- 3.5.4 Threat of substitutes
- 3.6 PESTEL analysis
Chapter 4 Competitive Landscape, 2024
- 4.1 Introduction
- 4.2 Strategic dashboard
- 4.3 Innovation & sustainability landscape
Chapter 5 Market Size and Forecast, By Pad, 2021 – 2034 (USD Million)
- 5.1 Key trends
- 5.2 <6
- 5.3 ≥6
Chapter 6 Market Size and Forecast, By Application, 2021 – 2034 (USD Million)
- 6.1 Key trends
- 6.2 Onshore
- 6.3 Offshore
Chapter 7 Market Size and Forecast, By Region, 2021 – 2034 (USD Million)
- 7.1 Key trends
- 7.2 North America
- 7.2.1 U.S.
- 7.2.2 Canada
- 7.2.3 Mexico
- 7.3 Europe
- 7.3.1 UK
- 7.3.2 Russia
- 7.3.3 Norway
- 7.4 Asia Pacific
- 7.4.1 China
- 7.4.2 India
- 7.4.3 Indonesia
- 7.4.4 Thailand
- 7.5 Middle East & Africa
- 7.5.1 Saudi Arabia
- 7.5.2 UAE
- 7.5.3 Qatar
- 7.5.4 Nigeria
- 7.6 Latin America
- 7.6.1 Brazil
- 7.6.2 Argentina
Chapter 8 Company Profiles
- 8.1 Baker Hughes
- 8.2 Chevron
- 8.3 ConocoPhillips
- 8.4 Continental
- 8.5 Devon
- 8.6 ExxonMobil
- 8.7 Halliburton
- 8.8 Hess
- 8.9 Nabors
- 8.10 NOV
- 8.11 Nostra Terra
- 8.12 Petrofac
- 8.13 Schlumberger
- 8.14 Weatherford
 页岩压裂设备市场:依设备类型、驱动系统、压力范围及等级划分-全球预测,2026-2032年页岩破碎拖车市场:按拖车类型、流量、动力来源和终端用户产业划分 - 全球预测,2026-2032 年
 可降解防漏塞市场规模、份额和成长分析:按防漏塞类型、材质、应用、最终用户和地区划分-2026-2033年产业预测
 全球水力压裂市场规模、份额、趋势和成长分析报告(2026-2034年)
 2026年全球压裂砂和支撑剂市场报告2026年全球机械破碎拖车市场报告2026年全球页岩气加工设备市场报告
 油井增产材料市场-全球产业规模、份额、趋势、机会、预测:依技术、材料类型、地区和竞争格局划分,2021-2031年页岩气加工设备市场-全球产业规模、份额、趋势、机会、预测:按频率、应用、区域和竞争格局划分,2021-2031年
 水力压裂用中水的美国市场:市场趋势,机会,预测(2025年~2030年)