


 |
市场调查报告书
商品编码
1667154
LoRaWAN 市场机会、成长动力、产业趋势分析与 2025 - 2034 年预测LoRaWAN Market Opportunity, Growth Drivers, Industry Trend Analysis, and Forecast 2025 - 2034 |
||||||
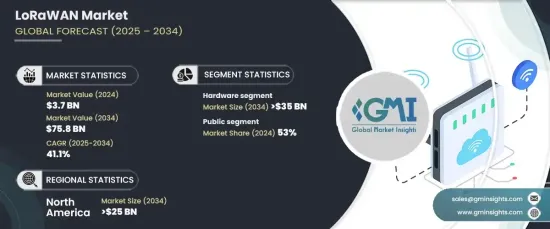
2024 年全球 LoRaWAN 市场价值为 37 亿美元,预计 2025 年至 2034 年期间的复合年增长率将达到惊人的 41.1%。这些城市发展对高效率、高速通讯的需求是市场扩张的关键驱动力。
LoRaWAN 技术的采用正在不断增加,因为它能够透过介质存取控制 (MAC) 协定支援远距离通讯。此外,其经济高效、节能的无线网路满足了对永续物联网 (IoT) 解决方案的需求。企业还将人工智慧和机器学习等先进的数位工具整合到支援LoRaWAN的网路中,以提高不同行业的营运效率和即时应用效能。
| 市场范围 | |
|---|---|
| 起始年份 | 2024 |
| 预测年份 | 2025-2034 |
| 起始值 | 37亿美元 |
| 预测值 | 758亿美元 |
| 复合年增长率 | 41.1% |
工业 4.0 趋势正在放大这一势头,利用互联设备之间的战略网络来简化低功耗广域网路上的流程。製造业和其他行业对数位化的日益重视增强了基于 LoRaWAN 的解决方案的采用,这些解决方案可优化生产效率和质量,同时实现无缝的机器对机器通讯。与蓝牙或 Zigbee 等传统无线技术不同,LoRaWAN 设备提供卓越的远距离连接,使其成为广域通讯的理想解决方案。
根据组件,市场分为硬体、软体和服务。 2024 年,硬体占据最大份额,贡献超过 45% 的市场。对物联网设备日益增长的需求和感测器技术的进步资料推动这一领域的发展,预计到 2034 年该领域的规模将超过 350 亿美元。
在部署方面,公共网路在2024年占据了53%的市场份额。电信营运商的支持和政府推动节能通讯解决方案的倡议进一步推动了其采用。
从地区来看,北美占据市场主导地位,2024 年的份额超过 30%,预计到 2034 年将达到 250 亿美元。 美国仍然是主要贡献者,这得益于广泛的物联网基础设施投资以及对低功耗、节能技术的关注。政府对物联网创新的大力支持持续推动各产业的市场成长。
目录
第 1 章:方法论与范围
- 研究设计
- 研究方法
- 资料收集方法
- 基础估计和计算
- 基准年计算
- 市场估计的主要趋势
- 预测模型
- 初步研究与验证
- 主要来源
- 资料探勘来源
- 市场定义
第 2 章:执行摘要
第 3 章:产业洞察
- 产业生态系统分析
- 供应商概况
- 晶片组製造商
- 模组製造商
- 设备製造商
- 网路营运商
- 解决方案提供者
- 最终用途
- 利润率分析
- LoRaWAN 与其他物联网协定(例如 NB-IoT、Sigfox)的比较
- LoRAWAN 用户
- 技术与创新格局
- 重要新闻及倡议
- 监管格局
- 衝击力
- 成长动力
- 增加对智慧城市的投资
- 工业4.0的渗透率不断提高
- 全球对远端无线连线的需求不断增加
- LoRa 网关和感测器在製造业的采用日益广泛
- LoRaWAN 在资产管理和智慧废弃物管理领域的应用日益广泛
- 产业陷阱与挑战
- 对资料安全的担忧日益增加
- 网路覆盖和品质
- 成长动力
- 成长潜力分析
- 波特的分析
- PESTEL 分析
第四章:竞争格局
- 介绍
- 公司市占率分析
- 竞争定位矩阵
- 战略展望矩阵
第五章:市场估计与预测:按组件,2021 - 2034 年
- 主要趋势
- 硬体
- 端节点
- 闸道
- 模组
- 软体
- 服务
- 一体化
- 维护
- 培训和咨询
第六章:市场估计与预测:依部署模型,2021 - 2034 年
- 主要趋势
- 私人的
- 民众
- 杂交种
第 7 章:市场估计与预测:按应用,2021 - 2034 年
- 主要趋势
- 智慧燃气和水计量
- 资产追踪
- 智慧建筑
- 智慧停车
- 精准农业
- 智慧废弃物管理
- 牲畜监控
- 其他的
第 8 章:市场估计与预测:按最终用途,2021 - 2034 年
- 主要趋势
- 卫生保健
- 农业
- 物流和运输
- 製造业
- 实用工具
- 消费性电子产品
- 政府和公共部门
- 其他的
第 9 章:市场估计与预测:按地区,2021 - 2034 年
- 主要趋势
- 北美洲
- 我们
- 加拿大
- 欧洲
- 英国
- 德国
- 法国
- 西班牙
- 义大利
- 俄罗斯
- 北欧
- 亚太地区
- 中国
- 印度
- 日本
- 韩国
- 澳新银行
- 东南亚
- 拉丁美洲
- 巴西
- 墨西哥
- 阿根廷
- 中东及非洲
- 阿联酋
- 南非
- 沙乌地阿拉伯
第十章:公司简介
- A2A Smart City
- Actility
- Adeunis
- Cisco System
- Everynet
- Helium
- Kerlink
- Kontron AG
- KPN
- LORIOT AG
- Meshed
- Microchip Technology
- National Narrowband Network Co. (NNNCo.)
- Orange
- OrbiWise
- Senet
- SMtech
- Swisscom AG
- TEKTELIC Communications
- Worldsensing
The Global LoRaWAN Market, valued at USD 3.7 billion in 2024, is anticipated to grow at an impressive CAGR of 41.1% from 2025 to 2034. This growth is fueled by increasing investments in smart city initiatives focused on advancing transportation, communication, energy, safety, and waste management systems. The need for efficient, high-speed communication in these urban developments is a critical driver of market expansion.
The adoption of LoRaWAN technology is rising due to its ability to support long-range communication through the Medium Access Control (MAC) protocol. In addition, its cost-effective and energy-efficient wireless networks address the demand for sustainable Internet of Things (IoT) solutions. Businesses are also integrating advanced digital tools such as artificial intelligence and machine learning into LoRaWAN-enabled networks to enhance operational efficiencies and real-time application performance across diverse industries.
| Market Scope | |
|---|---|
| Start Year | 2024 |
| Forecast Year | 2025-2034 |
| Start Value | $3.7 Billion |
| Forecast Value | $75.8 Billion |
| CAGR | 41.1% |
Industry 4.0 trends are amplifying this momentum, leveraging strategic networking among interconnected devices to streamline processes over low-power, wide-area networks. The growing emphasis on digitalization in manufacturing and other industries enhances the adoption of LoRaWAN-based solutions, which optimize production efficiency and quality while enabling seamless machine-to-machine communication. Unlike traditional wireless technologies like Bluetooth or Zigbee, LoRaWAN devices provide superior long-range connectivity, positioning them as the ideal solution for wide-area communications.
By component, the market is categorized into hardware, software, and services. Hardware held the largest share in 2024, contributing over 45% to the market. The increasing demand for IoT-enabled devices and advancements in sensor technology are driving this segment, which is forecasted to surpass USD 35 billion by 2034. Components like sensors, gateways, and modules are vital in facilitating efficient data transmission and enhancing network coverage.
In terms of deployment, public networks accounted for 53% of the market share in 2024. These networks are widely preferred for their scalability and cost advantages, particularly for IoT applications requiring broad coverage. Support from telecom operators and government initiatives promoting energy-efficient communication solutions further drives adoption.
Regionally, North America led the market with a share exceeding 30% in 2024 and is projected to reach USD 25 billion by 2034. The U.S. remains a key contributor, driven by extensive IoT infrastructure investments and a focus on low-power, energy-efficient technologies. Strong government support for IoT innovation continues to propel the market's growth across industries.
Table of Contents
Chapter 1 Methodology & Scope
- 1.1 Research design
- 1.1.1 Research approach
- 1.1.2 Data collection methods
- 1.2 Base estimates and calculations
- 1.2.1 Base year calculation
- 1.2.2 Key trends for market estimates
- 1.3 Forecast model
- 1.4 Primary research & validation
- 1.4.1 Primary sources
- 1.4.2 Data mining sources
- 1.5 Market definition
Chapter 2 Executive Summary
- 2.1 Industry 3600 synopsis, 2021 - 2034
Chapter 3 Industry Insights
- 3.1 Industry ecosystem analysis
- 3.2 Supplier landscape
- 3.2.1 Chipset manufacturers
- 3.2.2 Module manufacturers
- 3.2.3 Device manufacturers
- 3.2.4 Network operators
- 3.2.5 Solution providers
- 3.2.6 End Use
- 3.3 Profit margin analysis
- 3.4 Comparison of LoRaWAN with other IoT protocols (e.g., NB-IoT, Sigfox)
- 3.5 LoRAWAN subscribers
- 3.5.1 North America
- 3.5.2 Europe
- 3.5.3 Asia Pacific
- 3.5.4 Latin America
- 3.5.5 MEA
- 3.6 Technology & innovation landscape
- 3.7 Key news & initiatives
- 3.8 Regulatory landscape
- 3.9 Impact forces
- 3.9.1 Growth drivers
- 3.9.1.1 Increasing investments toward smart cities
- 3.9.1.2 Increasing penetration of Industry 4.0
- 3.9.1.3 Increasing demand for long-range wireless connectivity around the world
- 3.9.1.4 The growing adoption of LoRa gateways and sensors in the manufacturing industry
- 3.9.1.5 Growing adoption of LoRaWAN in asset management and smart waste management
- 3.9.2 Industry pitfalls & challenges
- 3.9.2.1 Increasing concerns related to data security
- 3.9.2.2 Network coverage and quality
- 3.9.1 Growth drivers
- 3.10 Growth potential analysis
- 3.11 Porter’s analysis
- 3.12 PESTEL analysis
Chapter 4 Competitive Landscape, 2024
- 4.1 Introduction
- 4.2 Company market share analysis
- 4.3 Competitive positioning matrix
- 4.4 Strategic outlook matrix
Chapter 5 Market Estimates & Forecast, By Component, 2021 - 2034 ($Bn)
- 5.1 Key trends
- 5.2 Hardware
- 5.2.1 End-node
- 5.2.2 Gateway
- 5.2.3 Module
- 5.3 Software
- 5.4 Services
- 5.4.1 Integration
- 5.4.2 Maintenance
- 5.4.3 Training and consulting
Chapter 6 Market Estimates & Forecast, By Deployment Model, 2021 - 2034 ($Bn)
- 6.1 Key trends
- 6.2 Private
- 6.3 Public
- 6.4 Hybrid
Chapter 7 Market Estimates & Forecast, By Application, 2021 - 2034 ($Bn)
- 7.1 Key trends
- 7.2 Smart gas and water metering
- 7.3 Asset tracking
- 7.4 Smart buildings
- 7.5 Smart parking
- 7.6 Precision agriculture
- 7.7 Smart waste management
- 7.8 Livestock monitoring
- 7.9 Others
Chapter 8 Market Estimates & Forecast, By End Use, 2021 - 2034 ($Bn)
- 8.1 Key trends
- 8.2 Healthcare
- 8.3 Agriculture
- 8.4 Logistics and transportation
- 8.5 Manufacturing
- 8.6 Utilities
- 8.7 Consumer electronics
- 8.8 Government and public sector
- 8.9 Others
Chapter 9 Market Estimates & Forecast, By Region, 2021 - 2034 ($Bn)
- 9.1 Key trends
- 9.2 North America
- 9.2.1 U.S.
- 9.2.2 Canada
- 9.3 Europe
- 9.3.1 UK
- 9.3.2 Germany
- 9.3.3 France
- 9.3.4 Spain
- 9.3.5 Italy
- 9.3.6 Russia
- 9.3.7 Nordics
- 9.4 Asia Pacific
- 9.4.1 China
- 9.4.2 India
- 9.4.3 Japan
- 9.4.4 South Korea
- 9.4.5 ANZ
- 9.4.6 Southeast Asia
- 9.5 Latin America
- 9.5.1 Brazil
- 9.5.2 Mexico
- 9.5.3 Argentina
- 9.6 MEA
- 9.6.1 UAE
- 9.6.2 South Africa
- 9.6.3 Saudi Arabia
Chapter 10 Company Profiles
- 10.1 A2A Smart City
- 10.2 Actility
- 10.3 Adeunis
- 10.4 Cisco System
- 10.5 Everynet
- 10.6 Helium
- 10.7 Kerlink
- 10.8 Kontron AG
- 10.9 KPN
- 10.10 LORIOT AG
- 10.11 Meshed
- 10.12 Microchip Technology
- 10.13 National Narrowband Network Co. (NNNCo.)
- 10.14 Orange
- 10.15 OrbiWise
- 10.16 Senet
- 10.17 SMtech
- 10.18 Swisscom AG
- 10.19 TEKTELIC Communications
- 10.20 Worldsensing
 LoRa 和 LoRaWAN 物联网市场:按技术、部署模式、网路结构、频段、应用和最终用户划分——2026 年至 2032 年全球市场预测
 2026年全球低功率广域网路(LPWAN)市场报告LoRaWAN转换器市场按应用、产品类型、网路类型、频率和组件划分,全球预测,2026-2032年
 LoRa 和 LoRaWAN 物联网市场分析及预测(至 2035 年):按类型、产品类型、服务、技术、应用、组件、部署类型、最终用户、功能和解决方案划分LoRa网关市场分析及预测(至2035年):按类型、产品类型、服务、技术、组件、应用、部署类型、最终用户、功能和安装类型划分低功率广域网路(LPWAN) 市场分析及至 2035 年预测:按类型、技术、应用、元件、服务、部署、最终用户和解决方案划分
 LoRa网关市场 - 全球产业规模、份额、趋势、机会和预测:连接性、应用、终端用户产业、地区和竞争格局,2021-2031年LoRa无线资料传输终端市场按产品类型、频段、网路部署、应用和最终用户产业划分,全球预测,2026-2032年LoRa无线资料终端市场:按产品类型、部署类型、连接类型、应用和最终用户产业分類的市场,全球预测,2026-2032年低功耗广域网路(LPWA)模组市场按技术、模组类型、频率、最终用途、应用和部署类型划分-2026年至2032年全球预测