


 |
市场调查报告书
商品编码
1684581
软性饮料包装市场机会、成长动力、产业趋势分析与预测 2025-2034Soft Drinks Packaging Market Opportunity, Growth Drivers, Industry Trend Analysis, and Forecast 2025-2034 |
||||||
2024 年全球软性饮料包装市场规模达到 870 亿美元,预计 2025 年至 2034 年期间的复合年增长率为 3.4%。随着人们对环境议题的认知不断提高,品牌和消费者都开始倾向于使用环保包装替代品,这标誌着产业的变革性转变。在这些替代品中,纸质包装正逐渐成为领先者,由于其可回收性和减少环境影响,成为塑胶的可行替代品。随着全球减少浪费的倡议日益受到关注,纸质包装预计将在未来十年的市场扩张中发挥关键作用。此外,技术进步和创新的包装设计为品牌创造了新的机会,使其能够提升市场吸引力,同时保持对永续发展的承诺。
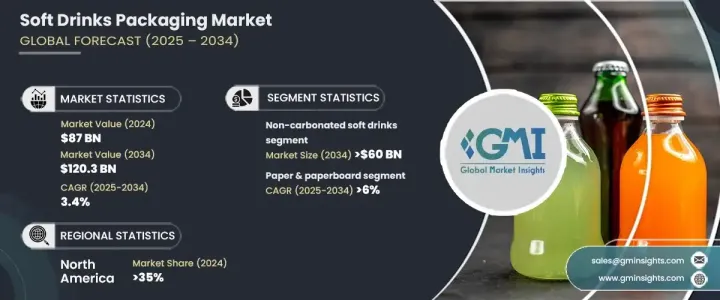
市场按饮料类型分为碳酸软性饮料和非碳酸软性饮料。随着人们对更健康、更天然饮料的需求不断增长,非碳酸软性饮料市场预计到 2034 年将创造 600 亿美元。非碳酸饮料,如果汁、冰茶、瓶装水和运动饮料,被视为碳酸软性饮料的较佳替代品,因为碳酸软性饮料通常含有高糖分和人工成分。消费者转向天然和健康饮料正在重塑市场格局,进一步推动对创新和永续包装解决方案的需求。
| 市场范围 | |
|---|---|
| 起始年份 | 2024 |
| 预测年份 | 2025-2034 |
| 起始值 | 870亿美元 |
| 预测值 | 1203亿美元 |
| 复合年增长率 | 3.4% |
按材料划分,市场涵盖玻璃、金属、纸和纸板、塑胶和其他材料。 2025 年至 2034 年间,纸和纸板产业预计将以 6% 的强劲复合年增长率成长,成为成长最快的类别。对永续选择的需求正在加速从一次性塑胶向纸质解决方案的转变,纸质解决方案被视为可生物降解且对环境更负责。随着全球对塑胶废弃物的监管越来越严格以及环保意识的增强,越来越多的品牌选择纸质包装来满足消费者的期望和监管标准。
2024 年,北美将占据全球软性饮料包装市场的 35% 份额,美国将引领区域成长。美国市场的发展受到消费者对便利性和环保包装日益增长的偏好的推动。即饮饮料继续占据货架主导地位,促使製造商投资可回收和简约的包装设计。此外,严格的政府政策和消费者日益增强的可持续性意识迫使品牌采用更环保的做法,确保该领域的持续成长和创新。
目录
第 1 章:方法论与范围
- 市场范围和定义
- 基础估算与计算
- 预测计算
- 资料来源
- 基本的
- 次要
- 付费来源
- 公共资源
第 2 章:执行摘要
第 3 章:产业洞察
- 产业生态系统分析
- 影响价值链的因素
- 利润率分析
- 中断
- 未来展望
- 製造商
- 经销商
- 重要新闻及倡议
- 监管格局
- 衝击力
- 成长动力
- 增加纸质包装的使用
- 消费者对永续性的需求不断增长
- 新兴市场的成长
- 功能性和优质饮料的创新
- 方便包装需求不断成长
- 产业陷阱与挑战
- 来自替代包装材料的竞争
- 原料成本上涨
- 成长动力
- 成长潜力分析
- 波特的分析
- PESTEL 分析
第四章:竞争格局
- 介绍
- 公司市占率分析
- 竞争定位矩阵
- 战略展望矩阵
第 5 章:市场估计与预测:按材料,2021 年至 2034 年
- 主要趋势
- 塑胶
- 玻璃
- 金属
- 纸和纸板
- 其他的
第 6 章:市场估计与预测:按产品类型,2021-2034 年
- 主要趋势
- 瓶子
- 罐头
- 纸箱
- 袋装
- 其他的
第 7 章:市场估计与预测:按产能,2021-2034 年
- 主要趋势
- 小包装(最多250毫升)
- 中包装(251毫升至1公升)
- 大包装(1公升以上)
第 8 章:市场估计与预测:按软性饮料类型,2021-2034 年
- 主要趋势
- 碳酸饮料
- 非碳酸软性饮料
第 9 章:市场估计与预测:按地区,2021 年至 2034 年
- 主要趋势
- 北美洲
- 我们
- 加拿大
- 欧洲
- 英国
- 德国
- 法国
- 义大利
- 西班牙
- 俄罗斯
- 亚太地区
- 中国
- 印度
- 日本
- 韩国
- 澳洲
- 拉丁美洲
- 巴西
- 墨西哥
- 中东及非洲
- 南非
- 沙乌地阿拉伯
- 阿联酋
第十章:公司简介
- Amcor
- AptarGroup
- Ardagh Group
- Ball Corporation
- Berry Global Group
- CAN-PACK
- CPMC Holdings
- Crown Holdings
- Graham Packaging
- Graphic Packaging International
- Novelis
- Plastipak Holdings
- SIG
- Silgan Holdings
- Smurfit Kappa
- Tetra Pak
- Visy Industries
- WestRock
The Global Soft Drinks Packaging Market reached USD 87 billion in 2024 and is projected to grow at a CAGR of 3.4% from 2025 to 2034. This steady growth reflects the sector's dynamic response to shifting consumer preferences and regulatory pressures, particularly the heightened demand for sustainable packaging solutions. As awareness of environmental issues rises, brands and consumers alike are gravitating towards eco-friendly packaging alternatives, signaling a transformative shift in the industry. Among these alternatives, paper-based packaging is emerging as a frontrunner, offering a viable substitute for plastic due to its recyclability and reduced environmental footprint. With global initiatives aimed at minimizing waste gaining traction, the adoption of paper packaging is expected to play a pivotal role in the market's expansion over the next decade. Furthermore, technological advancements and innovative packaging designs are creating new opportunities for brands to enhance their market appeal while maintaining a commitment to sustainability.
The market is segmented by type of drink into carbonated soft drinks and non-carbonated soft drinks. The non-carbonated soft drinks segment is projected to generate USD 60 billion by 2034, driven by an increasing demand for healthier, more natural beverage options. Non-carbonated drinks, such as fruit juices, iced teas, bottled water, and sports drinks, are viewed as superior alternatives to carbonated soft drinks, which often contain high sugar content and artificial ingredients. This consumer shift towards natural and health-oriented beverages is reshaping the market landscape, further boosting the demand for innovative and sustainable packaging solutions.
| Market Scope | |
|---|---|
| Start Year | 2024 |
| Forecast Year | 2025-2034 |
| Start Value | $ 87 Billion |
| Forecast Value | $120.3 Billion |
| CAGR | 3.4% |
By material, the market encompasses glass, metal, paper and paperboard, plastic, and other materials. The paper and paperboard segment is poised to grow at a robust CAGR of 6% between 2025 and 2034, making it the fastest-growing category. The demand for sustainable options is accelerating the shift from single-use plastics to paper-based solutions, which are seen as biodegradable and more environmentally responsible. As global regulations tighten around plastic waste and environmental awareness intensifies, brands are increasingly opting for paper packaging to meet consumer expectations and regulatory standards.
In 2024, North America held a 35% share of the global soft drinks packaging market, with the United States spearheading regional growth. The US market is driven by rising consumer preferences for convenience and eco-friendly packaging. Ready-to-drink beverages continue to dominate the shelves, prompting manufacturers to invest in recyclable and minimalist packaging designs. Furthermore, stringent government policies and growing consumer consciousness about sustainability are compelling brands to adopt greener practices, ensuring continued growth and innovation in this segment.
Table of Contents
Chapter 1 Methodology & Scope
- 1.1 Market scope & definitions
- 1.2 Base estimates & calculations
- 1.3 Forecast calculations
- 1.4 Data sources
- 1.4.1 Primary
- 1.4.2 Secondary
- 1.4.2.1 Paid sources
- 1.4.2.2 Public sources
Chapter 2 Executive Summary
- 2.1 Industry synopsis, 2022-2034
Chapter 3 Industry Insights
- 3.1 Industry ecosystem analysis
- 3.1.1 Factor affecting the value chain
- 3.1.2 Profit margin analysis
- 3.1.3 Disruptions
- 3.1.4 Future outlook
- 3.1.5 Manufacturers
- 3.1.6 Distributors
- 3.2 Key news & initiatives
- 3.3 Regulatory landscape
- 3.4 Impact forces
- 3.4.1 Growth drivers
- 3.4.1.1 Increasing use of paper packaging
- 3.4.1.2 Rising consumer demand for sustainability
- 3.4.1.3 Growth of emerging markets
- 3.4.1.4 Innovation in functional and premium beverages
- 3.4.1.5 Increasing demand for convenience packaging
- 3.4.2 Industry pitfalls & challenges
- 3.4.2.1 Competition from alternative packaging materials
- 3.4.2.2 Rising raw material costs
- 3.4.1 Growth drivers
- 3.5 Growth potential analysis
- 3.6 Porter's analysis
- 3.7 PESTEL analysis
Chapter 4 Competitive Landscape, 2024
- 4.1 Introduction
- 4.2 Company market share analysis
- 4.3 Competitive positioning matrix
- 4.4 Strategic outlook matrix
Chapter 5 Market Estimates & Forecast, By Material, 2021-2034 (USD Billion & Kilo Tons)
- 5.1 Key trends
- 5.2 Plastic
- 5.3 Glass
- 5.4 Metal
- 5.5 Paper & paperboard
- 5.6 Others
Chapter 6 Market Estimates & Forecast, By Product Type, 2021-2034 (USD Billion & Kilo Tons)
- 6.1 Key trends
- 6.2 Bottles
- 6.3 Cans
- 6.4 Cartons
- 6.5 Pouches
- 6.6 Others
Chapter 7 Market Estimates & Forecast, By Capacity, 2021-2034 (USD Billion & Kilo Tons)
- 7.1 Key trends
- 7.2 Small packaging (Up to 250 ml)
- 7.3 Medium packaging (251 ml to 1 liter)
- 7.4 Large packaging (Above 1 liter)
Chapter 8 Market Estimates & Forecast, By Soft Drink Type, 2021-2034 (USD Billion & Kilo Tons)
- 8.1 Key trends
- 8.2 Carbonated soft drinks
- 8.3 Non-carbonated soft drinks
Chapter 9 Market Estimates & Forecast, By Region, 2021-2034 (USD Billion & Kilo Tons)
- 9.1 Key trends
- 9.2 North America
- 9.2.1 U.S.
- 9.2.2 Canada
- 9.3 Europe
- 9.3.1 UK
- 9.3.2 Germany
- 9.3.3 France
- 9.3.4 Italy
- 9.3.5 Spain
- 9.3.6 Russia
- 9.4 Asia Pacific
- 9.4.1 China
- 9.4.2 India
- 9.4.3 Japan
- 9.4.4 South Korea
- 9.4.5 Australia
- 9.5 Latin America
- 9.5.1 Brazil
- 9.5.2 Mexico
- 9.6 MEA
- 9.6.1 South Africa
- 9.6.2 Saudi Arabia
- 9.6.3 UAE
Chapter 10 Company Profiles
- 10.1 Amcor
- 10.2 AptarGroup
- 10.3 Ardagh Group
- 10.4 Ball Corporation
- 10.5 Berry Global Group
- 10.6 CAN-PACK
- 10.7 CPMC Holdings
- 10.8 Crown Holdings
- 10.9 Graham Packaging
- 10.10 Graphic Packaging International
- 10.11 Novelis
- 10.12 Plastipak Holdings
- 10.13 SIG
- 10.14 Silgan Holdings
- 10.15 Smurfit Kappa
- 10.16 Tetra Pak
- 10.17 Visy Industries
- 10.18 WestRock
 软性饮料包装市场-2026-2031年预测
 软性饮料包装市场(按包装材料、包装类型和最终用途行业)—2025-2032 年全球预测
 软性饮料包装:市场占有率分析、产业趋势与统计、成长预测(2025-2030)中东和非洲软性饮料包装:市场占有率分析、产业趋势、成长预测(2025-2030)北美软性饮料包装:市场占有率分析、行业趋势和成长预测(2025-2030 年)拉丁美洲软性饮料包装:市场占有率分析、行业趋势和成长预测(2025-2030 年)欧洲软性饮料包装:市场占有率分析、产业趋势、成长预测(2025-2030)美国软性饮料包装:市场占有率分析、行业趋势和统计、成长预测(2025-2030 年)