


 |
市场调查报告书
商品编码
1684596
日期产品市场机会、成长动力、产业趋势分析与预测 2025 - 2034Date Product Market Opportunity, Growth Drivers, Industry Trend Analysis, and Forecast 2025 - 2034 |
||||||
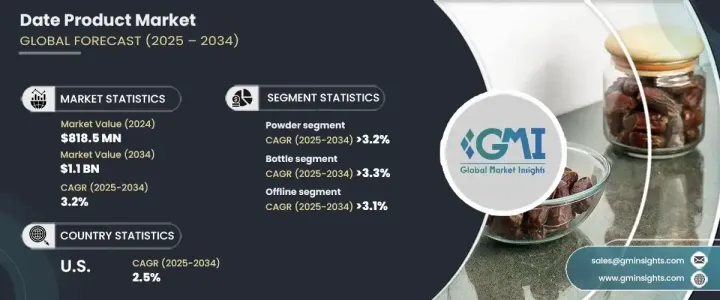
2024 年全球枣子产品市场价值为 8.185 亿美元,预计 2025 年至 2034 年期间将以 3.2% 的复合年增长率稳步增长。随着对清洁标籤、有机成分的需求不断增加,枣糊、糖浆和枣粉等枣子产品作为精製糖的天然替代品,用途广泛,越来越受欢迎。
随着消费者健康意识的增强,他们意识到枣的许多健康益处,从而推动了市场扩张。枣不仅富含纤维,而且还具有抗氧化特性并有助于消化,这使其成为寻求营养食品的人们的一个有吸引力的选择。人们对植物性饮食和纯素食主义的兴趣日益浓厚,进一步推动了市场的发展,这两者都推动了对零食、饮料和糖果中枣类成分的需求。
| 市场范围 | |
|---|---|
| 起始年份 | 2024 |
| 预测年份 | 2025-2034 |
| 起始值 | 8.185亿美元 |
| 预测值 | 11亿美元 |
| 复合年增长率 | 3.2% |
除了健康趋势外,包装创新在提高椰枣产品的可及性方面也发挥关键作用。现代包装解决方案使消费者更方便地将基于枣的成分纳入日常饮食中,从而增强了其吸引力。随着越来越多的人寻求天然、未经加工的替代品,从保健健身到食品製造等各个行业对枣产品的需求持续增长。
仅枣粉部分,2024 年的价值就达到 3.272 亿美元,预计在整个预测期内的复合年增长率为 3.2%。枣粉越来越受到注重健康的人士的青睐,因为它是一种有益健康的天然甜味选择。枣粉富含维生素、纤维和抗氧化剂,正成为冰沙、蛋白质奶昔和能量棒的主要成分。清洁标籤趋势强调有机、最低限度加工的成分,进一步促进了该产品在寻求非基因改造替代品的消费者中的受欢迎程度的上升。
在包装方面,瓶装部分的市值在 2024 年为 3.696 亿美元,预计未来十年的复合年增长率为 3.3%。瓶装包装正迅速成为枣子产品的首选,尤其是枣子糖浆等液体产品。瓶装包装的便利性、易用性和卓越的保存性使其成为保持产品新鲜度和确保品质的高效解决方案。包装的透明度也使得消费者能够在购买前评估产品的完整性,进一步提升了其受欢迎程度。
2024 年,美国枣类产品市场规模达到 1.373 亿美元,预计到 2034 年复合年增长率将达到 2.5%。随着对高纤维和富含抗氧化剂产品的需求不断增加,以枣子为基础的成分正成为能量棒、冰沙和烘焙食品等以健康为中心的产品的常见成分。
目录
第 1 章:方法论与范围
- 市场范围和定义
- 基础估算与计算
- 预测计算
- 资料来源
- 基本的
- 次要
- 付费来源
- 公共资源
第 2 章:执行摘要
第 3 章:产业洞察
- 产业生态系统分析
- 影响价值链的因素
- 利润率分析
- 中断
- 未来展望
- 製造商
- 经销商
- 供应商概况
- 利润率分析
- 重要新闻及倡议
- 监管格局
- 衝击力
- 成长动力
- 对天然甜味剂的需求不断增加
- 消费者健康意识不断增强
- 植物性饮食和纯素饮食的流行
- 有机产品和清洁标籤产品的成长
- 产业陷阱与挑战
- 枣製品生产成本高
- 某些地区的认知度有限
- 成长动力
- 成长潜力分析
- 波特的分析
- PESTEL 分析
第四章:竞争格局
- 介绍
- 公司市占率分析
- 竞争定位矩阵
- 战略展望矩阵
第 5 章:市场估计与预测:按类型,2021 年至 2034 年
- 主要趋势
- 粉末
- 糖浆
- 贴上
- 其他的
第六章:市场估计与预测:依包装类型,2021-2034 年
- 主要趋势
- 小袋
- 管
- 瓶子
- 其他的
第 7 章:市场估计与预测:按配销通路,2021-2034 年
- 主要趋势
- 离线
- 便利商店
- 专卖店
- 超市/大卖场
- 其他的
- 在线的
- 品牌网站
- 电子商务平台
第 8 章:市场估计与预测:按地区,2021 年至 2034 年
- 主要趋势
- 北美洲
- 我们
- 加拿大
- 欧洲
- 英国
- 德国
- 法国
- 义大利
- 西班牙
- 俄罗斯
- 亚太地区
- 中国
- 印度
- 日本
- 韩国
- 澳洲
- 拉丁美洲
- 巴西
- 墨西哥
- 中东及非洲
- 南非
- 沙乌地阿拉伯
- 阿联酋
第九章:公司简介
- Al Barakah Dates Factory
- Al Foah
- Arat Company PJS
- Arava Dates
- Ario
- Atul Rajasthan Date Palm
- Barari Group
- Bateel International
- Bayara Saudi Arabia
- Emirates Dates
- GNS Pakistan
- Hadiklaim Date Growers Cooperative
The Global Date Product Market was valued at USD 818.5 million in 2024 and is projected to experience steady growth at a CAGR of 3.2% from 2025 to 2034. This growth is largely attributed to a shift in consumer preferences towards natural, healthy sweeteners and functional food options. With an increasing demand for clean-label, organic ingredients, date products such as paste, syrup, and powder are gaining popularity due to their versatility as natural alternatives to refined sugars.
As consumers become more health-conscious, their awareness of the numerous health benefits of dates has fueled market expansion. Dates are not only rich in fiber, but they also boast antioxidant properties and aid in digestion, making them an attractive option for those seeking nutritious food choices. The market is further driven by rising interest in plant-based diets and veganism, both of which have boosted demand for date-based ingredients in snacks, beverages, and confectionery.
| Market Scope | |
|---|---|
| Start Year | 2024 |
| Forecast Year | 2025-2034 |
| Start Value | $818.5 Million |
| Forecast Value | $1.1 Billion |
| CAGR | 3.2% |
In addition to health trends, innovations in packaging are playing a pivotal role in increasing the accessibility of date products. Modern packaging solutions make it more convenient for consumers to incorporate date-based ingredients into their daily diets, thus enhancing their appeal. As more people seek natural, unprocessed alternatives, the demand for date products continues to grow across various industries, from wellness and fitness to food manufacturing.
The date powder segment alone was valued at USD 327.2 million in 2024 and is projected to grow at a CAGR of 3.2% throughout the forecast period. Date powder is increasingly favored by health-conscious individuals as it provides a wholesome, natural sweetening option. Packed with vitamins, fiber, and antioxidants, date powder is becoming a staple ingredient in smoothies, protein shakes, and energy bars. The clean-label trend, which emphasizes organic, minimally processed ingredients, further contributes to the product's rise in popularity among consumers looking for non-GMO alternatives.
In terms of packaging, the bottle segment held a market value of USD 369.6 million in 2024 and is expected to expand at a CAGR of 3.3% over the next decade. Bottled packaging is rapidly becoming the preferred choice for date products, particularly for liquid offerings like date syrup. The convenience, ease of use, and superior preservation that bottle packaging offers make it a highly effective solution for maintaining product freshness and ensuring quality. The transparency of the packaging also allows consumers to assess the product's integrity before purchasing, further boosting its popularity.
The date product market in the U.S. reached USD 137.3 million in 2024 and is anticipated to grow at a CAGR of 2.5% through 2034. This is largely due to growing consumer preference for healthier, more natural alternatives to refined sugars. With increasing demand for high-fiber and antioxidant-rich products, date-based ingredients are becoming a common feature in health-focused offerings such as energy bars, smoothies, and baked goods.
Table of Contents
Chapter 1 Methodology & Scope
- 1.1 Market scope & definitions
- 1.2 Base estimates & calculations
- 1.3 Forecast calculations
- 1.4 Data sources
- 1.4.1 Primary
- 1.4.2 Secondary
- 1.4.2.1 Paid sources
- 1.4.2.2 Public sources
Chapter 2 Executive Summary
- 2.1 Industry synopsis, 2021-2034
Chapter 3 Industry Insights
- 3.1 Industry ecosystem analysis
- 3.1.1 Factor affecting the value chain
- 3.1.2 Profit margin analysis
- 3.1.3 Disruptions
- 3.1.4 Future outlook
- 3.1.5 Manufacturers
- 3.1.6 Distributors
- 3.2 Supplier landscape
- 3.3 Profit margin analysis
- 3.4 Key news & initiatives
- 3.5 Regulatory landscape
- 3.6 Impact forces
- 3.6.1 Growth drivers
- 3.6.1.1 Increasing demand for natural sweeteners
- 3.6.1.2 Rising health consciousness among consumers
- 3.6.1.3 Popularity of plant-based and vegan diets
- 3.6.1.4 Growth in organic and clean-label products
- 3.6.2 Industry pitfalls & challenges
- 3.6.2.1 High production costs of date products
- 3.6.2.2 Limited awareness in certain regions
- 3.6.1 Growth drivers
- 3.7 Growth potential analysis
- 3.8 Porter's analysis
- 3.9 PESTEL analysis
Chapter 4 Competitive Landscape, 2024
- 4.1 Introduction
- 4.2 Company market share analysis
- 4.3 Competitive positioning matrix
- 4.4 Strategic outlook matrix
Chapter 5 Market Estimates & Forecast, By Type, 2021-2034 (USD Million) (Tons)
- 5.1 Key trends
- 5.2 Powder
- 5.3 Syrup
- 5.4 Paste
- 5.5 Others
Chapter 6 Market Estimates & Forecast, By Packaging type, 2021-2034 (USD Million) (Tons)
- 6.1 Key trends
- 6.2 Pouch
- 6.3 Tubes
- 6.4 Bottles
- 6.5 Others
Chapter 7 Market Estimates & Forecast, By Distribution channel, 2021-2034 (USD Million) (Tons)
- 7.1 Key trends
- 7.2 Offline
- 7.2.1 Convenience store
- 7.2.2 Specialty stores
- 7.2.3 Supermarkets/hypermarkets
- 7.2.4 Others
- 7.3 Online
- 7.3.1 Brand websites
- 7.3.2 E-commerce platforms
Chapter 8 Market Estimates & Forecast, By Region, 2021-2034 (USD Million) (Tons)
- 8.1 Key trends
- 8.2 North America
- 8.2.1 U.S.
- 8.2.2 Canada
- 8.3 Europe
- 8.3.1 UK
- 8.3.2 Germany
- 8.3.3 France
- 8.3.4 Italy
- 8.3.5 Spain
- 8.3.6 Russia
- 8.4 Asia Pacific
- 8.4.1 China
- 8.4.2 India
- 8.4.3 Japan
- 8.4.4 South Korea
- 8.4.5 Australia
- 8.5 Latin America
- 8.5.1 Brazil
- 8.5.2 Mexico
- 8.6 MEA
- 8.6.1 South Africa
- 8.6.2 Saudi Arabia
- 8.6.3 UAE
Chapter 9 Company Profiles
- 9.1 Al Barakah Dates Factory
- 9.2 Al Foah
- 9.3 Arat Company PJS
- 9.4 Arava Dates
- 9.5 Ario
- 9.6 Atul Rajasthan Date Palm
- 9.7 Barari Group
- 9.8 Bateel International
- 9.9 Bayara Saudi Arabia
- 9.10 Emirates Dates
- 9.11 GNS Pakistan
- 9.12 Hadiklaim Date Growers Cooperative
