


 |
市场调查报告书
商品编码
1750322
枣椰树市场机会、成长动力、产业趋势分析及 2025 - 2034 年预测Date Palm Market Opportunity, Growth Drivers, Industry Trend Analysis, and Forecast 2025 - 2034 |
||||||
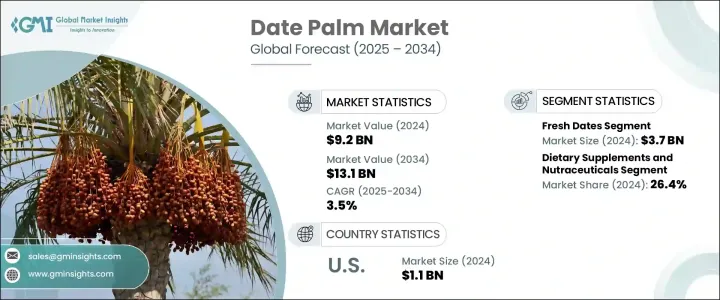
2024年,全球椰枣市场价值达92亿美元,预计2034年将以3.5%的复合年增长率成长,达到131亿美元。椰枣作为一种天然、营养丰富的食品,正日益受到人们的青睐。人们对椰枣健康益处的认识不断提高,以及对低加工天然甜味剂的需求不断增长,推动了全球椰枣消费。受可支配收入成长和农业技术改进带来的产量效率提升的推动,椰枣的产值和产量持续成长。
有利的气候条件以及不断扩大的种植规模,提升了主要产区的竞争力。灌溉系统的完善、政府的支持以及农艺实践的改进,有助于提高产量和品质,使生产者能够更有效率地满足日益增长的国际需求。同时,随着消费者偏好健康、功能性食品,全球消费领域正拓展至传统市场之外,北美、东亚和欧洲的消费市场也日益受到青睐。注重健康的消费者越来越青睐椰枣,因为它们天然甜度高、纤维含量高且具有抗氧化特性。随着植物基和清洁标籤趋势持续主导食品产业,椰枣不仅被视为零食,也成为能量棒、冰沙和保健产品的关键成分。这种消费模式的转变推动了主流和利基市场的稳定扩张。
| 市场范围 | |
|---|---|
| 起始年份 | 2024 |
| 预测年份 | 2025-2034 |
| 起始值 | 92亿美元 |
| 预测值 | 131亿美元 |
| 复合年增长率 | 3.5% |
2024年,鲜枣市场规模达37亿美元,预计2034年将以3.7%的复合年增长率成长。消费者对新鲜、未加工的枣子表现出强烈的偏好,因为它们富含天然纤维、抗氧化剂和天然糖。在节日和宗教节日期间,鲜枣的需求尤其旺盛,因为在这些节日和宗教节日期间,鲜枣在饮食中扮演着重要的角色。鲜枣吸引了注重健康的人士,他们寻求符合清洁饮食趋势的植物性零食。
2024年,营养保健品和膳食补充剂市场规模达25亿美元,预计到2034年将以3.4%的复合年增长率成长。椰枣粉、椰枣萃取物和椰枣糊等衍生物因其丰富的营养成分而被用于健康产品中。这些产品富含多酚、铁、钾和镁,因其增强免疫力、促进消化和支持代谢健康而备受青睐。椰枣衍生补充剂的清洁标籤和药用价值使其在预防性保健市场中极具吸引力。
2024年,美国枣椰树市场规模达11亿美元,并以惊人的速度扩张,预计2034年复合年增长率将达到6.9%。消费者需求的驱动力源于人们对健康饮食习惯的日益重视以及对永续农业日益增长的兴趣。政府的支持计画和农业措施使种植者能够降低生产成本,并投资于改良的种植技术,从而提高整体产量和市场反应能力。
全球椰枣产业的主要参与者包括 Phoenix Agrotech、Royal Palm Dates Group、Al Barakah Dates Factory LLC、Hadiklaim 和 Bard Valley Natural Delights。为了保持竞争力,领先的椰枣公司专注于多种策略,例如透过垂直整合来控製品质和供应,投资环保农业技术,以及实现产品线多元化,包括有机椰枣和能量棒等加值产品。他们也正在加强全球物流,扩大线上分销,并与健康品牌建立合作伙伴关係,以提高知名度。
目录
第一章:方法论与范围
第二章:执行摘要
第三章:行业洞察
- 产业生态系统分析
- 影响价值链的因素
- 利润率分析
- 中断
- 未来展望
- 製造商
- 经销商
- 川普政府关税
- 对贸易的影响
- 贸易量中断
- 报復措施
- 对产业的影响
- 供给侧影响(原料)
- 主要材料价格波动
- 供应链重组
- 生产成本影响
- 供给侧影响(原料)
- 需求面影响(售价)
- 价格传导至终端市场
- 市占率动态
- 消费者反应模式
- 受影响的主要公司
- 策略产业反应
- 供应链重组
- 定价和产品策略
- 政策参与
- 展望与未来考虑
- 对贸易的影响
- 贸易统计(HS编码)
- 2021-2024年主要出口国
- 2021-2024年主要进口国
3.3.3 註:以上贸易统计仅提供重点国家。
- 供应商格局
- 利润率分析
- 重要新闻和倡议
- 监管格局
- 全球监理框架
- FDA 法规(美国)
- EFSA法规(欧洲)
- FSSAI法规(印度)
- GCC标准化组织(GSO)
- 其他区域监管机构
- 品质标准和认证
- 食品法典标准
- ISO 日期标准
- 有机认证
- 良好农业规范(GAP)
- 良好生产规范 (GMP)
- 标籤和包装法规
- 进出口法规
- 食品安全和品质控制措施
- 监管挑战和合规策略
- 未来监理趋势及影响分析
- 全球监理框架
- 衝击力
- 成长动力
- 天然甜味剂和健康零食的需求不断增长
- 扩大非传统地区的种植
- 政府对农业基础建设的支持与投资
- 宗教和文化活动期间全球消费增加
- 产业陷阱与挑战
- 易受气候变迁和水资源短缺影响
- 由于储存和加工设施不足而造成的收穫后损失
- 成长动力
- 加工技术与製造
- 枣果加工概述
- 传统加工方法
- 现代加工技术
- 洗涤和清洁
- 分类和分级
- 干燥和脱水
- 去核并切碎
- 包装与保存
- 枣糖浆生产
- 提取方法
- 浓缩和精炼
- 品质控制和标准
- 枣泥、枣粉生产
- 製造过程
- 设备与技术
- 品质参数
- 加值加工
- 发酵技术
- 生物活性化合物的萃取
- 新颖的加工技术
- 包装创新与保质期延长
- 品质保证与食品安全体系
- 科技进步和未来趋势
- 供应链分析和分销管道
- 供应链结构
- 供应链中的关键利害关係人
- 农民和生产者
- 加工商和製造商
- 分销商和批发商
- 零售商和最终用户
- 分销管道
- 直销
- 超市和大卖场
- 专卖店
- 网路零售
- 传统市场
- 供应链挑战
- 收穫后损失
- 冷链基础设施
- 运输和物流
- 品质控制和可追溯性
- 供应链优化策略
- 垂直整合
- 协作方法
- 技术整合
- 永续供应链实践
- 电子商务与数位平台
- 枣椰树供应链管理的未来趋势
- 技术创新与研发
- 枣椰树种植的创新
- 精准农业和智慧农业
- 用于授粉和监测的无人机技术
- 物联网和人工智慧在枣农中的应用
- 基因改良和育种计划
- 气候智慧型农业实践
- 收穫技术的进步
- 机械化收穫设备
- 机器人和自动化系统
- 摇晃机和其他创新
- 加工和加值方面的创新
- 新型萃取技术
- 先进的干燥和保存方法
- 奈米科技应用
- 发酵和生物加工创新
- 包装创新
- 智慧主动包装
- 永续包装解决方案
- 气调包装(MAP)
- 保存期限延长技术
- 供应链管理中的数位技术
- 区块链用于可追溯性
- 巨量资料分析
- 电子商务和数位行销平台
- 专利格局和智慧财产权
- 研究机构与创新中心
- 未来科技趋势
- 枣椰树种植的创新
- 定价分析和成本结构
- 全球定价趋势
- 按品种进行价格点分析
- 按地区分析价格点
- 依产品类型进行价格点分析
- 影响定价的因素
- 生产成本
- 品质和等级
- 供需动态
- 季节变化
- 成本结构分析
- 种植和收穫成本
- 加工製造成本
- 包装和分销成本
- 行销和销售成本
- 跨价值链的利润分析
- 价格预测与未来趋势
- 成长潜力分析
- 波特的分析
- PESTEL分析
第四章:竞争格局
- 介绍
- 公司市占率分析
- 竞争定位矩阵
- 战略展望矩阵
- 投资机会和策略建议
- 给市场参与者的策略建议
- 对于生产者和农民
- 对于加工商和製造商
- 对于分销商和零售商
- 对于投资者和金融机构
- 对于政府和监管机构
- 市场进入策略
- 合资企业和合作伙伴关係
- 併购
- 许可和特许经营
- 直接投资
- 产品开发与创新策略
- 行销和品牌策略
- 风险评估和缓解策略
- 长期成长策略
- 给市场参与者的策略建议
第五章:市场估计与预测:依产品类型,2021-2034
- 主要趋势
- 鲜枣
- 干枣
- 枣糖浆
- 枣泥
- 枣粉
- 其他枣类产品
第六章:市场估计与预测:依性质,2021-2034
- 主要趋势
- 约定日期
- 有机枣
第七章:市场估计与预测:依形式,2021-2034
- 主要趋势
- 整个日期
- 切碎的红枣
- 去核红枣
- 日期件
第 8 章:市场估计与预测:按应用,2021 年至 2034 年
- 主要趋势
- 食品和饮料应用
- 烘焙和糖果
- 乳製品
- 小吃和酒吧
- 早餐麦片
- 饮料和饮品
- 其他食品应用
- 膳食补充品和营养保健品
- 营养补充品
- 功能性食品
- 运动营养
- 製药应用
- 传统医学
- 现代製药
- 化妆品和个人护理
- 保养产品
- 护髮产品
- 其他个人护理应用
- 动物饲料
- 牲畜饲料
- 宠物食品
- 工业应用
- 生物燃料生产
- 纺织业
- 其他工业用途
第九章:市场估计与预测:按地区,2021-2034
- 主要趋势
- 北美洲
- 我们
- 加拿大
- 欧洲
- 英国
- 德国
- 法国
- 义大利
- 西班牙
- 荷兰
- 亚太地区
- 中国
- 印度
- 日本
- 韩国
- 澳洲
- 拉丁美洲
- 巴西
- 墨西哥
- 阿根廷
- MEA
- 南非
- 沙乌地阿拉伯
- 阿联酋
第十章:公司简介
- Al Barakah Dates Factory LLC
- Al Wathba Marionnet
- Atul Rajasthan Date Palms
- Barari Group
- Bard Valley Natural Delights
- Barkaat Dates
- Emirates Dates
- GNS Pakistan
- Groundworks
- Haifa Datte
- Hadiklaim
- Kutch Crop Services Pvt. Ltd.
- Maghadi
- Phoenix Agrotech LLC
- Royal Palm Dates Group
- Vaidehi Foods Pvt. Ltd.
The Global Date Palm Market was valued at USD 9.2 billion in 2024 and is estimated to grow at a CAGR of 3.5% to reach USD 13.1 billion by 2034, driven by the benefits from the rising popularity of dates as a natural, nutrient-rich food choice. Increased awareness of their health benefits and the demand for minimally processed natural sweeteners have helped push consumption worldwide. Growth is consistent in value and volume, driven by rising disposable incomes and greater yield efficiency due to technological farming improvements.
Favorable climate conditions, along with expanding cultivation efforts, have made key producing regions more competitive. Enhanced irrigation systems, government support, and improved agronomic practices contribute to higher yields and better-quality harvests, allowing producers to meet rising international demand more efficiently. Meanwhile, global consumption is broadening beyond traditional markets, gaining traction in North America, East Asia, and Europe as consumer preferences lean toward wholesome, functional foods. Health-conscious consumers are increasingly drawn to dates for their natural sweetness, high fiber content, and antioxidant properties. As plant-based and clean-label trends continue to dominate the food industry, dates are being embraced not only as snacks but also as key ingredients in energy bars, smoothies, and wellness products. This shift in consumption patterns fuels steady market expansion across both mainstream and niche sectors.
| Market Scope | |
|---|---|
| Start Year | 2024 |
| Forecast Year | 2025-2034 |
| Start Value | $9.2 Billion |
| Forecast Value | $13.1 Billion |
| CAGR | 3.5% |
The fresh dates segment generated USD 3.7 billion in 2024 and is projected to grow at a CAGR of 3.7% through 2034. Consumers are showing a strong preference for fresh, unprocessed dates due to their naturally high fiber, antioxidants, and natural sugars. This demand is high during festive and religious seasons, where fresh dates play an essential dietary role. Fresh dates appeal to health-conscious individuals seeking plant-based snacks that align with clean eating trends.
The nutraceutical and dietary supplements segment was valued at USD 2.5 billion in 2024 and is expected to grow with a CAGR of 3.4% through 2034. Derivatives such as date powders, extracts, and pastes are used in health-oriented products due to their dense nutritional profile. Known for their high levels of polyphenols, iron, potassium, and magnesium, these products are favored for boosting immunity, aiding digestion, and supporting metabolic health. The clean label and medicinal appeal of date-derived supplements make them highly attractive in the preventive health market.
U.S. Date Palm Market was valued at USD 1.1 billion in 2024 and is expanding at an impressive pace with a CAGR of 6.9% projected through 2034. Consumer demand is driven by a growing awareness of healthy eating habits and an increasing interest in sustainable agriculture. Government support programs and agricultural initiatives enable growers to reduce production costs and invest in enhanced farming techniques, thus improving overall yield and market responsiveness.
The key players operating in the Global Date Palm Industry are Phoenix Agrotech, Royal Palm Dates Group, Al Barakah Dates Factory L.L.C, Hadiklaim, and Bard Valley Natural Delights. To stay competitive, leading date palm companies focus on strategies like vertical integration to control quality and supply, investing in eco-friendly farming technologies, and diversifying product lines to include value-added items like organic dates and energy bars. They are also strengthening global logistics, expanding online distribution, and forming partnerships with wellness brands to boost visibility.
Table of Contents
Chapter 1 Methodology & Scope
- 1.1 Market scope & definitions
- 1.2 Base estimates & calculations
- 1.3 Forecast calculations
- 1.4 Data sources
- 1.4.1 Primary
- 1.4.2 Secondary
- 1.4.2.1 Paid sources
- 1.4.2.2 Public sources
Chapter 2 Executive Summary
- 2.1 Industry synopsis, 2021-2034
Chapter 3 Industry Insights
- 3.1 Industry ecosystem analysis
- 3.1.1 Factor affecting the value chain
- 3.1.2 Profit margin analysis
- 3.1.3 Disruptions
- 3.1.4 Future outlook
- 3.1.5 Manufacturers
- 3.1.6 Distributors
- 3.2 Trump administration tariffs
- 3.2.1 Impact on trade
- 3.2.1.1 Trade volume disruptions
- 3.2.1.2 Retaliatory measures
- 3.2.2 Impact on the industry
- 3.2.2.1 Supply-side impact (raw materials)
- 3.2.2.1.1 Price volatility in key materials
- 3.2.2.1.2 Supply chain restructuring
- 3.2.2.1.3 Production cost implications
- 3.2.2.1 Supply-side impact (raw materials)
- 3.2.3 Demand-side impact (selling price)
- 3.2.3.1 Price transmission to end markets
- 3.2.3.2 Market share dynamics
- 3.2.3.3 Consumer response patterns
- 3.2.4 Key companies impacted
- 3.2.5 Strategic industry responses
- 3.2.5.1 Supply chain reconfiguration
- 3.2.5.2 Pricing and product strategies
- 3.2.5.3 Policy engagement
- 3.2.6 Outlook and future considerations
- 3.2.1 Impact on trade
- 3.3 Trade statistics (HS code)
- 3.3.1 Major exporting countries, 2021-2024 (kilo tons)
- 3.3.2 Major importing countries, 2021-2024 (kilo tons)
3.3.3 Note: the above trade statistics will be provided for key countries only.
- 3.4 Supplier landscape
- 3.5 Profit margin analysis
- 3.6 Key news & initiatives
- 3.7 Regulatory landscape
- 3.7.1 Global regulatory framework
- 3.7.1.1 FDA regulations (United States)
- 3.7.1.2 EFSA regulations (Europe)
- 3.7.1.3 FSSAI regulations (India)
- 3.7.1.4 GCC standardization organization (GSO)
- 3.7.1.5 Other regional regulatory bodies
- 3.7.2 Quality standards and certifications
- 3.7.2.1 Codex alimentarius standards
- 3.7.2.2 ISO standards for dates
- 3.7.2.3 Organic certifications
- 3.7.2.4 Good agricultural practices (GAP)
- 3.7.2.5 Good manufacturing practices (GMP)
- 3.7.3 Labeling and packaging regulations
- 3.7.4 Import-export regulations
- 3.7.5 Food safety and quality control measures
- 3.7.6 Regulatory challenges and compliance strategies
- 3.7.7 Future regulatory trends and impact analysis
- 3.7.1 Global regulatory framework
- 3.8 Impact forces
- 3.8.1 Growth drivers
- 3.8.1.1 Rising demand for natural sweeteners and healthy snacks
- 3.8.1.2 Expanding cultivation in non-traditional regions
- 3.8.1.3 Government support and investment in agricultural infrastructure
- 3.8.1.4 Increased global consumption during religious and cultural events
- 3.8.2 Industry pitfalls & challenges
- 3.8.2.1 Vulnerability to climate change and water scarcity
- 3.8.2.2 Post-harvest losses due to inadequate storage and processing facilities
- 3.8.1 Growth drivers
- 3.9 Processing technologies and manufacturing
- 3.9.1 Date fruit processing overview
- 3.9.2 Traditional processing methods
- 3.9.3 Modern processing technologies
- 3.9.3.1 Washing and cleaning
- 3.9.3.2 Sorting and grading
- 3.9.3.3 Drying and dehydration
- 3.9.3.4 Pitting and chopping
- 3.9.3.5 Packaging and preservation
- 3.9.4 Date syrup production
- 3.9.4.1 Extraction methods
- 3.9.4.2 Concentration and refining
- 3.9.4.3 Quality control and standards
- 3.9.5 Date paste and powder production
- 3.9.5.1 Manufacturing process
- 3.9.5.2 Equipment and technology
- 3.9.5.3 Quality parameters
- 3.9.6 Value-added processing
- 3.9.6.1 Fermentation technologies
- 3.9.6.2 Extraction of bioactive compounds
- 3.9.6.3 Novel processing techniques
- 3.9.7 Packaging innovations and shelf-life extension
- 3.9.8 Quality assurance and food safety systems
- 3.9.9 Technological advancements and future trends
- 3.10 Supply chain analysis and distribution channels
- 3.10.1 Supply chain structure
- 3.10.2 Key stakeholders in the supply chain
- 3.10.2.1 Farmers and producers
- 3.10.2.2 Processors and manufacturers
- 3.10.2.3 Distributors and wholesalers
- 3.10.2.4 Retailers and end-users
- 3.10.3 Distribution channels
- 3.10.3.1 Direct sales
- 3.10.3.2 Supermarkets and hypermarkets
- 3.10.3.3 Specialty stores
- 3.10.3.4 Online retail
- 3.10.3.5 Traditional markets
- 3.10.4 Supply chain challenges
- 3.10.4.1 Post-harvest losses
- 3.10.4.2 Cold chain infrastructure
- 3.10.4.3 Transportation and logistics
- 3.10.4.4 Quality control and traceability
- 3.10.5 Supply chain optimization strategies
- 3.10.5.1 Vertical integration
- 3.10.5.2 Collaborative approaches
- 3.10.5.3 Technology integration
- 3.10.5.4 Sustainable supply chain practices
- 3.10.6 E-commerce and digital platforms
- 3.10.7 Future trends in date palm supply chain management
- 3.11 Technological innovations and R&D
- 3.11.1 Innovations in date palm cultivation
- 3.11.1.1 Precision agriculture and smart farming
- 3.11.1.2 Drone technology for pollination and monitoring
- 3.11.1.3 IOT and AI applications in date farming
- 3.11.1.4 Genetic improvement and breeding programs
- 3.11.1.5 Climate-smart agricultural practices
- 3.11.2 Advancements in harvesting technologies
- 3.11.2.1 Mechanized harvesting equipment
- 3.11.2.2 Robotic and automated systems
- 3.11.2.3 Shaking machines and other innovations
- 3.11.3 Innovations in processing and value addition
- 3.11.3.1 Novel extraction technologies
- 3.11.3.2 Advanced drying and preservation methods
- 3.11.3.3 Nanotechnology applications
- 3.11.3.4 Fermentation and bioprocessing innovations
- 3.11.4 Packaging innovations
- 3.11.4.1 Smart and active packaging
- 3.11.4.2 Sustainable packaging solutions
- 3.11.4.3 Modified atmosphere packaging (MAP)
- 3.11.4.4 Shelf-life extension technologies
- 3.11.5 Digital technologies in supply chain management
- 3.11.5.1 Blockchain for traceability
- 3.11.5.2 Big data analytics
- 3.11.5.3 E-commerce and digital marketing platforms
- 3.11.6 Patent landscape and intellectual property
- 3.11.7 Research institutions and innovation hubs
- 3.11.8 Future technological trends
- 3.11.1 Innovations in date palm cultivation
- 3.12 Pricing analysis and cost structure
- 3.12.1 Global pricing trends
- 3.12.2 Price point analysis by variety
- 3.12.3 Price point analysis by region
- 3.12.4 Price point analysis by product type
- 3.12.5 Factors influencing pricing
- 3.12.5.1 Production costs
- 3.12.5.2 Quality and grade
- 3.12.5.3 Supply-demand dynamics
- 3.12.5.4 Seasonal variations
- 3.12.6 Cost structure analysis
- 3.12.6.1 Cultivation and harvesting costs
- 3.12.6.2 Processing and manufacturing costs
- 3.12.6.3 Packaging and distribution costs
- 3.12.6.4 Marketing and sales costs
- 3.12.7 Margin analysis across value chain
- 3.12.8 Price forecast and future trends
- 3.13 Growth potential analysis
- 3.14 Porter’s analysis
- 3.15 PESTEL analysis
Chapter 4 Competitive Landscape, 2024
- 4.1 Introduction
- 4.2 Company market share analysis
- 4.3 Competitive positioning matrix
- 4.4 Strategic outlook matrix
- 4.5 Investment opportunities and strategic recommendations
- 4.5.1 Strategic recommendations for market participants
- 4.5.1.1 For producers and farmers
- 4.5.1.2 For processors and manufacturers
- 4.5.1.3 For distributors and retailers
- 4.5.1.4 For investors and financial institutions
- 4.5.1.5 For government and regulatory bodies
- 4.5.2 Market entry strategies
- 4.5.2.1 Joint ventures and partnerships
- 4.5.2.2 Mergers and acquisitions
- 4.5.2.3 Licensing and franchising
- 4.5.2.4 Direct investment
- 4.5.3 Product development and innovation strategies
- 4.5.4 Marketing and branding strategies
- 4.5.5 Risk assessment and mitigation strategies
- 4.5.6 Long-term growth strategies
- 4.5.1 Strategic recommendations for market participants
Chapter 5 Market Estimates & Forecast, By Product Type, 2021-2034 (USD Billion) (Kilo Tons)
- 5.1 Key trends
- 5.2 Fresh dates
- 5.3 Dried dates
- 5.4 Date syrup
- 5.5 Date paste
- 5.6 Date powder
- 5.7 Other date products
Chapter 6 Market Estimates & Forecast, By Nature, 2021-2034 (USD Billion) (Kilo Tons)
- 6.1 Key trends
- 6.2 Conventional dates
- 6.3 Organic dates
Chapter 7 Market Estimates & Forecast, By Form, 2021-2034 (USD Billion) (Kilo Tons)
- 7.1 Key trends
- 7.2 Whole dates
- 7.3 Chopped dates
- 7.4 Pitted dates
- 7.5 Date pieces
Chapter 8 Market Estimates & Forecast, By Application, 2021-2034 (USD Billion) (Kilo Tons)
- 8.1 Key trends
- 8.2 Food and beverage applications
- 8.2.1 Bakery and confectionery
- 8.2.2 Dairy products
- 8.2.3 Snacks and bars
- 8.2.4 Breakfast cereals
- 8.2.5 Beverages and drinks
- 8.2.6 Other food applications
- 8.3 Dietary supplements and nutraceuticals
- 8.3.1 Nutritional supplements
- 8.3.2 Functional foods
- 8.3.3 Sports nutrition
- 8.4 Pharmaceutical applications
- 8.4.1 Traditional medicine
- 8.4.2 Modern pharmaceuticals
- 8.5 Cosmetics and personal care
- 8.5.1 Skincare products
- 8.5.2 Haircare products
- 8.5.3 Other personal care applications
- 8.6 Animal feed
- 8.6.1 Livestock feed
- 8.6.2 Pet food
- 8.7 Industrial applications
- 8.7.1 Biofuel production
- 8.7.2 Textile industry
- 8.7.3 Other industrial uses
Chapter 9 Market Estimates & Forecast, By Region, 2021-2034 (USD Billion) (Kilo Tons)
- 9.1 Key trends
- 9.2 North America
- 9.2.1 U.S.
- 9.2.2 Canada
- 9.3 Europe
- 9.3.1 UK
- 9.3.2 Germany
- 9.3.3 France
- 9.3.4 Italy
- 9.3.5 Spain
- 9.3.6 Netherlands
- 9.4 Asia Pacific
- 9.4.1 China
- 9.4.2 India
- 9.4.3 Japan
- 9.4.4 South Korea
- 9.4.5 Australia
- 9.5 Latin America
- 9.5.1 Brazil
- 9.5.2 Mexico
- 9.5.3 Argentina
- 9.6 MEA
- 9.6.1 South Africa
- 9.6.2 Saudi Arabia
- 9.6.3 UAE
Chapter 10 Company Profiles
- 10.1 Al Barakah Dates Factory L.L.C
- 10.2 Al Wathba Marionnet
- 10.3 Atul Rajasthan Date Palms
- 10.4 Barari Group
- 10.5 Bard Valley Natural Delights
- 10.6 Barkaat Dates
- 10.7 Emirates Dates
- 10.8 GNS Pakistan
- 10.9 Groundworks
- 10.10 Haifa Datte
- 10.11 Hadiklaim
- 10.12 Kutch Crop Services Pvt. Ltd.
- 10.13 Maghadi
- 10.14 Phoenix Agrotech LLC
- 10.15 Royal Palm Dates Group
- 10.16 Vaidehi Foods Pvt. Ltd.
