


 |
市场调查报告书
商品编码
1684599
乳化剂、稳定剂和增稠剂 (EST) 市场机会、成长动力、产业趋势分析和 2025 - 2034 年预测Emulsifiers, Stabilizers and Thickeners (ESTs) Market Opportunity, Growth Drivers, Industry Trend Analysis, and Forecast 2025 - 2034 |
||||||
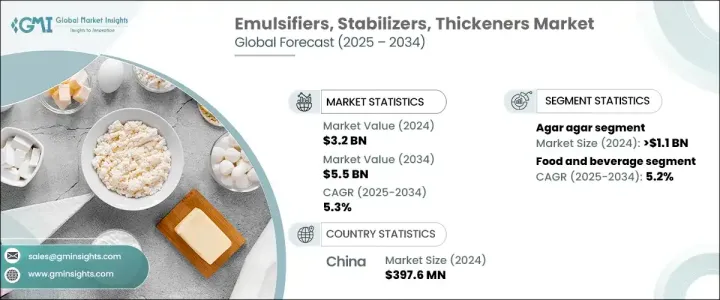
2024 年全球乳化剂、稳定剂和增稠剂市场价值为 32 亿美元,预计将经历强劲增长,2025 年至 2034 年的复合年增长率预计为 5.3%。 EST 市场持续成长可归因于消费者对高品质产品的需求不断增长,尤其是人们在日常消费品中寻求更多天然、功能性和清洁标籤的成分。
特别是食品业在推动市场成长方面发挥重要作用。随着对加工食品、方便食品和植物食品的需求不断增长,对乳化剂、稳定剂和增稠剂的需求也在增加,以确保这些产品所需的一致性和品质。向植物性饮食、有机成分和清洁标籤趋势的转变也促使更多製造商采用天然和可持续的 EST 解决方案。这些成分不仅被视为更环保,而且符合消费者对透明度和更健康选择日益增长的需求。
| 市场范围 | |
|---|---|
| 起始年份 | 2024 |
| 预测年份 | 2025-2034 |
| 起始值 | 32亿美元 |
| 预测值 | 55亿美元 |
| 复合年增长率 | 5.3% |
乳化剂、稳定剂和增稠剂市场的琼脂部分在 2024 年的价值达到 11 亿美元,预计在预测期内的复合年增长率为 5.4%。琼脂源自红藻,其天然的植物来源使其在各行业中越来越受欢迎。在食品领域,它被广泛用作素食配方、乳製品替代品和烘焙食品等产品的凝胶剂。然而,琼脂的多功能性不仅限于食品,由于其稳定性和质地特性,它在製药和化妆品领域也越来越受欢迎。
食品和饮料产业仍然是 EST 市场的最大贡献者,到 2024 年其价值将达到 22 亿美元,预计未来十年的成长率为 5.2%。乳化剂在改善乳製品、烘焙食品和饮料的质地和延长保质期方面发挥关键作用。稳定剂和增稠剂对于保持一致性同样重要,特别是在酱汁、调味酱和冷冻甜点中。随着消费者偏好不断向更健康和植物性食品发展,对创新、清洁标籤和天然 EST 解决方案的需求将推动产业进一步进步。
在中国,乳化剂、稳定剂和增稠剂 (EST) 市场在 2024 年创造了 3.976 亿美元的产值,预计 2025 年至 2034 年的复合年增长率为 5.8%。随着消费者对加工食品、方便食品和植物替代品的兴趣日益浓厚,中国市场将受益于国内和国际上青睐清洁标籤和永续成分的趋势。
目录
第 1 章:方法论与范围
- 市场范围和定义
- 基础估算与计算
- 预测计算
- 资料来源
- 基本的
- 次要
- 付费来源
- 公共资源
第 2 章:执行摘要
第 3 章:产业洞察
- 产业生态系统分析
- 影响价值链的因素
- 利润率分析
- 中断
- 未来展望
- 製造商
- 经销商
- 供应商格局
- 利润率分析
- 重要新闻及倡议
- 监管格局
- 衝击力
- 成长动力
- 加工食品需求不断成长
- 消费者对天然和有机产品的偏好日益增加
- 扩大植物性和纯素产品范围
- 化妆品和个人护理行业的成长
- 产业陷阱与挑战
- 消费者意识和透明度需求
- 监管障碍
- 成长动力
- 成长潜力分析
- 波特的分析
- PESTEL 分析
第四章:竞争格局
- 介绍
- 公司市占率分析
- 竞争定位矩阵
- 战略展望矩阵
第 5 章:市场估计与预测:按产品类型,2021-2034 年
- 主要趋势
- 琼脂
- 卡拉胶
- 果胶
- 玉米淀粉
- 黄原胶
- 瓜尔胶
- 葛
- 速效透明凝胶
- 其他的
第 6 章:市场估计与预测:按应用,2021 年至 2034 年
- 主要趋势
- 食品和饮料
- 药品和营养品
- 化妆品和个人护理
- 其他(例如工业应用)
第 7 章:市场估计与预测:按地区,2021 年至 2034 年
- 主要趋势
- 北美洲
- 我们
- 加拿大
- 欧洲
- 英国
- 德国
- 法国
- 义大利
- 西班牙
- 俄罗斯
- 亚太地区
- 中国
- 印度
- 日本
- 韩国
- 澳洲
- 拉丁美洲
- 巴西
- 墨西哥
- 中东及非洲
- 南非
- 沙乌地阿拉伯
- 阿联酋
第八章:公司简介
- Akzo Nobel NV
- Archer Daniels Midland Company
- BASF SE
- Cargill Incorporated
- Corbion NV
- DuPont Nutrition & Health
- Evonik Industries AG
- Kerry Inc.
- Koninklijke DSM NV
- Stepan Company
The Global Emulsifiers, Stabilizers And Thickeners Market, valued at USD 3.2 billion in 2024, is projected to experience robust growth, with an expected CAGR of 5.3% from 2025 to 2034. These essential additives are crucial in enhancing the texture, performance, and overall quality of products across various industries, including food, cosmetics, and pharmaceuticals. The consistent rise of the ESTs market can be attributed to the increasing consumer demand for higher-quality products, especially as people seek more natural, functional, and clean-label ingredients in their daily consumables.
In particular, the food industry plays a significant role in driving market growth. As demand for processed, convenience, and plant-based foods escalates, so does the need for emulsifiers, stabilizers, and thickeners that ensure the desired consistency and quality of these products. The shift toward plant-based diets, organic ingredients, and clean-label trends is also prompting more manufacturers to adopt natural and sustainable EST solutions. These ingredients are not only seen as more environmentally friendly but also align with the growing consumer desire for transparency and healthier options.
| Market Scope | |
|---|---|
| Start Year | 2024 |
| Forecast Year | 2025-2034 |
| Start Value | $3.2 Billion |
| Forecast Value | $5.5 Billion |
| CAGR | 5.3% |
The agar-agar segment within the emulsifiers, stabilizers, and thickeners market held a notable value of USD 1.1 billion in 2024 and is anticipated to grow at a CAGR of 5.4% during the forecast period. Derived from red algae, agar-agar's natural, plant-based origins have made it increasingly popular in various industries. In the food sector, it is widely used as a gelling agent in products like vegan formulations, dairy alternatives, and baked goods. The versatility of agar-agar extends beyond food, however, as it is also gaining traction in the pharmaceutical and cosmetics sectors due to its stabilizing and texturizing properties.
The food and beverage sector remains the largest contributor to the ESTs market, valued at USD 2.2 billion in 2024, with a projected growth rate of 5.2% over the next decade. Emulsifiers play a key role in improving the texture and prolonging the shelf life of dairy products, baked goods, and beverages. Stabilizers and thickeners are equally crucial in maintaining consistency, particularly in sauces, dressings, and frozen desserts. As consumer preferences continue to evolve toward healthier and plant-based foods, the demand for innovative, clean-label, and natural EST solutions will drive further industry advancements.
In China, the emulsifiers, stabilizers and thickeners (ESTs) market generated USD 397.6 million in 2024 and is projected to grow at a CAGR of 5.8% from 2025 to 2034. The expansion of the food and beverage, cosmetics, and pharmaceutical industries is fueling the demand for high-quality additives. With increasing consumer interest in processed foods, convenience items, and plant-based alternatives, China's market is set to benefit from both domestic and international trends favoring clean-label and sustainable ingredients.
Table of Contents
Chapter 1 Methodology & Scope
- 1.1 Market scope & definitions
- 1.2 Base estimates & calculations
- 1.3 Forecast calculations
- 1.4 Data sources
- 1.4.1 Primary
- 1.4.2 Secondary
- 1.4.2.1 Paid sources
- 1.4.2.2 Public sources
Chapter 2 Executive Summary
- 2.1 Industry synopsis, 2021-2034
Chapter 3 Industry Insights
- 3.1 Industry ecosystem analysis
- 3.1.1 Factor affecting the value chain
- 3.1.2 Profit margin analysis
- 3.1.3 Disruptions
- 3.1.4 Future outlook
- 3.1.5 Manufacturers
- 3.1.6 Distributors
- 3.2 Supplier landscape
- 3.3 Profit margin analysis
- 3.4 Key news & initiatives
- 3.5 Regulatory landscape
- 3.6 Impact forces
- 3.6.1 Growth drivers
- 3.6.1.1 Rising demand for processed foods
- 3.6.1.2 Growing consumer preference for natural and organic products
- 3.6.1.3 Expansion of plant-based and vegan products
- 3.6.1.4 Growth in the cosmetics and personal care industry
- 3.6.2 Industry pitfalls & challenges
- 3.6.2.1 Consumer awareness and demand for transparency
- 3.6.2.2 Regulatory hurdles
- 3.6.1 Growth drivers
- 3.7 Growth potential analysis
- 3.8 Porter's analysis
- 3.9 PESTEL analysis
Chapter 4 Competitive Landscape, 2024
- 4.1 Introduction
- 4.2 Company market share analysis
- 4.3 Competitive positioning matrix
- 4.4 Strategic outlook matrix
Chapter 5 Market Estimates & Forecast, By Product Type, 2021-2034 (USD Billion) (Kilo Tons)
- 5.1 Key trends
- 5.2 Agar Agar
- 5.3 Carrageen
- 5.4 Pectin
- 5.5 Corn starch
- 5.6 Xanthan gum
- 5.7 Guar gum
- 5.8 Arrowroot
- 5.9 Instant clear gel
- 5.10 Others
Chapter 6 Market Estimates & Forecast, By Application, 2021-2034 (USD Billion) (Kilo Tons)
- 6.1 Key trends
- 6.2 Food and beverage
- 6.3 Pharmaceutical and nutraceutical
- 6.4 Cosmetics and personal care
- 6.5 Others (e.g., industrial applications)
Chapter 7 Market Estimates & Forecast, By Region, 2021-2034 (USD Billion) (Kilo Tons)
- 7.1 Key trends
- 7.2 North America
- 7.2.1 U.S.
- 7.2.2 Canada
- 7.3 Europe
- 7.3.1 UK
- 7.3.2 Germany
- 7.3.3 France
- 7.3.4 Italy
- 7.3.5 Spain
- 7.3.6 Russia
- 7.4 Asia Pacific
- 7.4.1 China
- 7.4.2 India
- 7.4.3 Japan
- 7.4.4 South Korea
- 7.4.5 Australia
- 7.5 Latin America
- 7.5.1 Brazil
- 7.5.2 Mexico
- 7.6 MEA
- 7.6.1 South Africa
- 7.6.2 Saudi Arabia
- 7.6.3 UAE
Chapter 8 Company Profiles
- 8.1 Akzo Nobel N.V.
- 8.2 Archer Daniels Midland Company
- 8.3 BASF SE
- 8.4 Cargill Incorporated
- 8.5 Corbion N.V.
- 8.6 DuPont Nutrition & Health
- 8.7 Evonik Industries AG
- 8.8 Kerry Inc.
- 8.9 Koninklijke DSM N.V.
- 8.10 Stepan Company
 2026年全球乳化剂市场报告
 乳化剂市场-全球产业规模、份额、趋势、机会及预测(依原料、应用、区域及竞争格局划分,2021-2031年)
 乳化剂市场规模、份额和成长分析(按原料、产品类型、应用和地区划分)-2026-2033年产业预测
 2032年天然乳化剂市场预测:按来源、功能、形式、应用和地区分類的全球分析个人护理乳化剂市场-全球产业规模、份额、趋势、机会和预测(按产品、地区和竞争细分,2020-2030 年)
 个人护理乳化剂市场规模、份额和趋势分析报告:按产品、地区和细分市场预测,2025-2033 年
 全球乳化剂市场:市场规模、市场占有率、趋势、行业分析(按原材料、产品类型、应用和地区)、未来预测(2025-2034 年)
 乳化剂市场按来源、应用和地区划分
 2025 年至 2029 年全球化妆品乳化剂市场
 全球乳化剂市场:按原料、产品类型、应用、地区划分 - 到 2029 年的预测