


 |
市场调查报告书
商品编码
1684771
微型逆变器市场机会、成长动力、产业趋势分析及 2024 - 2032 年预测Micro Inverter Market Opportunity, Growth Drivers, Industry Trend Analysis, and Forecast 2024 - 2032 |
||||||
2023 年全球微型逆变器市场规模达 25 亿美元,预计 2024 年至 2032 年的复合年增长率为 11.3%。微型逆变器是太阳能发电系统中的关键组件,可将单一太阳能板产生的直流电转换为家庭和企业使用的交流电。与连接到整个太阳能板阵列的传统逆变器不同,微型逆变器安装在每个电池板上,从而实现最佳化能源生产。这种设计可以使面板面向不同方向或环境条件的系统获得更好的性能,使微型逆变器成为住宅和商业安装的首选。
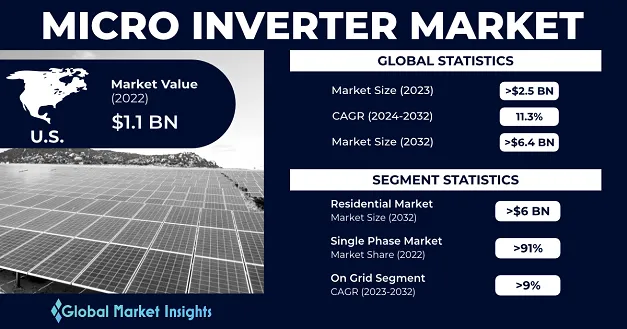
再生能源的日益普及,加上太阳能技术的进步,推动了微型逆变器的需求。它们能够提高能源效率、提高系统可靠性并提供即时监控,这使它们成为太阳能市场的关键解决方案。此外,对永续性的日益关注和政府对再生能源采用的激励措施进一步推动了市场成长。随着全球太阳能安装量持续上升,微型逆变器市场预计将在预测期内大幅扩张。
| 市场范围 | |
|---|---|
| 起始年份 | 2023 |
| 预测年份 | 2024-2032 |
| 起始值 | 25亿美元 |
| 预测值 | 64.8亿美元 |
| 复合年增长率 | 11.3% |
2022年,单相部分占据91%的市场。该领域的微型逆变器允许每个太阳能电池板独立运行,这不仅提高了能源效率,而且还能够即时监控单个电池板的性能。此功能可确保更快地侦测故障并提高整个系统的可靠性。单相微型逆变器还可在较低的直流电压下运行,从而提高安装和维护期间的安全性。这些特点使它们特别适合住宅和小规模商业应用,从而推动了它们在各个地区的广泛应用。
微型逆变器市场的住宅部分预计到 2032 年将创造 60 亿美元。微型逆变器系统的灵活性使其成为不同大小和方向的屋顶安装的理想选择,使房主可以自订他们的太阳能装置。这种适应性确保即使一个面板发生故障,各个面板仍能继续运行,从而增强了系统的可靠性和弹性。由于电力成本上涨和环境问题,人们对住宅太阳能装置的兴趣日益浓厚,这是推动该领域成长的主要因素。越来越多的房主将太阳能作为一种可持续且经济高效的解决方案,进一步推动了该领域对微型逆变器的需求。
2022 年美国微型逆变器市场产值将达到 11 亿美元,反映出太阳能作为减少电费和促进环境永续性的手段越来越受欢迎。微型逆变器的技术进步提高了其效率并降低了成本,使其能够被更广泛的受众所接受。政府激励措施和支持再生能源应用的政策也在推动市场发展方面发挥着至关重要的作用。随着住宅太阳能市场不断扩大,美国对微型逆变器解决方案的需求预计将大幅增长,以巩固该国作为全球市场主要参与者的地位。
目录
第 1 章:方法论与范围
- 市场范围和定义
- 市场估计和预测参数
- 研究原理
- 预测计算
- 资料来源
- 基本的
- 次要
- 有薪资的
- 民众
第 2 章:执行摘要
第 3 章:微型逆变器产业洞察
- 产业生态系统分析
- 供应商矩阵
- 监管格局
- 北美洲
- 我们
- 美国国家消防协会 (NFPA)
- UL 1741 标准
- IEEE 1547-2018
- IEC 62109 标准
- 联邦投资税收抵免(ITC)
- 加拿大
- 加拿大电气规范 (CEC)
- 我们
- 欧洲
- 德国
- VDE AR-N 4105
- BDEW 中压指令
- DIN VDE 0100-551
- 波兰
- 奥地利
- 英国
- 法国
- 德国
- 亚太地区
- 中国
- 澳洲
- AS/NZS 5033:2021
- 印度
- 日本
- 中东和非洲
- 埃及
- 拉丁美洲
- 巴西
- ICMS 会议 16/2015
- 智利
- 墨西哥
- 巴西
- 北美洲
- 产业衝击力
- 成长动力
- 提高产量和成本效益
- 对永续能源的监管倾向有利
- 对清洁能源持乐观态度
- 大规模再生能源併网
- 产业陷阱与挑战
- 辅助科技的可用性
- 成长动力
- 成长潜力分析
- 波特的分析
- PESTEL 分析
第 4 章:竞争性基准化分析
- 2022 年竞争格局
- 策略仪表板
- Enphase Energy
- Altenergy Power System Inc.
- Sensata Technologies, Inc.
- Solar Edge Technologies Inc
- Northern Electric Power Technology Inc.
- Sparq Systems
- SMA Solar Technology AG
- Hoymiles
- TSUNESS Co., Ltd.
- 策略仪表板
- 创新与永续发展格局
- FIMER 集团
- Enphase 能源
- 昱能电力系统股份有限公司
- 北方电力技术有限公司
- SMA 太阳能科技股公司
- Sparq 系统
- 霍伊迈尔斯
第 5 章:微型逆变器市场:依阶段
- 关键阶段趋势
- 单相
- 三相
第 6 章:微型逆变器市场:依连接性
- 关键连线趋势
- 独立
- 在电网上
第七章:微型逆变器市场:依应用
- 主要应用趋势
- 住宅
- 商业的
第 8 章:微型逆变器市场:按地区
- 主要区域趋势
- 北美洲
- 北美市场,2019 - 2032 年
- 2019 年至 2032 年北美市场分阶段状况
- 2019 年至 2032 年北美市场连结性状况
- 2019 年至 2032 年北美市场依应用划分
- 我们
- 美国市场,2019 - 2032 年
- 2019 年至 2032 年美国市场分阶段状况
- 2019 年至 2032 年美国连结市场状况
- 2019 年至 2032 年美国市场应用状况
- 加拿大
- 加拿大市场,2019 - 2032 年
- 2019 年至 2032 年加拿大市场分阶段状况
- 2019 年至 2032 年加拿大市场连通性状况
- 2019 年至 2032 年加拿大市场应用状况
- 欧洲
- 欧洲市场,2019 - 2032 年
- 2019 年至 2032 年欧洲市场分阶段状况
- 2019 年至 2032 年欧洲市场连通性状况
- 2019 年至 2032 年欧洲市场应用状况
- 德国
- 德国市场,2019 - 2032 年
- 2019 年至 2032 年德国市场分阶段状况
- 2019 年至 2032 年德国连通性市场状况
- 2019 年至 2032 年德国市场应用状况
- 义大利
- 义大利市场,2019 - 2032 年
- 2019 年至 2032 年义大利市场分阶段状况
- 2019 年至 2032 年义大利市场连通性状况
- 2019 年至 2032 年义大利市场应用状况
- 波兰
- 波兰市场,2019 - 2032 年
- 2019 年至 2032 年波兰市场分阶段状况
- 2019 年至 2032 年波兰市场连通性状况
- 2019 年至 2032 年波兰市场应用状况
- 荷兰
- 荷兰市场,2019 - 2032 年
- 2019 年至 2032 年荷兰市场分阶段状况
- 2019 年至 2032 年荷兰市场连通性状况
- 2019 年至 2032 年荷兰市场应用状况
- 奥地利
- 奥地利市场,2019 - 2032 年
- 2019 年至 2032 年奥地利市场分阶段状况
- 2019 年至 2032 年奥地利连通性市场状况
- 2019 年至 2032 年奥地利市场应用状况
- 英国
- 英国市场,2019 - 2032 年
- 2019 年至 2032 年英国市场分阶段状况
- 2019 年至 2032 年英国市场连通性状况
- 2019 年至 2032 年英国市场应用状况
- 法国
- 法国市场,2019 - 2032 年
- 2019 年至 2032 年法国市场分阶段状况
- 2019 年至 2032 年法国市场连通性状况
The Global Micro Inverter Market reached USD 2.5 billion in 2023 and is projected to grow at a CAGR of 11.3% from 2024 to 2032. Microinverters are critical components in solar power systems, converting DC generated by individual solar panels into AC for use in homes and businesses. Unlike traditional inverters that connect to an entire solar panel array, microinverters are installed on each panel, enabling optimized energy production. This design allows for better performance in systems where panels face varying orientations or environmental conditions, making microinverters a preferred choice for residential and commercial installations.
The growing adoption of renewable energy, coupled with advancements in solar technology, is driving the demand for microinverters. Their ability to enhance energy efficiency, improve system reliability, and provide real-time monitoring has positioned them as a key solution in the solar energy market. Additionally, the increasing focus on sustainability and government incentives for renewable energy adoption are further fueling market growth. As solar installations continue to rise globally, the micro inverter market is expected to witness significant expansion during the forecast period.
| Market Scope | |
|---|---|
| Start Year | 2023 |
| Forecast Year | 2024-2032 |
| Start Value | $2.5 Billion |
| Forecast Value | $6.48 Billion |
| CAGR | 11.3% |
In 2022, the single-phase segment accounted for 91% of the market share. Microinverters in this segment allow each solar panel to operate independently, which not only increases energy efficiency but also enables real-time monitoring of individual panel performance. This capability ensures quicker fault detection and enhances overall system reliability. Single-phase microinverters also operate at lower DC voltages, improving safety during installation and maintenance. These features make them particularly appealing for residential and small-scale commercial applications, driving their widespread adoption across various regions.
The residential segment of the micro inverter market is anticipated to generate USD 6 billion by 2032. The flexibility of microinverter systems makes them ideal for rooftop installations of different sizes and orientations, allowing homeowners to customize their solar setups. This adaptability ensures that individual panels can continue functioning even if one panel fails, enhancing the system's reliability and resilience. The growing interest in residential solar installations, driven by rising electricity costs and environmental concerns, is a major factor contributing to the segment's growth. Homeowners are increasingly turning to solar energy as a sustainable and cost-effective solution, further boosting the demand for micro inverters in this segment.
U.S. micro inverter market generated USD 1.1 billion in 2022, reflecting the increasing popularity of solar power as a means to reduce electricity bills and promote environmental sustainability. Technological advancements in microinverters have improved their efficiency and reduced costs, making them more accessible to a broader audience. Government incentives and policies supporting renewable energy adoption are also playing a crucial role in driving the market. As the residential solar market continues to expand, the demand for microinverter solutions in the United States is expected to grow significantly, solidifying the country's position as a key player in the global market.
Table of Contents
Chapter 1 Methodology & Scope
- 1.1 Market scope & definitions
- 1.2 Market estimates and forecast parameters
- 1.3 Research Rationale
- 1.4 Forecast calculations
- 1.5 Data sources
- 1.5.1 Primary
- 1.5.2 Secondary
- 1.5.2.1 Paid
- 1.5.2.2 Public
Chapter 2 Executive Summary
- 2.1 Micro inverter industry 3600 synopsis, 2019 - 2032
- 2.1.1 Business trends
- 2.1.2 Phase trends
- 2.1.3 Connectivity trends
- 2.1.4 Application trends
- 2.1.5 Regional trends
Chapter 3 Micro Inverter Industry Insights
- 3.1 Industry ecosystem analysis
- 3.1.1 Vendor Matrix
- 3.2 Regulatory landscape
- 3.2.1 North America
- 3.2.1.1 U.S.
- 3.2.1.1.1 National Fire Protection Association (NFPA)
- 3.2.1.1.2 UL 1741 Standard
- 3.2.1.1.3 IEEE 1547-2018
- 3.2.1.1.4 IEC 62109 Standard
- 3.2.1.1.5 Federal Investment Tax Credit (ITC)
- 3.2.1.2 Canada
- 3.2.1.2.1 Canadian Electrical Code (CEC)
- 3.2.1.1 U.S.
- 3.2.2 Europe
- 3.2.2.1 Germany
- 3.2.2.1.1 VDE AR-N 4105
- 3.2.2.1.2 BDEW Medium Voltage Directive
- 3.2.2.1.3 DIN VDE 0100-551
- 3.2.2.2 Poland
- 3.2.2.3 Austria
- 3.2.2.4 UK
- 3.2.2.5 France
- 3.2.2.1 Germany
- 3.2.3 Asia Pacific
- 3.2.3.1 China
- 3.2.3.2 Australia
- 3.2.3.2.1 AS/NZS 5033:2021
- 3.2.3.3 India
- 3.2.3.4 Japan
- 3.2.4 Middle East & Africa
- 3.2.4.1 Egypt
- 3.2.5 Latin America
- 3.2.5.1 Brazil
- 3.2.5.1.1 Convenio ICMS 16/2015
- 3.2.5.2 Chile
- 3.2.5.3 Mexico
- 3.2.5.1 Brazil
- 3.2.1 North America
- 3.3 Industry impact forces
- 3.3.1 Growth drivers
- 3.3.1.1 Higher output and cost-efficiency
- 3.3.1.2 Favorable regulatory inclination toward sustainable energy
- 3.3.1.3 Positive outlook toward clean energy
- 3.3.1.4 Large-scale renewable integration
- 3.3.2 Industry pitfalls & challenges
- 3.3.2.1 Availability of auxiliary technologies
- 3.3.1 Growth drivers
- 3.4 Growth potential analysis
- 3.5 Porter's Analysis
- 3.5.1 Bargaining power of suppliers
- 3.5.2 Bargaining power of buyers
- 3.5.3 Threat of new entrants
- 3.5.4 Threat of substitutes
- 3.6 PESTEL Analysis
Chapter 4 Competitive Benchmarking
- 4.1 Competitive landscape, 2022
- 4.1.1 Strategy dashboard
- 4.1.1.1 Enphase Energy
- 4.1.1.1.1 Product deployment
- 4.1.1.1.2 Business expansion
- 4.1.1.1.3 Partnership
- 4.1.1.1.4 Acquisition
- 4.1.1.2 Altenergy Power System Inc.
- 4.1.1.2.1 Agreement
- 4.1.1.2.2 Collaboration
- 4.1.1.3 Sensata Technologies, Inc.
- 4.1.1.3.1 Mergers & Acquisitions
- 4.1.1.4 Solar Edge Technologies Inc
- 4.1.1.4.1 Agreement
- 4.1.1.4.2 Partnership
- 4.1.1.5 Northern Electric Power Technology Inc.
- 4.1.1.5.1 Expansion
- 4.1.1.6 Sparq Systems
- 4.1.1.6.1 Product Development
- 4.1.1.6.2 Agreement
- 4.1.1.7 SMA Solar Technology AG
- 4.1.1.7.1 Supply Order
- 4.1.1.7.2 Market Expansion
- 4.1.1.7.3 Partnership
- 4.1.1.7.4 Agreement
- 4.1.1.8 Hoymiles
- 4.1.1.8.1 Product development
- 4.1.1.9 TSUNESS Co., Ltd.
- 4.1.1.9.1 Product development
- 4.1.1.1 Enphase Energy
- 4.1.1 Strategy dashboard
- 4.2 Innovation & sustainability landscape
- 4.2.1 FIMER Group
- 4.2.2 Enphase Energy
- 4.2.3 Altenergy Power System Inc.
- 4.2.4 Northern Electric Power Technology Inc.
- 4.2.5 SMA Solar Technology AG
- 4.2.6 Sparq Systems
- 4.2.7 Hoymiles
Chapter 5 Micro Inverter Market, By Phase
- 5.1 Key phase trends
- 5.2 Single phase
- 5.2.1 Global market from single phase, 2019 - 2032
- 5.2.2 Global market from single phase, by region, 2019 - 2032
- 5.3 Three phase
- 5.3.1 Global market from three phase, 2019 - 2032
- 5.3.2 Global market from three phase, by region, 2019 - 2032
Chapter 6 Micro Inverter Market, By Connectivity
- 6.1 Key connectivity trends
- 6.2 Standalone
- 6.2.1 Global market from standalone, 2019 - 2032
- 6.2.2 Global market from standalone, by region, 2019 - 2032
- 6.3 On grid
- 6.3.1 Global market from on grid, 2019 - 2032
- 6.3.2 Global market from on grid, by region, 2019 - 2032
Chapter 7 Micro Inverter Market, By Application
- 7.1 Key application trends
- 7.2 Residential
- 7.2.1 Global market from residential, 2019 - 2032
- 7.2.2 Global market from residential, by region, 2019 - 2032
- 7.3 Commercial
- 7.3.1 Global market from commercial, 2019 - 2032
- 7.3.2 Global market from commercial, by region, 2019 - 2032
Chapter 8 Micro Inverter Market, By Region
- 8.1 Key regional trends
- 8.2 North America
- 8.2.1 North America market, 2019 – 2032
- 8.2.2 North America market by phase, 2019 – 2032
- 8.2.3 North America market by connectivity, 2019 – 2032
- 8.2.4 North America market by application, 2019 – 2032
- 8.2.5 U.S.
- 8.2.5.1 U.S. market, 2019 – 2032
- 8.2.5.2 U.S. market by phase, 2019 – 2032
- 8.2.5.3 U.S. market by connectivity, 2019 – 2032
- 8.2.5.4 U.S. market by application, 2019 – 2032
- 8.2.6 Canada
- 8.2.6.1 Canada market, 2019 – 2032
- 8.2.6.2 Canada market by phase, 2019 – 2032
- 8.2.6.3 Canada market by connectivity, 2019 – 2032
- 8.2.6.4 Canada market by application, 2019 – 2032
- 8.3 Europe
- 8.3.1 Europe market, 2019 – 2032
- 8.3.2 Europe market by phase, 2019 – 2032
- 8.3.3 Europe market by connectivity, 2019 – 2032
- 8.3.4 Europe market by application, 2019 – 2032
- 8.3.5 Germany
- 8.3.5.1 Germany market, 2019 – 2032
- 8.3.5.2 Germany market by phase, 2019 – 2032
- 8.3.5.3 Germany market by connectivity, 2019 – 2032
- 8.3.5.4 Germany market by application, 2019 – 2032
- 8.3.6 Italy
- 8.3.6.1 Italy market, 2019 – 2032
- 8.3.6.2 Italy market by phase, 2019 – 2032
- 8.3.6.3 Italy market by connectivity, 2019 – 2032
- 8.3.6.4 Italy market by application, 2019 – 2032
- 8.3.7 Poland
- 8.3.7.1 Poland market, 2019 – 2032
- 8.3.7.2 Poland market by phase, 2019 – 2032
- 8.3.7.3 Poland market by connectivity, 2019 – 2032
- 8.3.7.4 Poland market by application, 2019 – 2032
- 8.3.8 Netherlands
- 8.3.8.1 Netherlands market, 2019 – 2032
- 8.3.8.2 Netherlands market by phase, 2019 – 2032
- 8.3.8.3 Netherlands market by connectivity, 2019 – 2032
- 8.3.8.4 Netherlands market by application, 2019 – 2032
- 8.3.9 Austria
- 8.3.9.1 Austria market, 2019 – 2032
- 8.3.9.2 Austria market by phase, 2019 – 2032
- 8.3.9.3 Austria market by connectivity, 2019 – 2032
- 8.3.9.4 Austria market by application, 2019 – 2032
- 8.3.10 UK
- 8.3.10.1 UK market, 2019 – 2032
- 8.3.10.2 UK market by phase, 2019 – 2032
- 8.3.10.3 UK market by connectivity, 2019 – 2032
- 8.3.10.4 UK market by application, 2019 – 2032
- 8.3.11 France
- 8.3.11.1 France market, 2019 – 2032
- 8.3.11.2 France market by phase, 2019 – 2032
- 8.3.11.3 France market by connectivity, 2019 – 2032
 微型逆变器市场规模、份额和成长分析(按产品、通讯技术、类型、额定功率、连接类型、销售管道、应用和地区)- 2025-2032 年产业预测
 2025 年微型逆变器全球市场报告
 微型逆变器:市场占有率分析、产业趋势与统计、成长预测(2025-2030 年)
 全球微型逆变器市场:按产品供应、按类型、按连接类型、按通讯技术、按额定功率、按分销管道、按应用 - 2025-2030 年预测
 到 2030 年微型逆变器市场预测:按类型、额定功率、连接性别、销售管道、技术、应用和地区进行全球分析
 单相户用微型逆变器市场机会、成长动力、产业趋势分析与 2024 年至 2032 年预测商用单相微型逆变器市场、机会、成长动力、产业趋势分析与预测,2024-2032商用三相微型逆变器市场、机会、成长动力、产业趋势分析与预测,2024-2032独立微型逆变器市场规模 - 按阶段(单相、三相)、按应用(住宅、商业)、按区域前景、应用潜力、竞争市场份额和预测,2024 年至 2032 年
 全球独立微型逆变器市场研究报告 - 2024 年至 2032 年产业分析、规模、份额、成长、趋势与预测