


 |
市场调查报告书
商品编码
1684858
逆向物流市场机会、成长动力、产业趋势分析与 2025 - 2034 年预测Reverse Logistics Market Opportunity, Growth Drivers, Industry Trend Analysis, and Forecast 2025 - 2034 |
||||||
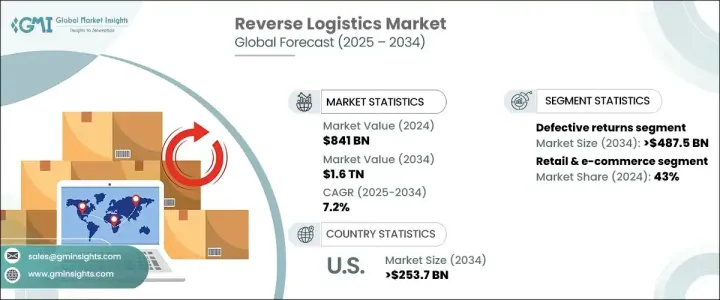
2024 年全球逆向物流市场价值为 8,410 亿美元,预计 2025 年至 2034 年的复合年增长率为 7.2%。这一成长主要得益于对环境永续性的日益关注以及对符合企业社会责任 (CSR) 目标的高效物流解决方案的需求不断增长。随着企业努力减少浪费、最大限度地减少对环境的影响并遵守严格的永续法规,逆向物流市场已成为处理退货的重要参与者。该行业在回收、翻新和负责任地处理产品方面发挥关键作用,帮助企业以经济高效和环保的方式管理退货。
受产品退货增加和无缝退货流程需求激增等因素的推动,逆向物流市场正在迅速发展。随着全球电子商务产业的蓬勃发展以及对线上购物的日益依赖,产品退货量急剧增加。公司正在增加对逆向物流基础设施的投资,以应对这种激增,同时也满足客户对灵活退货政策和提高满意度的期望。在这种背景下,逆向物流解决方案对于提高营运效率、降低成本、培养客户忠诚度以及最大限度地减少产品退货的碳足迹变得至关重要。
| 市场范围 | |
|---|---|
| 起始年份 | 2024 |
| 预测年份 | 2025-2034 |
| 起始值 | 8410亿美元 |
| 预测值 | 1.6兆美元 |
| 复合年增长率 | 7.2% |
2024 年,缺陷退货占据市场主导地位,占有 28% 的份额,价值 4,875 亿美元,预计到 2034 年仍将保持显着成长。这些退货主要是由于产品故障、损坏或性能故障所致,尤其是在高价值行业。电子、汽车和零售等行业的公司在管理这些退货时面临着巨大的挑战,因为他们必须专注于提高产品品质、减少损失并确保客户满意度。
以最终用户划分,逆向物流市场很大程度上受到製药、零售和电子商务、电子、汽车和製造业等关键产业的影响。其中,零售和电子商务领域在 2024 年占据领先地位,份额为 43%,这主要归因于线上购物格局的扩大和产品退货的增加。随着线上零售商采用灵活的退货政策,包括延长退货期限和免费退货运输,对高效逆向物流解决方案的需求预计将持续成长。
光是美国逆向物流市场在 2024 年就占了全球份额的 76%,到 2034 年将产生 2,537 亿美元的产值。这一增长得益于完善的电子商务生态系统、严格的监管合规要求以及物流技术的快速进步。随着企业努力提高效率并满足不断变化的客户期望,对优化退货流程和基础设施的需求持续增加。此外,强调永续性和对环境负责的退货处理的监管政策正在加速该行业采用绿色物流实践。
目录
第 1 章:方法论与范围
- 研究设计
- 研究方法
- 资料收集方法
- 基础估计和计算
- 基准年计算
- 市场估计的主要趋势
- 预测模型
- 初步研究与验证
- 主要来源
- 资料探勘来源
- 市场定义
第 2 章:执行摘要
第 3 章:产业洞察
- 产业生态系统分析
- 技术提供者
- 零件供应商
- 原始设备製造商
- 最终用户
- 供应商概况
- 利润率分析
- 技术与创新格局
- 重要新闻及倡议
- 监管格局
- 衝击力
- 成长动力
- 更加重视永续性
- 电子商务和产品退货的增加
- 成本效益和资源回收
- 技术进步
- 产业陷阱与挑战
- 营运成本高
- 退货管理的复杂性
- 成长动力
- 成长潜力分析
- 波特的分析
- PESTEL 分析
第四章:竞争格局
- 介绍
- 公司市占率分析
- 竞争定位矩阵
- 战略展望矩阵
第 5 章:市场估计与预测:按工艺,2021 - 2034 年
- 主要趋势
- 退货管理
- 再製造
- 回收利用
- 处理
- 其他的
第六章:市场估计与预测:按回报,2021 - 2034 年
- 主要趋势
- 缺陷退货
- 召回退货
- B2b 回报与商业回报
- 可修復的退货
- 生命终点回归
- 其他的
第 7 章:市场估计与预测:按服务供应商,2021 - 2034 年
- 主要趋势
- 内部逆向物流
- 第三方物流 (3PL) 供应商
- 回收公司
- 废弃物管理公司
第 8 章:市场估计与预测:按最终用途,2021 - 2034 年
- 主要趋势
- 零售与电子商务
- 电子产品
- 汽车
- 药品
- 製造业
- 其他的
第 9 章:市场估计与预测:按地区,2021 - 2034 年
- 主要趋势
- 北美洲
- 我们
- 加拿大
- 欧洲
- 英国
- 德国
- 法国
- 西班牙
- 义大利
- 俄罗斯
- 北欧
- 亚太地区
- 中国
- 印度
- 日本
- 韩国
- 澳新银行
- 东南亚
- 拉丁美洲
- 巴西
- 墨西哥
- 阿根廷
- 中东及非洲
- 阿联酋
- 南非
- 沙乌地阿拉伯
第十章:公司简介
- Deutsche Post DHL Group
- UPS
- FedEx
- XPO Logistics
- Ryder System, Inc.
- Maersk
- ReverseLogix
- CEVA Logistics
- DB Schenker
- Lineage Logistics
- Kuehne + Nagel
- Expeditors International
- Geodis
- CH Robinson
- Pitney Bowes
- Genco (now part of FedEx)
- Manhattan Associates
- Damco
- TTS Logistics
- Echo Global Logistics
The Global Reverse Logistics Market, valued at USD 841 billion in 2024, is on track to experience significant growth, with a projected CAGR of 7.2% from 2025 to 2034. This growth is largely fueled by the increasing focus on environmental sustainability and the rising demand for efficient logistics solutions that align with corporate social responsibility (CSR) goals. As businesses strive to reduce waste, minimize environmental impact, and comply with strict sustainability regulations, the reverse logistics market has emerged as a crucial player in handling returned goods. This sector plays a pivotal role in recycling, refurbishing, and responsibly disposing of products, helping companies manage returns in a cost-effective and environmentally friendly manner.
The reverse logistics market is rapidly evolving, driven by factors such as heightened product returns and a surge in demand for seamless return processes. With the global e-commerce sector booming and an increasing reliance on online shopping, the volume of product returns has skyrocketed. Companies are increasingly investing in reverse logistics infrastructure to manage this surge while also catering to customer expectations for flexible return policies and enhanced satisfaction. In this context, reverse logistics solutions are becoming essential for improving operational efficiency, reducing costs, and fostering customer loyalty, all while minimizing the carbon footprint of product returns.
| Market Scope | |
|---|---|
| Start Year | 2024 |
| Forecast Year | 2025-2034 |
| Start Value | $841 Billion |
| Forecast Value | $1.6 Trillion |
| CAGR | 7.2% |
In 2024, defective returns dominated the market, accounting for 28% of the share, valued at USD 487.5 billion, and expected to maintain significant growth through 2034. These returns are largely driven by product malfunctions, damage, or performance failures, particularly in high-value industries. Companies in sectors such as electronics, automotive, and retail face significant challenges when managing these returns, as they must focus on enhancing product quality, minimizing losses, and ensuring customer satisfaction.
By end-user, the reverse logistics market is largely influenced by key industries, including pharmaceuticals, retail & e-commerce, electronics, automotive, and manufacturing. Among these, the retail & e-commerce segment took the lead with a 43% share in 2024, largely attributed to the expanding online shopping landscape and an increase in product returns. As online retailers adopt flexible return policies, including extended return windows and free return shipping, the demand for efficient reverse logistics solutions is expected to continue growing.
The U.S. reverse logistics market alone accounted for 76% of the global share in 2024, generating USD 253.7 billion by 2034. This growth is driven by the well-established e-commerce ecosystem, stringent regulatory compliance requirements, and rapid advancements in logistics technology. The demand for optimized return processes and infrastructure continues to rise as businesses work to improve efficiency and meet evolving customer expectations. Additionally, regulatory policies that emphasize sustainability and environmentally responsible handling of returns are accelerating the adoption of green logistics practices in the industry.
Table of Contents
Chapter 1 Methodology & Scope
- 1.1 Research design
- 1.1.1 Research approach
- 1.1.2 Data collection methods
- 1.2 Base estimates and calculations
- 1.2.1 Base year calculation
- 1.2.2 Key trends for market estimates
- 1.3 Forecast model
- 1.4 Primary research & validation
- 1.4.1 Primary sources
- 1.4.2 Data mining sources
- 1.5 Market definitions
Chapter 2 Executive Summary
- 2.1 Industry synopsis, 2021 - 2034
Chapter 3 Industry Insights
- 3.1 Industry ecosystem analysis
- 3.1.1 Technology providers
- 3.1.2 Component suppliers
- 3.1.3 OEMs
- 3.1.4 End user
- 3.2 Supplier landscape
- 3.3 Profit margin analysis
- 3.4 Technology & innovation landscape
- 3.5 Key news & initiatives
- 3.6 Regulatory landscape
- 3.7 Impact forces
- 3.7.1 Growth drivers
- 3.7.1.1 Increasing focus on sustainability
- 3.7.1.2 Rising e-commerce and product returns
- 3.7.1.3 Cost efficiency and resource recovery
- 3.7.1.4 Technological advancements
- 3.7.2 Industry pitfalls & challenges
- 3.7.2.1 High operational costs
- 3.7.2.2 Complexity of returns management
- 3.7.1 Growth drivers
- 3.8 Growth potential analysis
- 3.9 Porter’s analysis
- 3.10 PESTEL analysis
Chapter 4 Competitive Landscape, 2024
- 4.1 Introduction
- 4.2 Company market share analysis
- 4.3 Competitive positioning matrix
- 4.4 Strategic outlook matrix
Chapter 5 Market Estimates & Forecast, By Processes, 2021 - 2034 ($Bn)
- 5.1 Key trends
- 5.2 Returns management
- 5.3 Remanufacturing
- 5.4 Recycling
- 5.5 Disposal
- 5.6 Others
Chapter 6 Market Estimates & Forecast, By Return, 2021 - 2034 ($Bn)
- 6.1 Key trends
- 6.2 Defective returns
- 6.3 Recalled returns
- 6.4 B2b returns and commercial returns
- 6.5 Repairable returns
- 6.6 End of life returns
- 6.7 Others
Chapter 7 Market Estimates & Forecast, By Service Provider, 2021 - 2034 ($Bn)
- 7.1 Key trends
- 7.2 In-house reverse logistics
- 7.3 Third-party logistics (3PL) Providers
- 7.4 Recycling companies
- 7.5 Waste management companies
Chapter 8 Market Estimates & Forecast, By End Use, 2021 - 2034 ($Bn)
- 8.1 Key trends
- 8.2 Retail & E-commerce
- 8.3 Electronics
- 8.4 Automotive
- 8.5 Pharmaceuticals
- 8.6 Manufacturing
- 8.7 Others
Chapter 9 Market Estimates & Forecast, By Region, 2021 - 2034 ($Bn)
- 9.1 Key trends
- 9.2 North America
- 9.2.1 U.S.
- 9.2.2 Canada
- 9.3 Europe
- 9.3.1 UK
- 9.3.2 Germany
- 9.3.3 France
- 9.3.4 Spain
- 9.3.5 Italy
- 9.3.6 Russia
- 9.3.7 Nordics
- 9.4 Asia Pacific
- 9.4.1 China
- 9.4.2 India
- 9.4.3 Japan
- 9.4.4 South Korea
- 9.4.5 ANZ
- 9.4.6 Southeast Asia
- 9.5 Latin America
- 9.5.1 Brazil
- 9.5.2 Mexico
- 9.5.3 Argentina
- 9.6 MEA
- 9.6.1 UAE
- 9.6.2 South Africa
- 9.6.3 Saudi Arabia
Chapter 10 Company Profiles
- 10.1 Deutsche Post DHL Group
- 10.2 UPS
- 10.3 FedEx
- 10.4 XPO Logistics
- 10.5 Ryder System, Inc.
- 10.6 Maersk
- 10.7 ReverseLogix
- 10.8 CEVA Logistics
- 10.9 DB Schenker
- 10.10 Lineage Logistics
- 10.11 Kuehne + Nagel
- 10.12 Expeditors International
- 10.13 Geodis
- 10.14 C.H. Robinson
- 10.15 Pitney Bowes
- 10.16 Genco (now part of FedEx)
- 10.17 Manhattan Associates
- 10.18 Damco
- 10.19 TTS Logistics
- 10.20 Echo Global Logistics
 2032年农业价值链逆向物流市场预测:按产品类型、逆向物流类型、最终用户和地区分類的全球分析可回收包装市场预测至2032年:逆向物流-按材料、包装类型、应用、最终用户和地区分類的全球分析
 全球逆向物流市场
 印度逆向物流市场:依退货类型、服务、最终用户、地区、机会及预测,2019-2033美国逆向物流市场:依退货类型、服务、最终用户、地区、机会及预测,2018-2032
 逆向物流市场规模、份额、趋势分析报告:依退货类型、服务、最终用户产业、地区、细分市场预测,2025-2033
 日本逆向物流市场报告(依退货类型、服务、最终用户和地区划分)2025-20332025 年至 2033 年逆向物流市场报告(依退货类型、服务、最终用户和地区)
 美国逆向物流市场:市场占有率分析、产业趋势与成长预测(2025-2030 年)
 逆向物流市场分析及预测至 2033 年:依类型、产品、服务、技术、应用、流程、部署、最终使用者及解决方案