


 |
市场调查报告书
商品编码
1683220
美国逆向物流市场:市场占有率分析、产业趋势与成长预测(2025-2030 年)US Reverse Logistics - Market Share Analysis, Industry Trends & Statistics, Growth Forecasts (2025 - 2030) |
||||||
※ 本网页内容可能与最新版本有所差异。详细情况请与我们联繫。
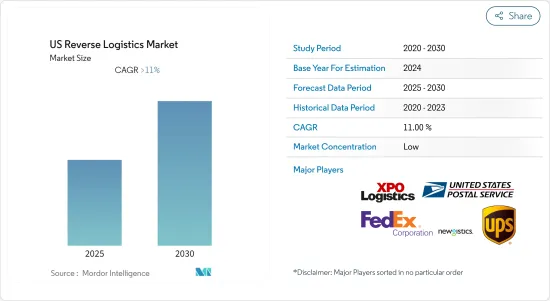
预计预测期内美国逆向物流市场复合年增长率将超过 11%
关键亮点
- 网路购物和销售持续蓬勃发展。零售商和快递公司必须运送越来越多的出站包装,同时也要应付不断增加的退货量。 2017 年,约有 1,200 亿美元的电子商务商品被退回。在网上购买的商品被退回的可能性比实体店购买的商品高出三倍。退货对零售商来说是一个挑战,但由于客户越来越认为退货是网路购物体验的重要组成部分,因此很难限制退货。快速、免费且友善的退货声誉可以赢得客户忠诚度,而糟糕的退货体验很容易让客户望而却步。除了包装废弃物外,零售商还在努力使其逆向供应链具有高度可持续性,价值 50 亿英镑的退货最终掩埋垃圾掩埋场。为了控制相关成本并改善客户体验,零售商正在尝试多种策略。拥有实体店的零售商开始接受全通路退货,允许顾客在现有的实体店退回网上购买的商品。自动宅配储物柜和智慧型手机应用程式等新技术正在创造更无缝的退货体验。然而,零售商仍然将退货视为需要克服的重大挑战和成本中心,这为逆向物流行业的所有参与企业创造了创新机会。
- 逆向物流比正向物流更为复杂。零售商正在寻找能够提高效率并降低成本的运输公司。根据行业调查,60% 的活跃网路购物表示免费退货是良好退货体验的重要元素。
- 2018年,美国汽车业销量达1,730万辆,超过业界预期。美国汽车及汽车零件产业的逆向物流成本庞大。
- 此外,公司也正在寻求外包非传统物流需求,如逆向物流、订单履行、库存管理、运输和标籤/包装。这预计将为物流服务供应商(LSP)创造更多机会。
美国逆向物流市场的趋势
电子商务和技术的发展推动了对高效退货物流的需求
电子商务的快速成长是美国物流和逆向物流的主要驱动力之一。 2017年,美国网路零售额达4,535亿美元,较2016年的3,900亿美元成长16%。实体店销售额成长了3.4%。 2017年网路零售额占社会消费品零售总额的8.9%。电子商务的持续成长导致包裹退回数量增加。随着电子商务占据零售市场的更大份额,整体零售退货率可能会继续上升,尤其是运输退货率的增加,对整个逆向供应链带来压力。
科技在逆向供应链的其他环节也扮演关键角色。一个受欢迎的软体提供者是 Optoro。 Optoro 结合历史定价和单一产品资料来提供演算法,告诉公司将每个退回的产品送到何处——最盈利的退货处理路径,无论是转售、清算、修理还是回收。 Optoro 声称其智慧路线极大地提高了退货库存的盈利。
全通路退货越来越受欢迎
另一个日益增长的趋势是全通路退货,商家允许消费者在店内退回网上商品,从而使退货更加便利。 BORIS 退货(网上购买,店内退货)不仅可以为商家节省首英里退货运费,还可以鼓励额外购买。根据 UPS 的一项研究,66% 的网路购物购物者在店内退货后会进行新的购买,而线上退货的比例仅为 44%。除了对零售商来说很方便之外,58% 的电子商务购物者更愿意在店内退货,而不是透过邮寄。儘管存在这种偏好,但消费者仍然更有可能透过邮寄电子商务退货,而不是将其带到商店。宅配业者也在人口较多的地区扩大其实网路基地台。沃尔格林最近同意在其 7,500 家门市提供联邦快递包裹递送服务。 UPS网路基地台透过 4,000 个地点组成的网路提供服务,其中包括干洗店和便利商店。 Happy Returns 是新兴企业,它使用购物中心和商店中的自助服务终端来收集和整合散装退回的商品。我们为纯线上零售商提供退货收集的实体通路。零售商节省了运输成本,客户可以获得快速退款,并且省去了包装的麻烦。
美国逆向物流产业概况
由于电子商务领域的需求不断增加和先进技术的进步,美国逆向物流市场环境的竞争日益激烈。零售商越来越多地求助于第三方物流(3PL)提供者来帮助他们建立高效的逆向物流业务。物流公司有能力解决退货问题。这些公司可以利用其资本、规模和专业知识来解决零售商在商品通过逆向供应链时普遍遇到的痛点。这种情况吸引了参与企业和新参与企业更加关注退货物流,从而加剧了市场竞争。当公司寻找新方法来获得竞争优势时,退货能力可能是经常被忽视的潜在来源。更重视退货管理的公司预计将提供更有效率、一致、快速的客户体验,从而获得更好的服务、更高的盈利和更低的成本。
其他福利
- Excel 格式的市场预测 (ME) 表
- 3 个月的分析师支持
目录
第 1 章 简介
- 市场覆盖
- 市场定义
- 执行摘要
第二章调查方法
- 调查结果
- 调查前提
- 分析方法
- 研究阶段
第三章 市场洞察
- 当前市场状况
- 技术趋势和自动化(重点关注新兴新Start-Ups)
- 研究改变消费行为和偏好
- 精选 -美国电子商务产业(当前状况、趋势、展望)
- 退货成本如何影响零售业-分析师的看法
- 汽车逆向物流和售后市场概览
- 全新全通路退货回顾与说明
- 闭合迴路供应链洞察
第四章 市场动态
- 驱动程式
- 限制因素
- 机会
- 波特五力分析
- 产业价值链分析
第五章 市场区隔
- 按功能
- 运输
- 路
- 航空
- 其他交通工具
- 仓储业(储存、配送、整合)
- 其他附加价值服务(退货处理、补货、整修、处置等)
- 运输
- 按最终用户
- 消费品和零售(电子商务、家用电子电器、服饰和服饰等)
- 车
- 医疗药品
- 其他工业活动部门
- 其他的
第六章 竞争格局
- 併购、合资、合作、协议
- 市场集中度概览
- 主要企业策略
第七章 公司简介
- United Parcel Service(UPS)
- FedEx Corporation
- United States Postal Service(USPS)
- XPO Logistics
- Newgistics Inc.
- Happy Returns Inc.
- American Distribution Inc.
- DHL
- FW Logistics
- YRC Worldwide Inc.
- DGD Transport
- A2B Fulfillment
- Optoro
- CH Robinson Worldwide Inc.
- Yusen Logistics
- Excelsior Integrated LLC
8. 了解价值链中的其他主要企业
第 9 章 附录
- 经济统计 - 运输和仓储业对经济的贡献
- 深入了解美国退货最多的产品
- 对正向物流的定性和定量洞察
- 零售业占 GDP 的比重
- 电子商务销售额占 GDP 的百分比
第十章 免责声明
The US Reverse Logistics Market is expected to register a CAGR of greater than 11% during the forecast period.
Key Highlights
- Online shopping and sales continue to grow at a rapid pace. As retailers and delivery companies move increasing numbers of outbound packages, they must also address the issue of rising volume of return goods. Around USD 120 billion of e-commerce purchases were returned in 2017. Online purchased goods are three times more likely to be returned than those made in a general physical store. Though returns pose challenges for retailers, they find it challenging to limit returns because customers increasingly see returns as a critical part of online shopping experience. The reputation for fast, free, and friendly returns can earn customer loyalty, while a poor return experience can easily drive them away. With GBP 5 billion worth of returns ending up in landfills, apart from the waste from packaging, retailers are also struggling to make their reverse supply chains highly sustainable. To control the associated costs and improve customer experience, retailers are trying several strategies. Retailers with an existing physical presence have started embracing omnichannel returns, allowing returns of online purchases at existing physical stores. Emerging technologies, such as automated parcel lockers, and smartphone apps, are creating a more seamless return experience. However, retailers still see returns as a significant challenge to be overcome, and as a cost center, which has created opportunities for innovation for all players in the reverse logistics industry.
- Reverse logistics is more complicated than forward logistics. Retailers want shipping companies that create new efficiencies and cut costs. According to an industry survey, 60% of active online shoppers say that free returns are a vital part of a good returns experience.
- The US auto industry recorded the sales of 17.3 million vehicles in 2018, beating the industry expectations. Reverse logistics cost in the US auto and auto components industry is significant.
- Additionally, companies are looking to outsource non-traditional logistics requirements, such as reverse logistics, order processing, inventory management, distribution, and labeling and packaging. This is expected to provide more opportunities for logistics service providers (LSPs).
US Reverse Logistics Market Trends
Growth in E-commerce and Technology Propels the Demand for Efficient Return Logistics
The rapid growth in e-commerce is one of the major drivers of the forward and reverse logistics in the United States. In 2017, the online retail sales in the United States reached USD 453.5 billion, registering a growth rate of 16%, from USD 390 billion in 2016. The physical retail stores sales increased by 3.4%. The online retail sales accounted for 8.9% of the total retail sales, in 2017. The continuing surge of e-commerce was fueling a rise in the number of packages returned. As e-commerce grabs a greater share of the retail market, the overall retail return rate may continue to climb, especially the rate of goods returned via shipping, adding pressure to the entire reverse supply chain.
Technology is also playing a crucial role in other segments of the reverse supply chain. One popular software provider is Optoro, which combines historical pricing and individual product data into an algorithm that tells companies where they should route each return item, to the most profitable disposition path for a return, i.e., resale, liquidation, repair, recycling, or something else. Optoro claims that its smart routing dramatically improves the profitability of returned inventory.
Growing Popularity for Omnichannel Returns
Another growing trend is the omnichannel returns, in which merchants are making returns more convenient, by allowing consumers to return online items in physical locations. BORIS returns (buy online and return in store) not only save merchants the cost of first-mile return shipping, but also encourage additional purchases. According to a UPS survey, 66% of online shoppers made a new purchase when returning in store, compared to 44% when returning online. In addition to being better for retailers, 58% of e-commerce shoppers preferred to make returns at brick-and-mortar stores rather than mail them. Moreover, despite this preference, the shoppers are much more likely to ship their e-commerce returns than bring them to a store. Delivery companies are also expanding physical access points in high-population areas. Recently, Walgreens agreed to provide FedEx package pickup and delivery service at 7,500 stores. UPS Access Point offers services through a network of 4,000 locations, such as dry cleaners and convenience stores. Happy Returns is a startup that collects and aggregates loose return items at kiosks in malls or stores. It provides online-only retailers with a physical channel for collecting returns. Retailers save on shipping, customers get their refunds immediately and avoid the hassle of packing their item, and malls get additional foot traffic.
US Reverse Logistics Industry Overview
The reverse logistics market landscape of the United States is becoming highly competitive, with increasing demand from the e-commerce sector and evolution of advanced technologies. Retailers are increasingly turning toward third-party logistics (3PL) providers, to help them establish efficient reverse logistics operations. Logistics firms are well positioned to solve returns issues. These companies can take advantage of their capital, and scale and expertise to solve pain points commonly experienced by retailers, as goods move through the reverse supply chain. This scenario is attracting existing, as well as new player, to focus more on return logistics, thus making the market more competitive. As organizations seek new ways to gain competitive advantage, the often-overlooked returns function can be a potential source. Businesses that pay more attention to returns management are expected to obtain the benefits of delivering a more efficient, consistent, and responsive customer experience, and operate to cut costs, as well as enhance service and profitability.
Additional Benefits:
- The market estimate (ME) sheet in Excel format
- 3 months of analyst support
TABLE OF CONTENTS
1 INTRODUCTION
- 1.1 Scope of the Market
- 1.2 Market Definition
- 1.3 Executive Summary
2 RESEARCH METHODOLOGY
- 2.1 Study Deliverables
- 2.2 Study Assumptions
- 2.3 Analysis Methodology
- 2.4 Research Phases
3 MARKET INSIGHTS
- 3.1 Current Market Scenario
- 3.2 Technological Trends and Automation (In-depth Focus on Emerging Startups)
- 3.3 Study on Changing Consumer Behavior and Their Preferences
- 3.4 Spotlight - US E-commerce Industry (Current Scenario, Trends, and Outlook)
- 3.5 Impact of Cost of Returns on Retailers - Analyst's View
- 3.6 Brief on Automotive Reverse Logistics and Aftermarket
- 3.7 Review and Commentary on Emerging Omnichannel Returns
- 3.8 Insights on Closed-loop Supply Chain
4 MARKET DYNAMICS
- 4.1 Drivers
- 4.2 Restraints
- 4.3 Opportunities
- 4.4 Porter's Five Forces Analysis
- 4.5 Industry Value Chain Analysis
5 MARKET SEGMENTATION
- 5.1 By Function
- 5.1.1 Transportation
- 5.1.1.1 Road
- 5.1.1.2 Air
- 5.1.1.3 Other Modes of Transportation
- 5.1.2 Warehousing (Storage, Distribution, and Consolidation)
- 5.1.3 Other Value-added Services (Return Processing, Restocking, Refurbishment, Disposition, etc.)
- 5.1.1 Transportation
- 5.2 By End User
- 5.2.1 Consumer and Retail (Covers E-commerce, Consumer Electronics, Apparel and Garment Sectors, etc.)
- 5.2.2 Automotive
- 5.2.3 Healthcare and Pharmaceuticals
- 5.2.4 Other Industrial Activity Sectors
- 5.2.5 Other End Users
6 COMPETITIVE LANDSCAPE
- 6.1 Mergers and Acquisitions, Joint Ventures, Collaborations, and Agreements
- 6.2 Market Concentration Overview
- 6.3 Strategies Adopted by Major Players
7 COMPANY PROFILES
- 7.1 United Parcel Service (UPS)
- 7.2 FedEx Corporation
- 7.3 United States Postal Service (USPS)
- 7.4 XPO Logistics
- 7.5 Newgistics Inc.
- 7.6 Happy Returns Inc.
- 7.7 American Distribution Inc.
- 7.8 DHL
- 7.9 FW Logistics
- 7.10 YRC Worldwide Inc.
- 7.11 DGD Transport
- 7.12 A2B Fulfillment
- 7.13 Optoro
- 7.14 C.H. Robinson Worldwide Inc.
- 7.15 Yusen Logistics
- 7.16 Excelsior Integrated LLC
8 INSIGHTS ON OTHER KEY PLAYERS IN THE VALUE CHAIN
9 APPENDIX
- 9.1 Economic Statistics - Transport and Storage Sector, Contribution to Economy
- 9.2 Insights on Key Products Returned in the United States
- 9.3 Qualitative and Quantitative Insights on Forward Logistics
- 9.4 Retail Sector Share of GDP
- 9.5 E-commerce Sales as Share of GDP
10 DISCLAIMER
 2026-2030年全球逆向物流自动化软体市场
 日本逆向物流市场报告(依退货类型、服务、最终用户和地区划分,2026-2034年)
 逆向物流市场机会、成长要素、产业趋势分析及预测(2026年至2035年)
 逆向物流市场规模、份额和成长分析(按退货类型、服务、最终用户产业和地区划分)-2026-2033年产业预测
 2032年农业价值链逆向物流市场预测:按产品类型、逆向物流类型、最终用户和地区分類的全球分析可回收包装市场预测至2032年:逆向物流-按材料、包装类型、应用、最终用户和地区分類的全球分析
 全球逆向物流市场
 印度逆向物流市场:依退货类型、服务、最终用户、地区、机会及预测,2019-2033美国逆向物流市场:依退货类型、服务、最终用户、地区、机会及预测,2018-2032
 逆向物流市场规模、份额、趋势分析报告:依退货类型、服务、最终用户产业、地区、细分市场预测,2025-2033