


 |
市场调查报告书
商品编码
1685174
饮料包装市场机会、成长动力、产业趋势分析与 2025 - 2034 年预测Beverage Packaging Market Opportunity, Growth Drivers, Industry Trend Analysis, and Forecast 2025 - 2034 |
||||||
2024 年全球饮料包装市场规模达 1,679 亿美元,预估 2025 年至 2034 年期间复合年增长率为 5.3%。这一成长主要受消费者对永续和环保包装解决方案需求不断增长的推动。随着环保意识的不断增强,消费者和製造商都在不断寻求传统包装方法的替代品。人们明显在推动可回收、可生物降解或可重复使用的材料,从而推动企业创新并采用更永续的选择。此外,即饮饮料的成长趋势进一步促进了市场的扩张。人们对便利、便携选择的需求正在不断增长,这种转变正在影响饮料包装产业。此外,包装技术的进步正在提高效率并减少对环境的影响,提供的解决方案不仅轻巧、实用,而且还具有环保意识。这些发展有助于公司与永续发展目标保持一致,同时满足具有环保意识的消费者不断变化的需求。随着全球监管压力的增加,向环保包装材料和技术的转变预计将加速。
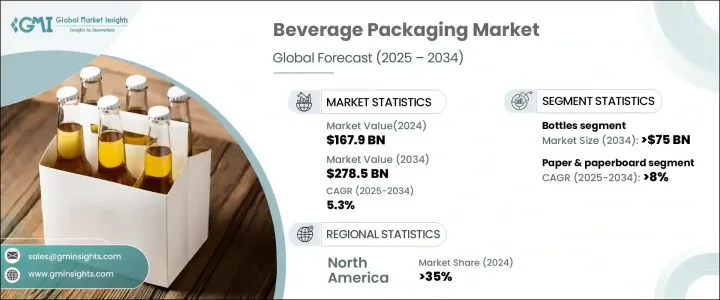
饮料包装市场分为几种产品类型,包括瓶子、罐子、纸盒、袋等。瓶子继续占据市场主导地位,预计到 2034 年将创造 750 亿美元的市场价值。瓶子经久不衰的受欢迎程度得益于其多功能性、耐用性以及长时间保持饮料品质的能力。瓶子还具有便携性和可重新密封的瓶盖,这增加了便利性,特别是对于忙碌的消费者而言。随着轻量和可回收 PET 瓶等创新的出现,这个细分市场符合永续发展目标,推动了有环保意识的购物者的需求增加。
| 市场范围 | |
|---|---|
| 起始年份 | 2024 |
| 预测年份 | 2025-2034 |
| 起始值 | 1679亿美元 |
| 预测值 | 2785亿美元 |
| 复合年增长率 | 5.3% |
就材料而言,市场分为塑胶、玻璃、金属、纸和纸板。其中,纸和纸板的成长速度最快,预计 2025 年至 2034 年期间的复合年增长率为 8%。这种快速增长归因于人们越来越多地转向永续替代品。随着人们对塑胶废物的担忧日益加剧,消费者和品牌都开始选择纸和纸板等环保材料。这些材料可生物降解且可回收,特别适合果汁和乳製品饮料等需要可再生和轻质包装的产品。
在北美,饮料包装市场在2024年占全球份额的35%。美国对永续和便利包装解决方案的需求正在快速成长。消费者越来越关注购买产品对环境的影响,进一步提高了对可回收和可生物降解包装的需求。功能性饮料的激增和个性化包装的兴起进一步推动了市场的成长。此外,减少塑胶废弃物和加强回收力度的监管压力不断增加,促使企业采用满足这些新兴偏好的新型包装技术和设计。
目录
第 1 章:方法论与范围
- 市场范围和定义
- 基础估算与计算
- 预测计算
- 资料来源
- 基本的
- 次要
- 付费来源
- 公共资源
第 2 章:执行摘要
第 3 章:产业洞察
- 产业生态系统分析
- 影响价值链的因素
- 利润率分析
- 中断
- 未来展望
- 製造商
- 经销商
- 重要新闻及倡议
- 监管格局
- 衝击力
- 成长动力
- 都市化和可支配所得增加
- 消费者偏好美观创新的包装设计
- 即饮饮料和功能性饮料日益流行
- 消费者对方便携带的饮料包装的需求不断增加
- 对永续和环保包装解决方案的需求不断增长
- 产业陷阱与挑战
- 原物料价格波动影响包装成本
- 包装材料和回收实践的监管限制
- 成长动力
- 成长潜力分析
- 波特的分析
- PESTEL 分析
第四章:竞争格局
- 介绍
- 公司市占率分析
- 竞争定位矩阵
- 战略展望矩阵
第 5 章:市场估计与预测:按材料,2021 年至 2034 年
- 主要趋势
- 塑胶
- 玻璃
- 金属
- 纸和纸板
- 其他的
第 6 章:市场估计与预测:按产品类型,2021-2034 年
- 主要趋势
- 瓶子
- 罐头
- 纸箱
- 袋装
- 其他的
第 7 章:市场估计与预测:按饮料类型,2021-2034 年
- 主要趋势
- 酒精饮料
- 非酒精饮料
- 乳製品饮料
第 8 章:市场估计与预测:按地区,2021 年至 2034 年
- 主要趋势
- 北美洲
- 我们
- 加拿大
- 欧洲
- 英国
- 德国
- 法国
- 义大利
- 西班牙
- 俄罗斯
- 亚太地区
- 中国
- 印度
- 日本
- 韩国
- 澳洲
- 拉丁美洲
- 巴西
- 墨西哥
- 中东及非洲
- 南非
- 沙乌地阿拉伯
- 阿联酋
第九章:公司简介
- Amcor
- Ardagh Group
- Ball Corporation
- Berry Global Group
- Can-Pack
- CCL Containers
- CPMC Holdings
- Crown Holdings
- Graham Packaging Company
- Graphic Packaging International
- Novelis
- Plastipak Holdings
- SIG
- Silgan Holdings
- Smurfit Kappa
- Stora Enso
- Tetra Pak International
- Visy Industries
- WestRock
The Global Beverage Packaging Market reached USD 167.9 billion in 2024 and is projected to expand at a CAGR of 5.3% from 2025 to 2034. This growth is primarily driven by rising consumer demand for sustainable and eco-friendly packaging solutions. As environmental awareness continues to grow, both consumers and manufacturers are increasingly seeking alternatives to traditional packaging methods. There is a clear push for recyclable, biodegradable, or reusable materials, leading companies to innovate and adopt more sustainable options. Additionally, the growing trend of ready-to-drink beverages further contributes to the market's expansion. The demand for convenient, on-the-go options is rising, and this shift is influencing the beverage packaging industry. Moreover, advancements in packaging technologies are improving efficiency and reducing environmental impact, offering solutions that are not only lightweight and functional but also environmentally conscious. These developments are helping companies stay aligned with sustainability goals while meeting the evolving demands of eco-conscious consumers. As regulatory pressures increase globally, the shift toward eco-friendly packaging materials and technologies is expected to accelerate.
The beverage packaging market is categorized into several product types, including bottles, cans, cartons, pouches, and others. Bottles continue to dominate the market and are projected to generate USD 75 billion by 2034. Their enduring popularity is due to their versatility, durability, and ability to preserve beverage quality over extended periods. Bottles also offer portability and resealable caps, which add convenience, especially for on-the-go consumers. With innovations such as lightweight and recyclable PET bottles, this segment aligns with sustainability goals, driving increased demand from environmentally conscious shoppers.
| Market Scope | |
|---|---|
| Start Year | 2024 |
| Forecast Year | 2025-2034 |
| Start Value | $167.9 Billion |
| Forecast Value | $278.5 Billion |
| CAGR | 5.3% |
When it comes to materials, the market is segmented into plastic, glass, metal, paper, and paperboard. Among these, paper and paperboard are experiencing the fastest growth, projected to rise at a CAGR of 8% between 2025 and 2034. This rapid growth is attributed to the increasing shift toward sustainable alternatives. With the growing concerns over plastic waste, consumers and brands alike are opting for eco-friendly materials like paper and paperboard. These materials are biodegradable and recyclable, making them particularly popular for products like juices and dairy beverages, where renewable and lightweight packaging is desired.
In North America, the beverage packaging market accounted for 35% of the global share in 2024. The U.S. is seeing rapid growth in demand for sustainable and convenient packaging solutions. Consumers are becoming more mindful of the environmental impact of their purchases, pushing the demand for recyclable and biodegradable packaging even higher. The surge in functional beverages and the rising trend for personalized packaging are further propelling market growth. Additionally, increasing regulatory pressures to reduce plastic waste and enhance recycling efforts are driving companies to adopt new packaging technologies and designs that meet these emerging preferences.
Table of Contents
Chapter 1 Methodology & Scope
- 1.1 Market scope & definitions
- 1.2 Base estimates & calculations
- 1.3 Forecast calculations
- 1.4 Data sources
- 1.4.1 Primary
- 1.4.2 Secondary
- 1.4.2.1 Paid sources
- 1.4.2.2 Public sources
Chapter 2 Executive Summary
- 2.1 Industry synopsis, 2022-2034
Chapter 3 Industry Insights
- 3.1 Industry ecosystem analysis
- 3.1.1 Factor affecting the value chain
- 3.1.2 Profit margin analysis
- 3.1.3 Disruptions
- 3.1.4 Future outlook
- 3.1.5 Manufacturers
- 3.1.6 Distributors
- 3.2 Key news & initiatives
- 3.3 Regulatory landscape
- 3.4 Impact forces
- 3.4.1 Growth drivers
- 3.4.1.1 Urbanization and rising disposable incomes
- 3.4.1.2 Consumer preference for aesthetic and innovative packaging designs
- 3.4.1.3 Rising popularity of ready-to-drink and functional beverages
- 3.4.1.4 Increased consumer demand for convenient, on-the-go beverage packaging
- 3.4.1.5 Rising demand for sustainable and environmentally friendly packaging solutions
- 3.4.2 Industry pitfalls & challenges
- 3.4.2.1 Volatility in raw material prices affecting packaging costs
- 3.4.2.2 Regulatory restrictions on packaging materials and recycling practices
- 3.4.1 Growth drivers
- 3.5 Growth potential analysis
- 3.6 Porter’s analysis
- 3.7 PESTEL analysis
Chapter 4 Competitive Landscape, 2024
- 4.1 Introduction
- 4.2 Company market share analysis
- 4.3 Competitive positioning matrix
- 4.4 Strategic outlook matrix
Chapter 5 Market Estimates & Forecast, By Material, 2021-2034 (USD Billion & Kilo Tons)
- 5.1 Key trends
- 5.2 Plastic
- 5.3 Glass
- 5.4 Metal
- 5.5 Paper & Paperboard
- 5.6 Others
Chapter 6 Market Estimates & Forecast, By Product Type, 2021-2034 (USD Billion & Kilo Tons)
- 6.1 Key trends
- 6.2 Bottles
- 6.3 Cans
- 6.4 Cartons
- 6.5 Pouches
- 6.6 Others
Chapter 7 Market Estimates & Forecast, By Beverages Type, 2021-2034 (USD Billion & Kilo Tons)
- 7.1 Key trends
- 7.2 Alcoholic beverages
- 7.3 Non-alcoholic beverages
- 7.4 Dairy beverages
Chapter 8 Market Estimates & Forecast, By Region, 2021-2034 (USD Billion & Kilo Tons)
- 8.1 Key trends
- 8.2 North America
- 8.2.1 U.S.
- 8.2.2 Canada
- 8.3 Europe
- 8.3.1 UK
- 8.3.2 Germany
- 8.3.3 France
- 8.3.4 Italy
- 8.3.5 Spain
- 8.3.6 Russia
- 8.4 Asia Pacific
- 8.4.1 China
- 8.4.2 India
- 8.4.3 Japan
- 8.4.4 South Korea
- 8.4.5 Australia
- 8.5 Latin America
- 8.5.1 Brazil
- 8.5.2 Mexico
- 8.6 MEA
- 8.6.1 South Africa
- 8.6.2 Saudi Arabia
- 8.6.3 UAE
Chapter 9 Company Profiles
- 9.1 Amcor
- 9.2 Ardagh Group
- 9.3 Ball Corporation
- 9.4 Berry Global Group
- 9.5 Can-Pack
- 9.6 CCL Containers
- 9.7 CPMC Holdings
- 9.8 Crown Holdings
- 9.9 Graham Packaging Company
- 9.10 Graphic Packaging International
- 9.11 Novelis
- 9.12 Plastipak Holdings
- 9.13 SIG
- 9.14 Silgan Holdings
- 9.15 Smurfit Kappa
- 9.16 Stora Enso
- 9.17 Tetra Pak International
- 9.18 Visy Industries
- 9.19 WestRock
 2025 年至 2033 年饮料包装市场报告,依材料(塑胶、金属、玻璃、纸板等)、产品(瓶装、罐装、袋装、纸盒等)、应用(酒精饮料、非酒精饮料)和地区划分
 2025年热填充包装全球市场报告
 饮料包装:市场占有率分析、行业趋势和统计数据、成长预测(2025-2030 年)
 非酒精饮料包装市场机会、成长动力、产业趋势分析及 2025 - 2034 年预测
 酒精饮料包装市场规模、份额和成长分析(按产品、材料、应用和地区)- 2025-2032 年产业预测2025 年酒精饮料包装全球市场报告饮料包装市场按产品类型、应用和地区划分
 热填充包装市场报告:趋势、预测和竞争分析(至 2031 年)饮料容器市场机会、成长动力、产业趋势分析及 2025-2034 年预测饮料包装市场规模、份额和增长分析(按材料、产品、数量、应用和地区)- 2025-2032 年行业预测