


 |
市场调查报告书
商品编码
1698553
智慧交通系统 (ITS) 市场机会、成长动力、产业趋势分析及 2025-2034 年预测Intelligent Transportation System (ITS) Market Opportunity, Growth Drivers, Industry Trend Analysis, and Forecast 2025-2034 |
||||||
2024 年全球智慧交通系统市场估值达 472 亿美元,预计 2025 年至 2034 年的复合年增长率将达到 10.3%。随着城市化继续以前所未有的速度发展,对智慧城市发展的日益关注是一个重要的驱动力。世界各地的城市对可持续、高效、安全的出行解决方案的需求日益增长。随着全球人口向城市地区转移,交通基础设施的数位化进步对于优化交通流量、减少交通拥堵和提高公共交通效率至关重要。
ITS 解决方案整合了先进的交通管理、即时资料分析、互联互通和公共交通运营,以简化城市交通。随着环境问题日益严重,新技术正在运用以支援电动车、共享交通和降低排放。城市扩张预计将导致道路上增加数百万辆新车,对现有的交通系统提出挑战,并需要创新的解决方案来保持永续性。智慧物联网、人工智慧和分析技术的采用将多种交通方式整合到无缝的多模式网路中,重新定义城市交通。即时资讯系统使旅行者能够获取时刻表、交通更新和替代路线,从而提高效率和便利性。随着城市实施促进数位移动生态系统的政策,对 ITS 的投资持续成长,推动了对更安全、更永续的城市交通解决方案的需求。
| 市场范围 | |
|---|---|
| 起始年份 | 2024 |
| 预测年份 | 2025-2034 |
| 起始值 | 472亿美元 |
| 预测值 | 1214亿美元 |
| 复合年增长率 | 10.3% |
市场依运输方式细分,包括铁路、公路、航空和海运。 2024 年,铁路产业占据超过 40% 的市场份额,而预计到 2034 年公路产业的市场规模将超过 250 亿美元。各国政府正在发布高额的道路升级招标,优先考虑基础设施升级,以适应日益增长的交通量。这些项目专注于改善交叉路口、修復道路和部署即时监控系统以加强交通管理并缓解交通拥堵。
在铁路领域,应用包括智慧票务、乘客资讯管理、营运、安全、紧急通知和防撞。 2024 年,乘客资讯管理占据 27.9% 的市场份额,而智慧票务预计到 2034 年将以 13% 的复合年增长率成长。交通运输领域加强数位转型的努力正在利用即时通讯技术、车内运算系统、GPS 追踪和基于云端的资讯平台来改善乘客体验和营运效率。
航空运输部门包括资讯显示系统、追踪和监控系统、自助行李解决方案、自助服务终端、通讯网路和智慧门。追踪和监控解决方案在 2024 年引领市场,估值达 20 亿美元。 GPS 和物联网的整合彻底改变了航空业,实现了对飞机、乘客和行李的即时追踪。增强的态势感知可提高安全性、营运效率和资产管理,确保航空公司和机场的无缝营运。
公路运输市场分为硬体、软体和服务。 2024年,硬体领域占据主导地位,市场占有率超过55%。 GPS 装置、感测器、高画质摄影机和加固型物联网设备的采用提高了连接性和运作可靠性。边缘运算实现了车辆内部的资料处理,提高了效率和乘客安全。
在北美,美国以 2024 年 106 亿美元的营收领先 ITS 市场。公共运输系统越来越多地采用共享出行服务,将共享单车、电动滑板车和共乘整合到多模式网路中。非接触式票务系统已广泛实施,可透过智慧型手机、智慧卡和数位钱包实现无缝票价支付。这些进步透过减少交通拥堵、提高运输效率和提供更互联的交通体验,增强了城市交通。
目录
第一章:方法论与范围
- 研究设计
- 研究方法
- 资料收集方法
- 基础估算与计算
- 基准年计算
- 市场评估的主要趋势
- 预测模型
- 初步研究和验证
- 主要来源
- 资料探勘来源
- 市场范围和定义
第二章:执行摘要
第三章:行业洞察
- 产业生态系统分析
- 原物料供应商
- 零件供应商
- 製造商
- 技术/软体供应商
- 系统整合商
- 服务提供者
- 政府机构
- 金融当局
- 供应商格局
- 利润率分析
- 技术与创新格局
- 专利分析
- 重要新闻和倡议
- 监管格局
- 衝击力
- 成长动力
- 政府资助和 PPP 模式
- 欧洲和北美通勤者对预付费票务服务的需求
- 北美和亚太地区政府推出更多有利于有效交通管理的倡议
- 欧洲铁路基础建设投资不断增加
- 亚太地区都市化进程快速推进,智慧城市计画不断涌现
- 产业陷阱与挑战
- 与遗留系统的整合复杂性
- 海上设备成本高 安装成本高且资料复杂
- 成长动力
- 成长潜力分析
- 波特的分析
- PESTEL分析
第四章:竞争格局
- 介绍
- 公司市占率分析
- 竞争定位矩阵
- 战略展望矩阵
第五章:市场估计与预测:依运输方式,2021 - 2034 年
- 主要趋势
- 轨
- 路
- 空气
- 海洋
第六章:市场估计与预测:铁路运输,2021 - 2034 年
- 主要趋势
- 成分
- 解决方案
- 轨道运输管理
- 资产管理软体
- 铁路通讯及网路
- 即时乘客资讯系统
- 铁路分析
- 服务
- 专业服务
- 安装、维护和操作
- 解决方案
- 应用
- 智慧票务
- 乘客资讯系统
- 操作与防撞
- 安全
- 紧急通知
- 其他的
第七章:市场估计与预测:依道路划分,2021 - 2034 年
- 主要趋势
- 系统
- 先进的交通管理系统(ATMS)
- 先进的旅行者资讯系统(ATIS)
- 先进运输定价系统(ATPS)
- 先进公共运输系统(APTS)
- 先进的农村交通系统(ARTS)
- 商用车辆营运(CVO)
- 成分
- 硬体
- 电信网路
- 介面板
- 感应器
- 监测检测系统
- 监视器
- 软体
- 视觉化软体
- 影片侦测管理软体
- 交通管理系统
- 其他的
- 服务
- 专业服务
- 安装、维护和操作
- 硬体
- 应用
- 交通管理
- 道路安全
- 货运管理
- 停车管理
- 道路使用者收费/ETC
- 远端资讯处理
第八章:市场估计与预测:空运,2021 - 2034
- 主要趋势
- 系统
- 资讯显示系统
- 追踪和监控系统
- 自助行李系统
- 自助服务终端
- 通讯和网路
- 智慧门系统
- 其他的
- 应用
- 安全
- 智慧票务
- 公车追踪
- 机队管理(飞机管理)
- 紧急通知
- 乘客资讯
- 其他的
第九章:市场估计与预测:按船舶,2021 - 2034 年
- 主要趋势
- 系统
- 海上导航与资讯系统
- 追踪和监控系统
- 船舶交通管理系统
- 应用
- 货物运输(货柜)
- 安全和紧急通知
- 天气资讯
- 海上抵达和过境
- 其他的
第十章:市场估计与预测:按地区,2021 - 2034 年
- 北美洲
- 我们
- 加拿大
- 欧洲
- 英国
- 德国
- 法国
- 西班牙
- 义大利
- 荷兰
- 俄罗斯
- 亚太地区
- 中国
- 印度
- 日本
- 新加坡
- 澳洲
- 拉丁美洲
- 巴西
- 墨西哥
- 阿根廷
- MEA
- 阿联酋
- 沙乌地阿拉伯
- 南非
第 11 章:公司简介
- Alstom
- Cisco
- Clever Devices
- Cubic
- Embross
- ETA Transit Systems
- FURUNO ELECTRIC
- Garmin
- Indra Sistemas
- Kapsch
- Kongsberg Gruppen
- Kyosan Electric Manufacturing
- Lanner Electronics
- Nisshinbo
- Northrop Grumman
- Q-Free ASA
- Raytheon
- Siemens
- Teledyne
- Thales
- Trapeze Group
- Xerox
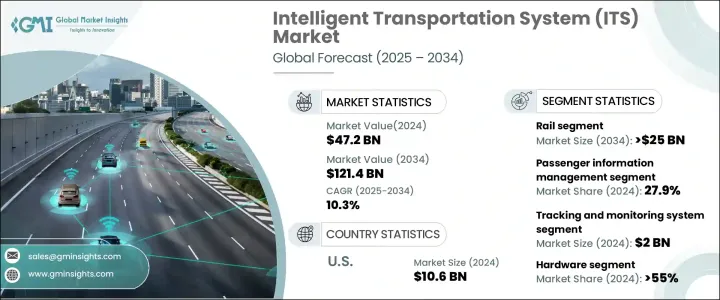
The Global Intelligent Transportation System Market reached a valuation of USD 47.2 billion in 2024 and is projected to expand at a CAGR of 10.3% from 2025 to 2034. The increasing focus on smart city development is a significant driver as urbanization continues to rise at an unprecedented rate. Cities worldwide are experiencing heightened demand for sustainable, efficient, and safer mobility solutions. As the global population shifts towards urban areas, digital advancements in transportation infrastructure are essential for optimizing traffic flow, reducing congestion, and improving public transit efficiency.
ITS solutions integrate advanced traffic management, real-time data analytics, interconnectivity, and public transit operations to streamline urban mobility. With growing environmental concerns, new technologies are being incorporated to support electric vehicles, shared transportation, and lower emissions. Urban expansion is expected to add millions of new vehicles to roads, challenging existing transport systems and requiring innovative solutions to maintain sustainability. The adoption of smart IoT, AI, and analytical technologies is redefining urban mobility by integrating multiple modes of transportation into seamless, multimodal networks. Real-time information systems allow travelers to access schedules, traffic updates, and alternate routes, enhancing efficiency and convenience. As cities implement policies promoting digital mobility ecosystems, investments in ITS continue to grow, driving the demand for safer and more sustainable urban transportation solutions.
| Market Scope | |
|---|---|
| Start Year | 2024 |
| Forecast Year | 2025-2034 |
| Start Value | $47.2 Billion |
| Forecast Value | $121.4 Billion |
| CAGR | 10.3% |
The market is segmented by mode of transportation, including rail, road, air, and marine. In 2024, the rail sector accounted for over 40% of the market share, while the road segment is forecast to exceed USD 25 billion by 2034. Governments are issuing high-value tenders for roadway enhancements, prioritizing infrastructure upgrades to accommodate increasing traffic volumes. These projects focus on improving intersections, rehabilitating roadways, and deploying real-time monitoring systems to enhance traffic management and mitigate congestion.
Within the railway segment, applications include smart ticketing, passenger information management, operations, security, emergency notifications, and collision avoidance. Passenger information management accounted for a 27.9% market share in 2024, while smart ticketing is projected to grow at a CAGR of 13% by 2034. Enhanced digital transformation efforts in transportation are leveraging real-time communication technologies, in-train computing systems, GPS tracking, and cloud-based information platforms to improve passenger experience and operational efficiency.
The air transportation segment includes information display systems, tracking and monitoring systems, self-service baggage solutions, kiosks, communication networks, and smart gates. Tracking and monitoring solutions led the market in 2024 with a valuation of USD 2 billion. The integration of GPS and IoT has revolutionized aviation by enabling real-time tracking of aircraft, passengers, and baggage. Enhanced situational awareness improves safety, operational efficiency, and asset management, ensuring seamless airline and airport operations.
The road transportation market is categorized into hardware, software, and services. In 2024, the hardware segment dominated, with a market share exceeding 55%. The adoption of GPS units, sensors, high-definition cameras, and ruggedized IoT devices has improved connectivity and operational reliability. Edge computing enables data processing within vehicles, enhancing efficiency and passenger safety.
In North America, the United States led the ITS market with a revenue of USD 10.6 billion in 2024. Public transit systems are increasingly adopting shared mobility services, integrating bike-sharing, e-scooters, and ride-sharing into multimodal transport networks. Contactless ticketing systems have been widely implemented, enabling seamless fare payments through smartphones, smart cards, and digital wallets. These advancements are enhancing urban mobility by reducing congestion, improving transit efficiency, and providing a more connected transportation experience.
Table of Contents
Chapter 1 Methodology & Scope
- 1.1 Research design
- 1.1.1 Research approach
- 1.1.2 Data collection methods
- 1.2 Base estimates & calculations
- 1.2.1 Base year calculation
- 1.2.2 Key trends for market estimation
- 1.3 Forecast model
- 1.4 Primary research and validation
- 1.4.1 Primary sources
- 1.4.2 Data mining sources
- 1.5 Market scope & definition
Chapter 2 Executive Summary
- 2.1 Industry synopsis, 2021 - 2034
Chapter 3 Industry Insights
- 3.1 Industry ecosystem analysis
- 3.1.1 Raw material suppliers
- 3.1.2 Component suppliers
- 3.1.3 Manufacturers
- 3.1.4 Technology/software providers
- 3.1.5 System integrators
- 3.1.6 Service providers
- 3.1.7 Government agencies
- 3.1.8 Financial authorities
- 3.2 Supplier landscape
- 3.3 Profit margin analysis
- 3.4 Technology & innovation landscape
- 3.5 Patent analysis
- 3.6 Key news & initiatives
- 3.7 Regulatory landscape
- 3.8 Impact forces
- 3.8.1 Growth drivers
- 3.8.1.1 Government funding and PPP models
- 3.8.1.2 Demand for Pay-as-you-go ticketing service among commuters in Europe and North America
- 3.8.1.3 Rise in favorable government initiatives for effective traffic management in North America and Asia Pacific
- 3.8.1.4 Growing investment in railway infrastructure in Europe
- 3.8.1.5 Rapidly growing urbanization and rising smart city projects in Asia Pacific
- 3.8.2 Industry pitfalls & challenges
- 3.8.2.1 Integration complexities with legacy systems
- 3.8.2.2 High cost of maritime equipment High installation cost and data complexity
- 3.8.1 Growth drivers
- 3.9 Growth potential analysis
- 3.10 Porter's analysis
- 3.11 PESTEL analysis
Chapter 4 Competitive Landscape, 2024
- 4.1 Introduction
- 4.2 Company market share analysis
- 4.3 Competitive positioning matrix
- 4.4 Strategic outlook matrix
Chapter 5 Market Estimates & Forecast, By Mode of Transport, 2021 - 2034 ($Bn)
- 5.1 Key trends
- 5.2 Rail
- 5.3 Road
- 5.4 Air
- 5.5 Marine
Chapter 6 Market Estimates & Forecast, By Rail, 2021 - 2034 ($Bn)
- 6.1 Key trends
- 6.2 Component
- 6.2.1 Solution
- 6.2.1.1 Rail traffic management
- 6.2.1.2 Asset management software
- 6.2.1.3 Rail communication and networking
- 6.2.1.4 Real-time passenger information system
- 6.2.1.5 Rail analytics
- 6.2.2 Services
- 6.2.2.1 Professional services
- 6.2.2.2 Installation, maintenance, and operation
- 6.2.1 Solution
- 6.3 Application
- 6.3.1 Smart ticketing
- 6.3.2 Passenger information system
- 6.3.3 Operation & collision avoidance
- 6.3.4 Security
- 6.3.5 Emergency notification
- 6.3.6 Others
Chapter 7 Market Estimates & Forecast, By Road, 2021 - 2034 ($Bn)
- 7.1 Key trends
- 7.2 System
- 7.2.1 Advanced traffic management system (ATMS)
- 7.2.2 Advanced traveler information system (ATIS)
- 7.2.3 Advanced transportation pricing system (ATPS)
- 7.2.4 Advanced public transport system (APTS)
- 7.2.5 Advanced rural transportation system (ARTS)
- 7.2.6 Commercial vehicle operation (CVO)
- 7.3 Component
- 7.3.1 Hardware
- 7.3.1.1 Telecommunication network
- 7.3.1.2 Interface boards
- 7.3.1.3 Sensors
- 7.3.1.4 Monitoring & detection system
- 7.3.1.5 Surveillance camera
- 7.3.2 Software
- 7.3.2.1 Visualization software
- 7.3.2.2 Video detection management software
- 7.3.2.3 Transit management system
- 7.3.2.4 Others
- 7.3.3 Services
- 7.3.3.1 Professional services
- 7.3.3.2 Installation, maintenance, and operation
- 7.3.1 Hardware
- 7.4 Application
- 7.4.1 Traffic management
- 7.4.2 Road safety
- 7.4.3 Freight management
- 7.4.4 Parking management
- 7.4.5 Road user charging/ETC
- 7.5 Telematics
Chapter 8 Market Estimates & Forecast, By Air, 2021 - 2034 ($Bn)
- 8.1 Key trends
- 8.2 System
- 8.2.1 Information display system
- 8.2.2 Tracking and monitoring system
- 8.2.3 Self-service baggage system
- 8.2.4 Kiosks
- 8.2.5 Communication and networking
- 8.2.6 Smart gate system
- 8.2.7 Others
- 8.3 Application
- 8.3.1 Security
- 8.3.2 Smart ticketing
- 8.3.3 Bus tracking
- 8.3.4 Fleet management (aircraft management)
- 8.3.5 Emergency notification
- 8.3.6 Passenger information
- 8.3.7 Others
Chapter 9 Market Estimates & Forecast, By Marine, 2021 - 2034 ($Bn)
- 9.1 Key trends
- 9.2 System
- 9.2.1 Maritime navigation and information system
- 9.2.2 Tracking and monitoring system
- 9.2.3 Vessel traffic management system
- 9.3 Application
- 9.3.1 Freight movement (container)
- 9.3.2 Security and emergency notification
- 9.3.3 Weather information
- 9.3.4 Marine arrival and transit
- 9.3.5 Others
Chapter 10 Market Estimates & Forecast, By Region, 2021 - 2034 ($Bn)
- 10.1 North America
- 10.1.1 U.S.
- 10.1.2 Canada
- 10.2 Europe
- 10.2.1 UK
- 10.2.2 Germany
- 10.2.3 France
- 10.2.4 Spain
- 10.2.5 Italy
- 10.2.6 Netherlands
- 10.2.7 Russia
- 10.3 Asia Pacific
- 10.3.1 China
- 10.3.2 India
- 10.3.3 Japan
- 10.3.4 Singapore
- 10.3.5 Australia
- 10.4 Latin America
- 10.4.1 Brazil
- 10.4.2 Mexico
- 10.4.3 Argentina
- 10.5 MEA
- 10.5.1 UAE
- 10.5.2 Saudi Arabia
- 10.5.3 South Africa
Chapter 11 Company Profiles
- 11.1 Alstom
- 11.2 Cisco
- 11.3 Clever Devices
- 11.4 Cubic
- 11.5 Embross
- 11.6 ETA Transit Systems
- 11.7 FURUNO ELECTRIC
- 11.8 Garmin
- 11.9 Indra Sistemas
- 11.10 Kapsch
- 11.11 Kongsberg Gruppen
- 11.12 Kyosan Electric Manufacturing
- 11.13 Lanner Electronics
- 11.14 Nisshinbo
- 11.15 Northrop Grumman
- 11.16 Q-Free ASA
- 11.17 Raytheon
- 11.18 Siemens
- 11.19 Teledyne
- 11.20 Thales
- 11.21 Trapeze Group
- 11.22 Xerox
 智慧交通系统可变显示器市场 - 全球产业规模、份额、趋势、机会及预测(按组件、技术、应用、地区和竞争格局划分),2021-2031年
 智慧交通解决方案市场按组件、解决方案、部署类型、应用和最终用户划分 - 全球预测 2026-2032
 日本智慧交通系统市场报告:按产品、通讯协定、运输方式、应用和地区划分(2026-2034年)
 公共运输市场规模、份额和成长分析(按推进类型、模式、出行方式、通路管道、应用、最终用户和地区划分)-2026-2033年产业预测
 道路智慧型运输系统(ITS)市场规模、份额和趋势分析报告:按产品、系统类型、应用、地区和细分市场预测(2025-2033 年)
 全球智慧公共交通市场:预测(至2032年)-依交通途径、解决方案类型、部署方式、技术、最终使用者和地区进行分析
 大气运输系统:全球市场份额和排名、总收入和需求预测(2025-2031年)
 全球自动驾驶公共运输市场:机会与策略展望(至2034年)2032 年交通运输系统市场预测:按服务类型、系统类型、运输方式、最终用户和地区进行的全球分析2032 年智慧型运输系统市场预测:按产品、系统、交通途径、应用和地区分類的全球分析