


 |
市场调查报告书
商品编码
1699369
翻新电脑及笔记型电脑市场机会、成长动力、产业趋势分析及 2025-2034 年预测Refurbished Computers and Laptops Market Opportunity, Growth Drivers, Industry Trend Analysis, and Forecast 2025-2034 |
||||||
2024 年全球翻新电脑和笔记型电脑市场规模达到 54 亿美元,预计 2025 年至 2034 年的复合年增长率为 5.9%。随着消费者和企业寻求减少电子垃圾的方法,对环境永续性的日益关注是一个主要驱动力。人们越来越重视具有成本效益的技术解决方案,这也刺激了需求,翻新设备可以以极低的价格提供高性能。越来越多的公司和机构选择翻新电脑和笔记型电脑来降低成本并保持效率。改进的翻新技术和品质检查进一步增强了消费者的信任,使这些产品成为新设备的可行替代品。
2024 年,甲级办公室市场营收为 25.8 亿美元,预计复合年增长率为 6.1%。这些设备使用频率很低,并经过严格的品质检查,以确保其功能与新品一样,因此在註重预算的买家中非常受欢迎。 A 级产品的吸引力在于其磨损极小,使其成为全新电脑的经济高效且可靠的替代品。寻求高性能且价格不菲的设备的企业和专业人士更青睐 A 级设备,从而推动了该领域稳定的需求。配备更新软体和延长保固期的高品质翻新笔记型电脑和桌上型电脑的上市进一步增强了消费者信心。
| 市场范围 | |
|---|---|
| 起始年份 | 2024 |
| 预测年份 | 2025-2034 |
| 起始值 | 54亿美元 |
| 预测值 | 57亿美元 |
| 复合年增长率 | 5.9% |
间接分销管道部分在 2024 年占据 68.4% 的份额,预计到 2034 年将成长 5.8%。线上平台和第三方零售商让消费者更容易获得经过认证的翻新电脑和笔记型电脑,提供便利和有竞争力的价格。这些平台透过提供保固、退货选项和品质认证来确保产品符合高标准。许多企业、教育机构和政府机构喜欢从批发商和零售商处购买,因为大量订单有折扣且可靠。间接卖家的营运成本降低意味着更好的定价和促销优惠,从而使翻新设备对买家更具吸引力。
北美翻新电脑和笔记型电脑市场占有 31.6% 的份额,2024 年创造了 17 亿美元的产值。消费者意识的提高和对经济高效的 IT 解决方案的需求不断增长推动了该地区市场的成长。企业、学校和个人消费者认识到翻新电子产品的价值,从而促进了其广泛应用。强大的分销网络和值得信赖的线上平台使买家可以轻鬆找到高品质、经过认证的翻新设备。随着人们越来越关注永续性和可负担性,北美仍然是翻新电脑和笔记型电脑的主要市场。
目录
第一章:方法论与范围
- 研究设计
- 研究方法
- 资料收集方法
- 基础估算与计算
- 基准年计算
- 市场估计的主要趋势
- 预测模型
- 初步研究与验证
- 主要来源
- 资料探勘来源
- 市场定义
第二章:执行摘要
第三章:行业洞察
- 产业生态系统分析
- 供应商概况
- 定价分析
- 技术与创新格局
- 重要新闻和倡议
- 监管格局
- 製造商
- 经销商
- 零售商
- 衝击力
- 成长动力
- 永续性和环保意识
- 新兴市场需求不断成长
- 产业陷阱与挑战
- 对品质和可靠性的认知
- 供应链挑战
- 成长动力
- 成长潜力分析
- 消费者购买行为
- 波特的分析
- PESTEL分析
第四章:竞争格局
- 介绍
- 公司市占率分析
- 竞争定位矩阵
- 战略展望矩阵
第五章:市场估计与预测:依等级,2021 年至 2034 年(十亿美元)
- 主要趋势
- A级
- B级
- C 级
- D级
第六章:市场估计与预测:按作业系统,2021 - 2034 年(十亿美元)
- 主要趋势
- Windows 翻新电脑和笔记型电脑
- Mac 翻新电脑和笔记型电脑
第七章:市场估计与预测:按萤幕尺寸,2021 - 2034 年(十亿美元)
- 主要趋势
- 11-13英寸
- 14-16英寸
- 17吋以上
第八章:市场估计与预测:按最终用途,2021 - 2034 年(十亿美元)
- 主要趋势
- 个人消费者
- 企业
- 其他的
第九章:市场估计与预测:按配销通路,2021 - 2034 年(十亿美元)
- 主要趋势
- 直接的
- 间接
第十章:市场估计与预测:按地区,2021 - 2034 年(十亿美元)
- 主要趋势
- 北美洲
- 我们
- 加拿大
- 欧洲
- 英国
- 德国
- 法国
- 义大利
- 西班牙
- 俄罗斯
- 亚太地区
- 中国
- 印度
- 日本
- 澳洲
- 韩国
- 拉丁美洲
- 巴西
- 墨西哥
- 阿根廷
- MEA
- 阿联酋
- 南非
- 沙乌地阿拉伯
第 11 章:公司简介
- Acer
- Amazon Renewed
- Apple
- Arrow Direct
- ASUS
- Back Market
- Best Buy
- Blair Tech
- Dell
- Gazelle
- HP
- Lenovo
- Microsoft
- Samsung
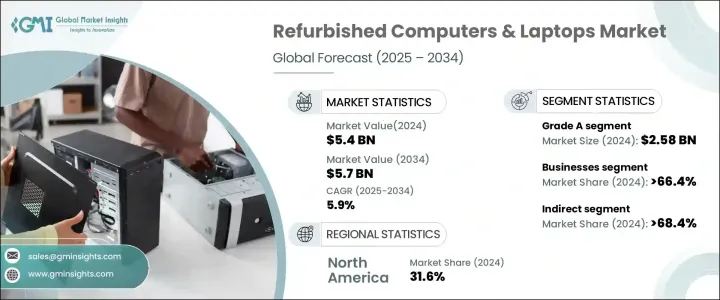
The Global Refurbished Computers and Laptops Market reached USD 5.4 billion in 2024 and is expected to exhibit a CAGR of 5.9% from 2025 to 2034. Rising concerns about environmental sustainability are a major driver as consumers and businesses look for ways to reduce electronic waste. The growing emphasis on cost-effective technology solutions has also fueled demand, with refurbished devices offering high performance at a fraction of the price. Companies and institutions are increasingly opting for refurbished computers and laptops to cut costs while maintaining efficiency. Improved refurbishment techniques and quality checks have further strengthened consumer trust, making these products a viable alternative to new devices.
The Grade A segment generated USD 2.58 billion in 2024 and is anticipated to grow at a CAGR of 6.1%. These devices are lightly used and undergo rigorous quality checks to ensure they function like new, making them highly desirable among budget-conscious buyers. The appeal of Grade A products lies in their minimal wear and tear, making them a cost-effective yet reliable alternative to brand-new computers. Businesses and professionals seeking high-performance devices without the premium price tag prefer Grade A options, driving steady demand in this segment. The availability of high-quality refurbished laptops and desktops with updated software and extended warranties further strengthens consumer confidence.
| Market Scope | |
|---|---|
| Start Year | 2024 |
| Forecast Year | 2025-2034 |
| Start Value | $5.4 Billion |
| Forecast Value | $5.7 Billion |
| CAGR | 5.9% |
Indirect distribution channels segment held a 68.4% share in 2024, with expected growth of 5.8% through 2034. Online platforms and third-party retailers have made it easier for consumers to access certified refurbished computers and laptops, offering convenience and competitive pricing. These platforms ensure that products meet high standards by providing warranties, return options, and quality certifications. Many businesses, educational institutions, and government agencies prefer purchasing from wholesalers and retailers due to bulk order discounts and reliability. Lower operational costs for indirect sellers translate to better pricing and promotional offers, making refurbished devices more attractive to buyers.
North America Refurbished Computers & Laptops Market held a 31.6% share and generated USD 1.7 billion in 2024. High consumer awareness and increasing demand for cost-efficient IT solutions drive market growth in the region. Businesses, schools, and individual consumers recognize the value of refurbished electronics, contributing to their widespread adoption. Strong distribution networks and trusted online platforms make it easy for buyers to find high-quality, certified refurbished devices. With a growing focus on sustainability and affordability, North America remains a key market for refurbished computers and laptops.
Table of Contents
Chapter 1 Methodology & Scope
- 1.1 Research design
- 1.1.1 Research Approach
- 1.1.2 Data collection methods
- 1.2 Base estimates and calculations
- 1.2.1 Base year calculation
- 1.2.2 Key trends for market estimates
- 1.3 Forecast model
- 1.4 Primary research & validation
- 1.4.1 Primary sources
- 1.4.2 Data mining sources
- 1.5 Market definitions
Chapter 2 Executive Summary
- 2.1 Industry synopsis, 2021 - 2034
Chapter 3 Industry Insights
- 3.1 Industry ecosystem analysis
- 3.2 Supplier Landscape
- 3.3 Pricing analysis
- 3.4 Technology & innovation landscape
- 3.5 Key news & initiatives
- 3.6 Regulatory landscape
- 3.7 Manufacturers
- 3.8 Distributors
- 3.9 Retailers
- 3.10 Impact forces
- 3.10.1 Growth drivers
- 3.10.1.1 Sustainability and environmental awareness
- 3.10.1.2 Growing demand from emerging markets
- 3.10.2 Industry pitfalls & challenges
- 3.10.2.1 Perception of quality and reliability
- 3.10.2.2 Supply chain challenges
- 3.10.1 Growth drivers
- 3.11 Growth potential analysis
- 3.12 Consumer buying behavior
- 3.13 Porter's analysis
- 3.14 PESTEL analysis
Chapter 4 Competitive Landscape, 2024
- 4.1 Introduction
- 4.2 Company market share analysis
- 4.3 Competitive positioning matrix
- 4.4 Strategic outlook matrix
Chapter 5 Market Estimates & Forecast, By Grade, 2021 - 2034 ($Bn) (Thousand Units)
- 5.1 Key trends
- 5.2 Grade A
- 5.3 Grade B
- 5.4 Grade C
- 5.5 Grade D
Chapter 6 Market Estimates & Forecast, By Operating System, 2021 - 2034 ($Bn) (Thousand Units)
- 6.1 Key trends
- 6.2 Windows refurbished computers & laptops
- 6.3 Mac refurbished computers & laptops
Chapter 7 Market Estimates & Forecast, By Screen Size, 2021 - 2034 ($Bn) (Thousand Units)
- 7.1 Key trends
- 7.2 11-13 inches
- 7.3 14-16 inches
- 7.4 17 inches and above
Chapter 8 Market Estimates & Forecast, By End Use, 2021 - 2034 ($Bn) (Thousand Units)
- 8.1 Key trends
- 8.2 Individual consumers
- 8.3 Businesses
- 8.4 Others
Chapter 9 Market Estimates & Forecast, By Distribution Channel, 2021 - 2034 ($Bn) (Thousand Units)
- 9.1 Key trends
- 9.2 Direct
- 9.3 Indirect
Chapter 10 Market Estimates & Forecast, By Region, 2021 - 2034 ($Bn) (Thousand Units)
- 10.1 Key trends
- 10.2 North America
- 10.2.1 U.S.
- 10.2.2 Canada
- 10.3 Europe
- 10.3.1 UK
- 10.3.2 Germany
- 10.3.3 France
- 10.3.4 Italy
- 10.3.5 Spain
- 10.3.6 Russia
- 10.4 Asia Pacific
- 10.4.1 China
- 10.4.2 India
- 10.4.3 Japan
- 10.4.4 Australia
- 10.4.5 South Korea
- 10.5 Latin America
- 10.5.1 Brazil
- 10.5.2 Mexico
- 10.5.3 Argentina
- 10.6 MEA
- 10.6.1 UAE
- 10.6.2 South Africa
- 10.6.3 Saudi Arabia
Chapter 11 Company Profiles
- 11.1 Acer
- 11.2 Amazon Renewed
- 11.3 Apple
- 11.4 Arrow Direct
- 11.5 ASUS
- 11.6 Back Market
- 11.7 Best Buy
- 11.8 Blair Tech
- 11.9 Dell
- 11.10 Gazelle
- 11.11 HP
- 11.12 Lenovo
- 11.13 Microsoft
- 11.14 Samsung


