


 |
市场调查报告书
商品编码
1699398
浮动离岸风能市场机会、成长动力、产业趋势分析及2025-2034年预测Floating Offshore Wind Energy Market Opportunity, Growth Drivers, Industry Trend Analysis, and Forecast 2025-2034 |
||||||
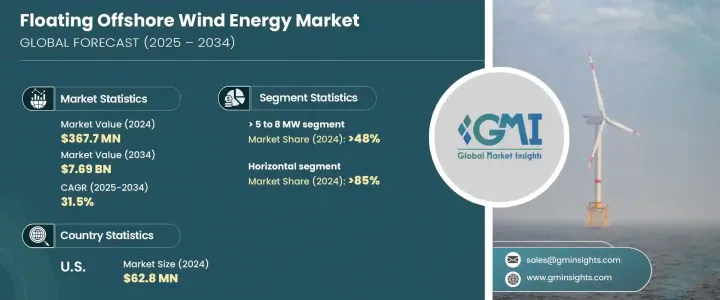
2024 年全球浮动离岸风能市场价值为 3.677 亿美元,预计 2025 年至 2034 年期间将以 31.5% 的强劲复合年增长率扩张。该市场的快速成长受到政府优惠政策的推动,包括特定技术配额、固定关税和旨在加强行业发展的竞争性拍卖。许多国家正在积极实施加速部署浮动离岸风电计画的策略,并认识到其在满足世界日益增长的再生能源解决方案需求方面的潜力。随着全球向清洁能源的转变,各国努力实现雄心勃勃的碳中和目标,对离岸风电技术的投资正获得发展动能。
浮动离岸风电技术为传统固定底部风电场面临的若干挑战提供了可行的解决方案,特别是在无法进行传统安装的深水地区。能够利用深海地区更强大、更稳定的风力资源是一项显着的优势,这使得浮动风电场成为大规模发电的一个有吸引力的选择。材料科学、涡轮机效率和浮动平台设计的不断进步有望降低成本,使全球开发商更容易获得该技术。此外,随着能源安全问题的日益严重,政府和企业越来越多地将离岸风电视为实现能源来源多样化和减少对化石燃料依赖的长期解决方案。
| 市场范围 | |
|---|---|
| 起始年份 | 2024 |
| 预测年份 | 2025-2034 |
| 起始值 | 3.677亿美元 |
| 预测值 | 76.9亿美元 |
| 复合年增长率 | 31.5% |
2024年,水平浮式离岸风力涡轮机市场将占85%的主导市场。该细分市场的领先地位可归因于其高效率、精简的生产流程和易于维护,使其成为开发商的首选。该行业正在投入大量资金进行研发,以增强浮动平台的设计和性能。随着材料和製造技术的不断改进,浮动风力涡轮机变得更具成本效益和耐用性,从而进一步推动了对这些系统的需求。
浮动离岸风能市场根据涡轮机容量进行分类,范围从 >2 MW 到 >12 MW。预计 10 至 12 MW 以上的类别将实现最快的成长,到 2034 年的复合年增长率预计将达到 54%。该行业专注于增加涡轮机的尺寸和效率,这对于降低整体能源生产成本至关重要。透过开发更高容量的涡轮机,公司可以用更少的设备产生更多的电力,从而大幅降低成本。对尖端涡轮机设计、先进控制系统和创新材料的大量投资进一步推动了这一细分市场的成长。
2024 年,北美浮动离岸风能市场创造了 6,280 万美元的收入。由于政府出台的支持性法规和鼓励再生能源计画的激励措施,该产业正在加速扩张。随着涡轮机价格下降和产业产能扩大,对浮动离岸风能的需求持续上升。美国正成为全球能源转型的关键参与者,大力投资离岸风能,以实现其再生能源目标并加强其在清洁能源领域的地位。
目录
第一章:方法论与范围
- 研究设计
- 基础估算与计算
- 预测模型
- 初步研究与验证
- 主要来源
- 资料探勘来源
- 市场定义
第二章:执行摘要
第三章:行业洞察
- 产业生态系统
- 监管格局
- 产业衝击力
- 成长动力
- 产业陷阱与挑战
- 成长潜力分析
- 价格趋势分析
- 波特的分析
- PESTEL分析
第四章:竞争格局
- 介绍
- 战略仪表板
- 创新与技术格局
第五章:市场规模及预测:以涡轮机额定功率,2021 年至 2034 年
- 主要趋势
- ≤2兆瓦
- >2至5兆瓦
- >5至8兆瓦
- >8至10兆瓦
- >10至12兆瓦
- > 12 兆瓦
第六章:市场规模及预测:按轴,2021 – 2034
- 主要趋势
- 水平的
- 逆风
- 顺风
- 垂直的
第七章:市场规模及预测:依组件划分,2021 年至 2034 年
- 主要趋势
- 刀刃
- 塔
- 其他的
第八章:市场规模及预测:依深度,2021 年至 2034 年
- 主要趋势
- ≤ 30 米
- >30 米至 ≤ 50 米
- > 50米
第九章:市场规模及预测:依地区,2021 年至 2034 年
- 主要趋势
- 北美洲
- 我们
- 加拿大
- 欧洲
- 德国
- 英国
- 法国
- 瑞典
- 波兰
- 丹麦
- 葡萄牙
- 爱尔兰
- 比利时
- 亚太地区
- 中国
- 印度
- 日本
- 韩国
- 越南
- 世界其他地区
第十章:公司简介
- Equinor ASA
- General Electric
- Global Energy (Group) Limited
- Hexicon
- Nexans
- Ørsted
- Prysmian Group
- RWE
- Sumitomo Electric Industries
- Simply Blue Group
- Siemens Gamesa Renewable Energy
- Vattenfall AB
- Vestas
The Global Floating Offshore Wind Energy Market was valued at USD 367.7 million in 2024 and is projected to expand at a robust CAGR of 31.5% from 2025 to 2034. The market's rapid growth is fueled by favorable government policies, including technology-specific quotas, set tariffs, and competitive auctions designed to strengthen the industry. Many countries are actively implementing strategies to accelerate the deployment of floating offshore wind projects, recognizing their potential in addressing the world's increasing demand for renewable energy solutions. With the global shift toward clean energy, investments in offshore wind technology are gaining momentum as nations strive to meet ambitious carbon neutrality goals.
Floating offshore wind technology presents a viable solution to several challenges associated with traditional fixed-bottom wind farms, particularly in regions with deep waters where conventional installations are not feasible. The ability to harness stronger and more consistent wind resources in deep-sea locations is a significant advantage, making floating wind farms an attractive option for large-scale power generation. Continuous advancements in material sciences, turbine efficiency, and floating platform designs are expected to drive down costs, making the technology more accessible to developers worldwide. Additionally, as energy security concerns grow, governments and corporations are increasingly looking toward offshore wind as a long-term solution to diversify energy sources and reduce dependency on fossil fuels.
| Market Scope | |
|---|---|
| Start Year | 2024 |
| Forecast Year | 2025-2034 |
| Start Value | $367.7 Million |
| Forecast Value | $7.69 Billion |
| CAGR | 31.5% |
In 2024, the horizontal floating offshore wind turbine segment accounted for a dominant market share of 85%. This segment's leadership can be attributed to its high efficiency, streamlined production processes, and ease of maintenance, making it a preferred choice for developers. The sector is witnessing significant investment in research and development to enhance floating platform design and performance. With continuous improvements in materials and manufacturing techniques, floating wind turbines are becoming more cost-effective and durable, driving further demand for these systems.
The floating offshore wind energy market is categorized based on turbine capacity, with segments ranging from >2 MW to >12 MW. The >10 to 12 MW category is expected to register the fastest growth, projected at a CAGR of 54% through 2034. The industry's focus on increasing turbine size and efficiency is critical in lowering overall energy production costs. By developing higher-capacity turbines, companies can generate more electricity with fewer units, leading to substantial cost reductions. Significant investments in cutting-edge turbine designs, advanced control systems, and innovative materials are further propelling this market segment's growth.
North America floating offshore wind energy market generated USD 62.8 million in 2024. The sector is experiencing accelerated expansion due to supportive government regulations and incentives promoting renewable energy projects. As turbine prices decline and industry capacity expands, demand for floating offshore wind energy continues to rise. The United States is emerging as a key player in the global energy transition, investing heavily in offshore wind energy to meet its renewable energy targets and strengthen its position in the clean energy landscape.
Table of Contents
Chapter 1 Methodology & Scope
- 1.1 Research design
- 1.2 Base estimates & calculations
- 1.3 Forecast model
- 1.4 Primary research & validation
- 1.4.1 Primary sources
- 1.4.2 Data mining sources
- 1.5 Market definitions
Chapter 2 Executive Summary
- 2.1 Industry 3600 synopsis, 2021 – 2034
Chapter 3 Industry Insights
- 3.1 Industry ecosystem
- 3.2 Regulatory landscape
- 3.3 Industry impact forces
- 3.3.1 Growth drivers
- 3.3.2 Industry pitfalls & challenges
- 3.4 Growth potential analysis
- 3.5 Price trend analysis
- 3.6 Porter's analysis
- 3.6.1 Bargaining power of suppliers
- 3.6.2 Bargaining power of buyers
- 3.6.3 Threat of new entrants
- 3.6.4 Threat of substitutes
- 3.7 PESTEL analysis
Chapter 4 Competitive landscape, 2024
- 4.1 Introduction
- 4.2 Strategic dashboard
- 4.3 Innovation & technology landscape
Chapter 5 Market Size and Forecast, By Turbine Rating, 2021 – 2034 (USD Million & MW)
- 5.1 Key trends
- 5.2 ≤ 2 MW
- 5.3 >2 to 5 MW
- 5.4 >5 to 8 MW
- 5.5 >8 to 10 MW
- 5.6 >10 to 12 MW
- 5.7 > 12 MW
Chapter 6 Market Size and Forecast, By Axis, 2021 – 2034 (USD Million & MW)
- 6.1 Key trends
- 6.2 Horizontal
- 6.2.1 Up-wind
- 6.2.2 Downwind
- 6.3 Vertical
Chapter 7 Market Size and Forecast, By Component, 2021 – 2034 (USD Million & MW)
- 7.1 Key trends
- 7.2 Blade
- 7.3 Tower
- 7.4 Others
Chapter 8 Market Size and Forecast, By Depth, 2021 – 2034 (USD Million & MW)
- 8.1 Key trends
- 8.2 ≤ 30 m
- 8.3 >30 m to ≤ 50 m
- 8.4 > 50 m
Chapter 9 Market Size and Forecast, By Region, 2021 – 2034 (USD Million & MW)
- 9.1 Key trends
- 9.2 North America
- 9.2.1 U.S.
- 9.2.2 Canada
- 9.3 Europe
- 9.3.1 Germany
- 9.3.2 UK
- 9.3.3 France
- 9.3.4 Sweden
- 9.3.5 Poland
- 9.3.6 Denmark
- 9.3.7 Portugal
- 9.3.8 Ireland
- 9.3.9 Belgium
- 9.4 Asia Pacific
- 9.4.1 China
- 9.4.2 India
- 9.4.3 Japan
- 9.4.4 South Korea
- 9.4.5 Vietnam
- 9.5 Rest of World
Chapter 10 Company Profiles
- 10.1 Equinor ASA
- 10.2 General Electric
- 10.3 Global Energy (Group) Limited
- 10.4 Hexicon
- 10.5 Nexans
- 10.6 Ørsted
- 10.7 Prysmian Group
- 10.8 RWE
- 10.9 Sumitomo Electric Industries
- 10.10 Simply Blue Group
- 10.11 Siemens Gamesa Renewable Energy
- 10.12 Vattenfall AB
- 10.13 Vestas
 浮体式海上风电市场:按组件、涡轮机功率、水深、技术、应用和发展阶段划分-2026-2032年全球市场预测
 2026年全球浮体式海上电市场报告2026年全球浮体式海上风力发电市场报告
 浮体式海上风电市场-2026-2031年预测
 全球浮体式海上风电系统市场:预测至2032年-按组件、平台类型、风扇容量、水深、轴线、应用、最终用户及地区进行分析
 海上漂浮式风电:全球市场份额和排名、总收入和需求预测(2025-2031年)
 全球浮体式海上风力发电市场
 浮体式海上风电:市场份额分析、行业趋势、统计数据和成长预测(2025-2030 年)
 浮动离岸风电市场-全球产业规模、份额、趋势、机会和预测,按水深(浅水、过渡水域和深水)、按涡轮机容量、按地区、按竞争细分,2020-2030 年亚太地区浮体式海上风电:市场占有率分析、产业趋势与成长预测(2025-2030)