


 |
市场调查报告书
商品编码
1708236
自动驾驶公车软体市场机会、成长动力、产业趋势分析及 2025 - 2034 年预测Autonomous Bus Software Market Opportunity, Growth Drivers, Industry Trend Analysis, and Forecast 2025 - 2034 |
||||||
2024 年全球自动驾驶公车软体市场价值为 8.551 亿美元,预计将大幅成长,2025 年至 2034 年的复合年增长率预计为 24.2%。强劲的市场扩张主要受到共享旅游和按需交通服务需求激增的推动。随着消费者越来越寻求灵活、经济高效的出行解决方案,自动驾驶公车应运而生。这些公车透过调整路线来适应不断变化的乘客需求,这与依赖固定路径的传统公共交通系统不同。这种适应性确保乘客获得更便利、更实惠的交通选择,使自动驾驶公车成为城市交通的理想选择。
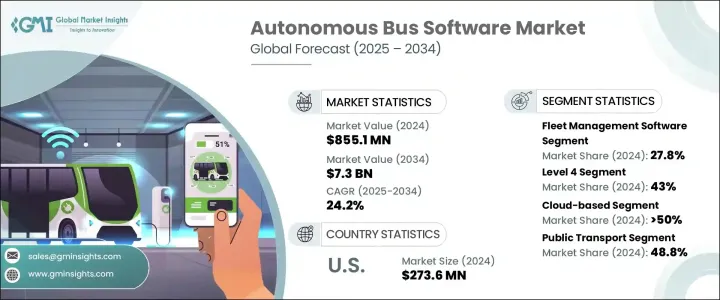
自动驾驶公车软体市场根据功能进行分类,包括车队管理、自动驾驶、交通管理、乘客管理、安全保障以及公车路线设计。 2024 年,车队管理软体领域占据 27.8% 的市场。该软体对于提升自动驾驶公车的营运效率至关重要。透过即时远端监控、基于物联网的维护预测、燃料消耗追踪和路线优化,车队管理系统使公车营运商能够提高生产力、最大限度地减少停机时间并确保更顺畅的营运。
| 市场范围 | |
|---|---|
| 起始年份 | 2024 |
| 预测年份 | 2025-2034 |
| 起始值 | 8.551亿美元 |
| 预测值 | 73亿美元 |
| 复合年增长率 | 24.2% |
此外,自动驾驶公车软体市场按自动化等级细分为 3 级、4 级和 5 级自动化。 2024 年,4 级自动驾驶公车占了 43% 的市场。这些公车在预定区域内(例如商业区或智慧城市)完全自动驾驶。它们利用先进的人工智慧 (AI)、机器学习和预测分析来应对不同的道路状况和交通模式,使其非常适合城市环境。随着人工智慧技术的不断完善,4 级自动驾驶公车的普及率预计将激增,尤其是在人口稠密的大都市地区。
2024 年,北美自动驾驶公车软体市场占全球市场份额的 38%。该地区对自动驾驶技术的投资,加上政府的支持政策,正在加速自动驾驶公车的开发和部署。一些城市已经启动了试点计画并取得了可喜的成果,预计将推动自动驾驶公车系统的更广泛应用。随着这些公车越来越融入公共交通,它们有可能减少排放,缓解交通拥堵,提高城市交通的整体效率,符合更永续、更智慧的交通系统的大趋势。
目录
第一章:方法论与范围
- 研究设计
- 研究方法
- 资料收集方法
- 基础估算与计算
- 基准年计算
- 市场估计的主要趋势
- 预测模型
- 初步研究与验证
- 主要来源
- 资料探勘来源
- 市场定义
第二章:执行摘要
第三章:行业洞察
- 产业生态系统分析
- 供应商格局
- OEM
- 软体供应商
- 云端服务供应商
- 系统整合商
- 最终用途
- 利润率分析
- 技术与创新格局
- 专利分析
- 重要新闻和倡议
- 监管格局
- 衝击力
- 成长动力
- 共享出行和按需交通的需求不断增长
- 改善安全和交通管理
- 公众意识和接受度不断提高
- 人们对自动驾驶汽车的兴趣日益浓厚
- 产业陷阱与挑战
- 监管和法律挑战
- 开发和营运成本高
- 成长动力
- 成长潜力分析
- 波特的分析
- PESTEL分析
第四章:竞争格局
- 介绍
- 公司市占率分析
- 竞争定位矩阵
- 战略展望矩阵
第五章:市场估计与预测:依功能划分,2021 - 2034 年
- 主要趋势
- 车队管理软体
- 自动驾驶
- 交通管理
- 乘客管理
- 安全与保障
- 公车线路设计
第六章:市场估计与预测:依自动化程度,2021 - 2034 年
- 主要趋势
- 3级
- 4级
- 5级
第七章:市场估计与预测:依部署模型,2021 - 2034 年
- 主要趋势
- 本地
- 基于云端
- 杂交种
第八章:市场估计与预测:按应用,2021 - 2034 年
- 主要趋势
- 大众运输
- 校园和公司接驳车
- 机场接驳车
- 其他的
第九章:市场估计与预测:依最终用途,2021 - 2034 年
- 主要趋势
- 大众运输部门
- 私营运输业者
- 企业车队
第十章:市场估计与预测:按地区,2021 - 2034 年
- 主要趋势
- 北美洲
- 我们
- 加拿大
- 欧洲
- 英国
- 德国
- 法国
- 西班牙
- 义大利
- 俄罗斯
- 北欧人
- 亚太地区
- 中国
- 印度
- 日本
- 韩国
- 澳新银行
- 东南亚
- 拉丁美洲
- 巴西
- 墨西哥
- 阿根廷
- MEA
- 阿联酋
- 南非
- 沙乌地阿拉伯
第 11 章:公司简介
- Aurora
- Baidu Apollo
- EasyMile
- Imagry
- ioki
- Karsan
- LILEE Systems
- May Mobility
- Mobileye
- Navya
- NVIDIA
- Oxa
- T-Hive
- Via Transportation
- Volvo Bus
The Global Autonomous Bus Software Market was valued at USD 855.1 million in 2024 and is projected to witness substantial growth, with an expected CAGR of 24.2% from 2025 to 2034. This robust market expansion is primarily driven by the surging demand for shared mobility and on-demand transportation services. As consumers increasingly seek flexible, cost-effective travel solutions, autonomous buses emerge as a perfect response. These buses adapt to shifting passenger demands by adjusting routes, unlike traditional public transit systems that rely on fixed paths. This adaptability ensures that passengers receive more convenient and affordable transportation options, positioning autonomous buses as an ideal choice for urban mobility.
The market for autonomous bus software is categorized based on functionality, which includes fleet management, autonomous driving, traffic management, passenger management, safety and security, and bus route design. In 2024, the fleet management software segment accounted for a 27.8% market share. This software is essential in enhancing the operational efficiency of self-driving buses. Through real-time remote monitoring, IoT-based maintenance forecasting, fuel consumption tracking, and route optimization, fleet management systems enable bus operators to boost productivity, minimize downtime, and ensure smoother operations.
| Market Scope | |
|---|---|
| Start Year | 2024 |
| Forecast Year | 2025-2034 |
| Start Value | $855.1 Million |
| Forecast Value | $7.3 Billion |
| CAGR | 24.2% |
Further, the autonomous bus software market is segmented by automation levels-Level 3, Level 4, and Level 5 automation. The Level 4 autonomous buses held 43% of the market share in 2024. These buses are fully autonomous within predefined areas, such as business districts or smart cities. They leverage advanced artificial intelligence (AI), machine learning, and predictive analytics to navigate through varying road conditions and traffic patterns, making them highly suitable for urban environments. With the continued refinement of AI technologies, the adoption of Level 4 autonomous buses is expected to surge, especially in densely populated metropolitan areas.
North America Autonomous Bus Software Market accounted for 38% of the global market share in 2024. The region's investments in autonomous technology, coupled with supportive government policies, are accelerating the development and deployment of self-driving buses. Several cities are already launching pilot projects with promising results, which are expected to fuel the wider adoption of autonomous bus systems. As these buses become more integrated into public transportation, they offer the potential to reduce emissions, alleviate traffic congestion, and improve overall efficiency in urban mobility, aligning with the broader trend toward more sustainable, smart transportation systems.
Table of Contents
Chapter 1 Methodology & Scope
- 1.1 Research design
- 1.1.1 Research approach
- 1.1.2 Data collection methods
- 1.2 Base estimates and calculations
- 1.2.1 Base year calculation
- 1.2.2 Key trends for market estimates
- 1.3 Forecast model
- 1.4 Primary research & validation
- 1.4.1 Primary sources
- 1.4.2 Data mining sources
- 1.5 Market definitions
Chapter 2 Executive Summary
- 2.1 Industry 360º synopsis, 2021 - 2034
Chapter 3 Industry Insights
- 3.1 Industry ecosystem analysis
- 3.2 Supplier landscape
- 3.2.1 OEM
- 3.2.2 Software provider
- 3.2.3 Cloud service providers
- 3.2.4 System integrators
- 3.2.5 End Use
- 3.3 Profit margin analysis
- 3.4 Technology & innovation landscape
- 3.5 Patent analysis
- 3.6 Key news & initiatives
- 3.7 Regulatory landscape
- 3.8 Impact forces
- 3.8.1 Growth drivers
- 3.8.1.1 Rising demand for shared mobility and on-demand transport
- 3.8.1.2 Improved safety and traffic management
- 3.8.1.3 Growing public awareness and acceptance
- 3.8.1.4 Rising interest in autonomous vehicles
- 3.8.2 Industry pitfalls & challenges
- 3.8.2.1 Regulatory and legal challenges
- 3.8.2.2 High development and operational costs
- 3.8.1 Growth drivers
- 3.9 Growth potential analysis
- 3.10 Porter's analysis
- 3.11 PESTEL analysis
Chapter 4 Competitive Landscape, 2024
- 4.1 Introduction
- 4.2 Company market share analysis
- 4.3 Competitive positioning matrix
- 4.4 Strategic outlook matrix
Chapter 5 Market Estimates & Forecast, By Functionality, 2021 - 2034 ($Bn)
- 5.1 Key trends
- 5.2 Fleet management software
- 5.3 Autonomous driving
- 5.4 Traffic management
- 5.5 Passenger management
- 5.6 Safety & security
- 5.7 Bus route design
Chapter 6 Market Estimates & Forecast, By Level of Automation, 2021 - 2034 ($Bn)
- 6.1 Key trends
- 6.2 Level 3
- 6.3 Level 4
- 6.4 Level 5
Chapter 7 Market Estimates & Forecast, By Deployment Model, 2021 - 2034 ($Bn)
- 7.1 Key trends
- 7.2 On-premises
- 7.3 Cloud-based
- 7.4 Hybrid
Chapter 8 Market Estimates & Forecast, By Application, 2021 - 2034 ($Bn)
- 8.1 Key trends
- 8.2 Public transport
- 8.3 Campus and corporate shuttles
- 8.4 Airport shuttles
- 8.5 Others
Chapter 9 Market Estimates & Forecast, By End Use, 2021 - 2034 ($Bn)
- 9.1 Key trends
- 9.2 Public transportation authorities
- 9.3 Private transport operators
- 9.4 Corporate fleets
Chapter 10 Market Estimates & Forecast, By Region, 2021 - 2034 ($Bn)
- 10.1 Key trends
- 10.2 North America
- 10.2.1 U.S.
- 10.2.2 Canada
- 10.3 Europe
- 10.3.1 UK
- 10.3.2 Germany
- 10.3.3 France
- 10.3.4 Spain
- 10.3.5 Italy
- 10.3.6 Russia
- 10.3.7 Nordics
- 10.4 Asia Pacific
- 10.4.1 China
- 10.4.2 India
- 10.4.3 Japan
- 10.4.4 South Korea
- 10.4.5 ANZ
- 10.4.6 Southeast Asia
- 10.5 Latin America
- 10.5.1 Brazil
- 10.5.2 Mexico
- 10.5.3 Argentina
- 10.6 MEA
- 10.6.1 UAE
- 10.6.2 South Africa
- 10.6.3 Saudi Arabia
Chapter 11 Company Profiles
- 11.1 Aurora
- 11.2 Baidu Apollo
- 11.3 EasyMile
- 11.4 Imagry
- 11.5 ioki
- 11.6 Karsan
- 11.7 LILEE Systems
- 11.8 May Mobility
- 11.9 Mobileye
- 11.10 Navya
- 11.11 NVIDIA
- 11.12 Oxa
- 11.13 T-Hive
- 11.14 Via Transportation
- 11.15 Volvo Bus
 采矿业自主技术:全球市场份额和排名、总收入和需求预测(2025-2031年)
 中国自动驾驶数据闭环(2025)
 低速自动驾驶市场按类别、组件、最终用户细分市场和用例划分 - 全球预测 2025-2032 年
 全球汽车价值链0.5级供应商(2024-2030)
 2032 年电动车自动清洁市场预测:按清洁类型、自动化程度、服务模式、技术、最终用户和地区进行的全球分析2024-2030年中国自动驾驶乘用车市场
 自动驾驶与ITS趋势:全球考察(2025年)
 全球自动驾驶软体市场ADAS和自动驾驶的Tier 1供应商(2025年)- 中国企业国外Tire 1 ADAS供应商(2025年)