


 |
市场调查报告书
商品编码
1716534
塑胶废弃物热解油市场机会、成长动力、产业趋势分析及2025-2034年预测Plastic Waste Pyrolysis Oil Market Opportunity, Growth Drivers, Industry Trend Analysis, and Forecast 2025 - 2034 |
||||||
2024 年全球塑胶废弃物热解油市场规模达 6.735 亿美元,预计 2025 年至 2034 年期间的复合年增长率为 5.5%。随着世界各地的产业和政府越来越重视永续废弃物管理解决方案并寻求替代燃料来源以减少对化石燃料的依赖,该市场正在稳步增长。塑胶废物热解油是在无氧环境下对塑胶废物进行热分解而产生的,它正在成为将不可回收塑胶转化为有价值的燃料和原料的可行解决方案。旨在减少浪费和提高资源效率的循环经济实践日益盛行,正在推动市场扩张。热解油因其能够减少温室气体排放、提高能源效率以及满足对运输燃料、工业取暖油和石化原料日益增长的需求而越来越受到关注。随着热解技术的进步提高了製程效率并降低了营运成本,塑胶废物热解油市场将迎来大幅成长。
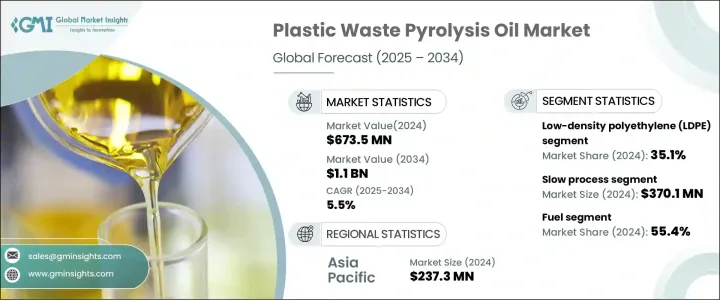
市场根据原料进行细分,其中低密度聚乙烯 (LDPE) 占最大份额,到 2024 年将达到 35.1%。 LDPE 广泛用于塑胶袋和薄膜等包装材料,由于其熔点较低、生产效率高,仍是热解的主要候选材料。由于 LDPE 废料难以透过机械过程回收,因此对热解等化学回收方法的需求正在增加。低密度聚乙烯 (LDPE) 衍生的热解油正在成为一种有吸引力的替代燃料来源,尤其是在政府对垃圾掩埋场实施严格的监管并推广废物转化为能源系统以减少环境影响的情况下。
| 市场范围 | |
|---|---|
| 起始年份 | 2024 |
| 预测年份 | 2025-2034 |
| 起始值 | 6.735亿美元 |
| 预测值 | 11亿美元 |
| 复合年增长率 | 5.5% |
塑胶废弃物热解油市场也按製程类型进行分类,其中慢速热解在 2024 年产生 3.701 亿美元的产值。慢速热解是生产热解油的首选方法,因为它具有更高的油产量和稳定性。此製程在 300-500°C 之间的较低温度下运行,并延长停留时间,可确保更高效的热分解,从而提高液体燃料的产量。它仍然是大规模商业应用最具成本效益的选择,使其成为旨在最大限度提高产量同时最大限度降低营运成本的行业的首选。
2024 年,亚太地区塑胶废弃物热解油产业产值达 2.373 亿美元,预计到 2034 年复合年增长率将达到 5.7%。该地区的主导地位得益于快速的工业化、城市化和广泛的塑胶使用。亚太地区的几个国家正在大力投资建造热解工厂,以解决日益严重的塑胶垃圾问题。该地区高度重视废弃物能源技术和永续实践,引领全球将塑胶废弃物转化为宝贵资源的转变。对环境永续性和废弃物管理创新的日益重视,继续推动亚太地区及其他地区对塑胶废弃物热解油的需求。
目录
第一章:方法论与范围
第二章:执行摘要
第三章:行业洞察
- 产业生态系统分析
- 影响价值链的因素
- 利润率分析
- 中断
- 未来展望
- 製造商
- 经销商
- 供应商格局
- 利润率分析
- 重要新闻和倡议
- 监管格局
- 衝击力
- 成长动力
- 政府的有利倡议
- 快速城镇化和工业化
- 都市固体废弃物(MSW)数量不断增加
- 产业陷阱与挑战
- 生产成本高
- 成长动力
- 成长潜力分析
- 波特的分析
- PESTEL分析
第四章:竞争格局
- 介绍
- 公司市占率分析
- 竞争定位矩阵
- 战略展望矩阵
第五章:市场规模及预测:依原料,2021 年至 2034 年
- 主要趋势
- 低密度聚乙烯(LDPE)
- 高密度聚乙烯(HDPE)
- 聚丙烯(PP)
- 其他的
第六章:市场规模及预测:依工艺,2021 年至 2034 年
- 主要趋势
- 快速地
- 闪光
- 慢的
第七章:市场规模及预测:依最终用途,2021 年至 2034 年
- 主要趋势
- 燃料
- 化学品
- 热能与电力
- 其他的
第八章:市场估计与预测:按地区,2021 年至 2034 年
- 主要趋势
- 北美洲
- 我们
- 加拿大
- 欧洲
- 德国
- 英国
- 法国
- 西班牙
- 义大利
- 荷兰
- 亚太地区
- 中国
- 印度
- 日本
- 澳洲
- 韩国
- 拉丁美洲
- 巴西
- 墨西哥
- 中东和非洲
- 沙乌地阿拉伯
- 南非
- 阿联酋
第九章:公司简介
- Nexus Circular
- OMV Aktiengesellschaft
- Niutech Environment Technology Corporation
- Klean Industries
- Fortum OyJ
- Enerkem
- Ensyn Corporation
- Twence BV
- Agilyx Corporation
- Green Fuel Nordic Corporation
- Vadxx Energy LLC
- Quantafuel AS
- RESYNERGI
- JBI Inc.
The Global Plastic Waste Pyrolysis Oil Market generated USD 673.5 million in 2024 and is projected to grow at a CAGR of 5.5% between 2025 and 2034. This market is experiencing steady growth as industries and governments worldwide increasingly emphasize sustainable waste management solutions and seek alternative fuel sources to reduce dependence on fossil fuels. Plastic waste pyrolysis oil, derived from the thermal decomposition of plastic waste in an oxygen-free environment, is emerging as a viable solution for converting non-recyclable plastics into valuable fuels and feedstock. The increasing shift toward circular economy practices, aimed at minimizing waste and promoting resource efficiency, is driving market expansion. Pyrolysis oil is gaining traction due to its ability to reduce greenhouse gas emissions, improve energy efficiency, and support the growing demand for transport fuels, industrial heating oils, and petrochemical feedstock. With advancements in pyrolysis technologies enhancing process efficiency and reducing operational costs, the market for plastic waste pyrolysis oil is poised for significant growth.
The market is segmented based on feedstock, with low-density polyethylene (LDPE) holding the largest share at 35.1% in 2024. LDPE, widely used in packaging materials such as plastic bags and films, remains a prime candidate for pyrolysis due to its lower melting point and high yield efficiency. As LDPE waste is difficult to recycle through mechanical processes, the demand for chemical recycling methods like pyrolysis is increasing. LDPE-derived pyrolysis oil is becoming an attractive alternative fuel source, especially as governments implement stringent regulations on landfills and promote waste-to-energy systems to reduce environmental impact.
| Market Scope | |
|---|---|
| Start Year | 2024 |
| Forecast Year | 2025-2034 |
| Start Value | $673.5 Million |
| Forecast Value | $1.1 Billion |
| CAGR | 5.5% |
The plastic waste pyrolysis oil market is also classified by process type, with slow pyrolysis generating USD 370.1 million in 2024. Slow pyrolysis is the preferred method for producing pyrolysis oil because of its higher oil yield and stability. Operating at lower temperatures between 300-500°C and extended residence times, this process ensures more efficient thermal decomposition, resulting in increased liquid fuel production. It remains the most cost-effective option for large-scale commercial applications, making it a preferred choice for industries aiming to maximize yield while minimizing operational costs.
The Asia Pacific Plastic Waste Pyrolysis Oil Industry generated USD 237.3 million in 2024 and is expected to grow at a CAGR of 5.7% by 2034. The region's dominance is fueled by rapid industrialization, urbanization, and widespread plastic usage. Several countries across Asia Pacific are investing heavily in developing pyrolysis plants to address the rising issue of plastic waste. With a strong focus on waste-to-energy technologies and sustainable practices, the region is leading the global shift toward converting plastic waste into valuable resources. This increasing commitment to environmental sustainability and innovation in waste management continues to drive demand for plastic waste pyrolysis oil in Asia Pacific and beyond.
Table of Contents
Chapter 1 Methodology & Scope
- 1.1 Market scope & definition
- 1.2 Base estimates & calculations
- 1.3 Forecast calculation
- 1.4 Data sources
- 1.4.1 Primary
- 1.4.2 Secondary
- 1.4.2.1 Paid sources
- 1.4.2.2 Public sources
- 1.5 Primary research and validation
- 1.5.1 Primary sources
- 1.5.2 Data mining sources
Chapter 2 Executive Summary
- 2.1 Industry synopsis, 2021-2034
Chapter 3 Industry Insights
- 3.1 Industry ecosystem analysis
- 3.1.1 Factor affecting the value chain
- 3.1.2 Profit margin analysis
- 3.1.3 Disruptions
- 3.1.4 Future outlook
- 3.1.5 Manufacturers
- 3.1.6 Distributors
- 3.2 Supplier landscape
- 3.3 Profit margin analysis
- 3.4 Key news & initiatives
- 3.5 Regulatory landscape
- 3.6 Impact forces
- 3.6.1 Growth drivers
- 3.6.1.1 Favourable government initiatives
- 3.6.1.2 Rapid urbanization and industrialization
- 3.6.1.3 Increasing amount municipal solid waste (MSW)
- 3.6.2 Industry pitfalls & challenges
- 3.6.2.1 High production costs
- 3.6.1 Growth drivers
- 3.7 Growth potential analysis
- 3.8 Porter's analysis
- 3.9 PESTEL analysis
Chapter 4 Competitive Landscape, 2024
- 4.1 Introduction
- 4.2 Company market share analysis
- 4.3 Competitive positioning matrix
- 4.4 Strategic outlook matrix
Chapter 5 Market Size and Forecast, By Feedstock, 2021 – 2034 (USD Million, Tons)
- 5.1 Key trends
- 5.2 Low density polyethylene (LDPE)
- 5.3 High density polyethylene (HDPE)
- 5.4 Polypropylene (PP)
- 5.5 Others
Chapter 6 Market Size and Forecast, By Process, 2021 – 2034 (USD Million, Tons)
- 6.1 Key trends
- 6.2 Fast
- 6.3 Flash
- 6.4 Slow
Chapter 7 Market Size and Forecast, By End Use, 2021 – 2034 (USD Million, Tons)
- 7.1 Key trends
- 7.2 Fuel
- 7.3 Chemicals
- 7.4 Heat & power
- 7.5 Others
Chapter 8 Market Estimates and Forecast, By Region, 2021 – 2034 (USD Million) (Tons)
- 8.1 Key trends
- 8.2 North America
- 8.2.1 U.S.
- 8.2.2 Canada
- 8.3 Europe
- 8.3.1 Germany
- 8.3.2 UK
- 8.3.3 France
- 8.3.4 Spain
- 8.3.5 Italy
- 8.3.6 Netherlands
- 8.4 Asia Pacific
- 8.4.1 China
- 8.4.2 India
- 8.4.3 Japan
- 8.4.4 Australia
- 8.4.5 South Korea
- 8.5 Latin America
- 8.5.1 Brazil
- 8.5.2 Mexico
- 8.6 Middle East and Africa
- 8.6.1 Saudi Arabia
- 8.6.2 South Africa
- 8.6.3 UAE
Chapter 9 Company Profiles
- 9.1 Nexus Circular
- 9.2 OMV Aktiengesellschaft
- 9.3 Niutech Environment Technology Corporation
- 9.4 Klean Industries
- 9.5 Fortum OyJ
- 9.6 Enerkem
- 9.7 Ensyn Corporation
- 9.8 Twence B.V.
- 9.9 Agilyx Corporation
- 9.10 Green Fuel Nordic Corporation
- 9.11 Vadxx Energy LLC
- 9.12 Quantafuel AS
- 9.13 RESYNERGI
- 9.14 JBI Inc.
 废弃物衍生热解油市场分析及预测(至2035年):类型、产品类型、技术、应用、最终用户、製程、安装类型、设备、解决方案与阶段
 热解油:市场占有率分析、产业趋势与统计、成长预测(2026-2031)
 热解油市场规模、份额和成长分析(按类型、原料、原料、改质方法、製程技术、应用和地区划分)—产业预测(2026-2033 年)
 全球轮胎热解产品市场:市场规模、份额、趋势分析(按产品、最终用途和地区划分)、细分市场预测(2025-2033 年)
 轮胎热解产品市场:依产品类型、製程技术、营运规模、应用、最终用户、国家及地区划分-全球产业分析、市场规模、市场占有率及2025-2032年预测
 全球热解油市场全球轮胎热解产品市场
 全球废弃塑胶热解油市场预测(至2032年):按塑胶类型、热解方法、反应器配置、营运规模、分销管道、最终用户和地区划分
 生物质热解油市场-全球产业规模、份额、趋势、机会和预测,按类型、应用、地区和竞争细分,2020-2030 年
 废弃物衍生热解油市场:产业分析、规模、占有率、成长、趋势和预测,2025-2032 年