


 |
市场调查报告书
商品编码
1721416
再生 PET 瓶市场机会、成长动力、产业趋势分析及 2025 - 2034 年预测Recycled PET Bottles Market Opportunity, Growth Drivers, Industry Trend Analysis, and Forecast 2025 - 2034 |
||||||
2024 年全球再生 PET 瓶市场价值为 24 亿美元,预计到 2034 年将以 9.7% 的复合年增长率增长至 59 亿美元。随着永续性成为各行各业的核心关注点,对环保和可回收包装材料的需求正在加速成长。再生 PET (rPET) 瓶的势头强劲,尤其是当企业转向闭环系统以减少对原生塑胶的依赖时。人们对环境问题的认识不断提高、对塑胶废物的担忧日益加剧以及全球法规的严格,正在促使製造商采用更环保的包装替代品。消费者也积极寻找采用永续包装的产品,这使得品牌在致力于回收时具有竞争优势。食品饮料、个人护理和家居用品等行业正在成为这一转变的主要贡献者,因为它们响应不断变化的市场动态和环保意识的消费者行为。回收製程技术的进步进一步提高了 rPET 材料的品质和安全性,为包装领域的应用和可扩展性开闢了新的途径。
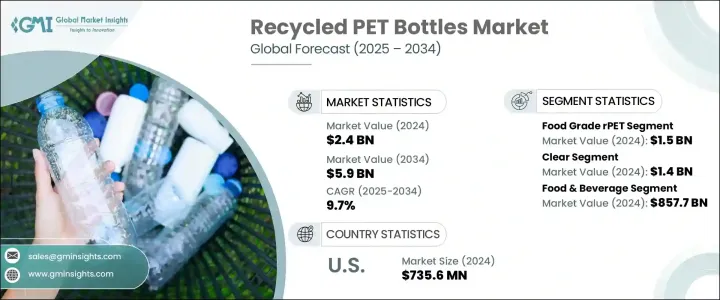
回收的PET瓶分为食品级和非食品级两类。食品级细分市场在 2024 年以 15 亿美元的价值引领市场。随着食品和饮料公司致力于减少碳足迹,这个细分市场将继续成长。符合安全标准的高品质食品级 rPET 的出现使得主要参与者更容易将永续包装纳入其产品线。另一方面,非食品级 rPET 也在扩大其应用范围,尤其是在个人护理行业,品牌正在转向可回收包装,同时又不影响视觉吸引力或功能性。
| 市场范围 | |
|---|---|
| 起始年份 | 2024 |
| 预测年份 | 2025-2034 |
| 起始值 | 24亿美元 |
| 预测值 | 59亿美元 |
| 复合年增长率 | 9.7% |
以瓶子类型划分,透明再生 PET 瓶占据最大的市场份额,到 2024 年将达到 14 亿美元。这些瓶子与原生 PET 非常相似,由于其透明度高且易于回收,非常适合用于水、碳酸饮料和果汁的包装。製造商更喜欢透明 rPET,因为它适合闭环回收系统并且具有消费者友好的美感。乳製品、洗髮精和即食食品消费量的不断增长也促进了对透明 rPET 瓶的需求不断增长,透明 rPET 瓶既提高了产品可见性,又具有环境价值。
2024 年,美国再生 PET 瓶市场规模达 7.356 亿美元。这一区域成长得益于旨在最大限度减少塑胶垃圾的强有力监管措施,以及领先公司日益转向循环包装策略。
Alpek SAB de CV、Amcor 和 Resilux NV 等行业领导者正在扩大生产能力、增强回收技术并与环保机构合作以实现永续发展目标,同时加强其全球市场影响力。
目录
第一章:方法论与范围
第二章:执行摘要
第三章:行业洞察
- 产业生态系统分析
- 产业衝击力
- 成长动力
- 监理要求和永续发展目标
- 消费者对环保包装的偏好日益增长
- 个人护理和化妆品行业的扩张
- 不断增长的饮料和食品包装行业
- 回收技术的进步
- 产业陷阱与挑战
- 回收基础建设效率低下
- rPET 供应有限且成本高昂
- 成长动力
- 成长潜力分析
- 监管格局
- 技术格局
- 未来市场趋势
- 差距分析
- 波特的分析
- PESTEL分析
第四章:竞争格局
- 介绍
- 公司市占率分析
- 主要市场参与者的竞争分析
- 竞争定位矩阵
- 策略仪表板
第五章:市场估计与预测:依等级,2021 - 2034 年
- 主要趋势
- 食品级 rPET
- 非食品级 rPET
第六章:市场估计与预测:按类型,2021 - 2034 年
- 主要趋势
- 清除
- 有色
第七章:市场估计与预测:按最终用途产业,2021 - 2034 年
- 主要趋势
- 食品和饮料
- 製药
- 个人护理和化妆品
- 其他的
第八章:市场估计与预测:按地区,2021 - 2034 年
- 主要趋势
- 北美洲
- 我们
- 加拿大
- 欧洲
- 德国
- 英国
- 法国
- 西班牙
- 义大利
- 荷兰
- 亚太地区
- 中国
- 印度
- 日本
- 澳洲
- 韩国
- 拉丁美洲
- 巴西
- 墨西哥
- 阿根廷
- 中东和非洲
- 沙乌地阿拉伯
- 南非
- 阿联酋
第九章:公司简介
- Alpek SAB de CV
- ALPLA Werke Alwin Lehner GmbH & Co KG
- Verdeco Recycling, Inc.
- Amcor
- Berry Global Group, Inc
- Sidel Group
- Resilux NV
- Graham Packaging
- Taiwan Hon Chuan
- Phoenix Technologies
The Global Recycled PET Bottles Market was valued at USD 2.4 billion in 2024 and is estimated to grow at a CAGR of 9.7% to reach USD 5.9 billion by 2034. As sustainability becomes a core focus across industries, the demand for eco-friendly and recyclable packaging materials is accelerating. Recycled PET (rPET) bottles are gaining significant momentum, especially as companies shift toward closed-loop systems to reduce dependency on virgin plastic. The increased awareness around environmental issues, rising plastic waste concerns, and stringent global regulations are pushing manufacturers to adopt greener packaging alternatives. Consumers, too, are actively seeking out products housed in sustainable packaging, giving brands a competitive edge when they commit to recycling practices. Industries such as food and beverage, personal care, and household products are emerging as major contributors to this transition as they respond to evolving market dynamics and eco-conscious consumer behavior. Technological advancements in recycling processes have further boosted the quality and safety of rPET materials, opening up new avenues for application and scalability in the packaging sector.
Recycled PET bottles are classified into food-grade and non-food-grade categories. The food-grade segment led the market with a value of USD 1.5 billion in 2024. This segment continues to gain ground as food and beverage companies commit to cutting their carbon footprints. The availability of high-quality food-grade rPET that complies with safety standards has made it easier for major players to incorporate sustainable packaging into their product lines. On the other hand, non-food-grade rPET is also expanding its footprint, particularly in the personal care industry, where brands are shifting to recyclable packaging without compromising visual appeal or functionality.
| Market Scope | |
|---|---|
| Start Year | 2024 |
| Forecast Year | 2025-2034 |
| Start Value | $2.4 Billion |
| Forecast Value | $5.9 Billion |
| CAGR | 9.7% |
By bottle type, clear recycled PET bottles commanded the largest market share, reaching USD 1.4 billion in 2024. These bottles closely resemble virgin PET and are highly favored for water, carbonated beverages, and juice packaging due to their clarity and ease of recycling. Manufacturers prefer clear rPET for its adaptability to closed-loop recycling systems and its consumer-friendly aesthetic. The rising consumption of dairy products, shampoos, and ready-to-eat meals has also contributed to the growing demand for clear rPET bottles, offering both product visibility and environmental value.
The United States Recycled PET Bottles Market accounted for USD 735.6 million in 2024. This regional growth is fueled by strong regulatory measures aimed at minimizing plastic waste and an increasing shift among leading companies toward circular packaging strategies.
Industry leaders like Alpek S.A.B. de C.V., Amcor, and Resilux NV are scaling production capabilities, enhancing recycling technologies, and partnering with environmental bodies to meet sustainability goals while strengthening their global market presence.
Table of Contents
Chapter 1 Methodology and Scope
- 1.1 Market scope and definitions
- 1.2 Research design
- 1.2.1 Research approach
- 1.2.2 Data collection methods
- 1.3 Base estimates and calculations
- 1.3.1 Base year calculation
- 1.3.2 Key trends for market estimation
- 1.4 Forecast model
- 1.5 Primary research and validation
- 1.5.1 Primary sources
- 1.5.2 Data mining sources
Chapter 2 Executive Summary
- 2.1 Industry 3600 synopsis
Chapter 3 Industry Insights
- 3.1 Industry ecosystem analysis
- 3.2 Industry impact forces
- 3.2.1 Growth drivers
- 3.2.1.1 Regulatory mandates and sustainability goals
- 3.2.1.2 Growing consumer preference for eco-friendly packaging
- 3.2.1.3 Expansion of the personal care & cosmetics sector
- 3.2.1.4 Growing beverage & food packaging industry
- 3.2.1.5 Advancements in recycling technologies
- 3.2.2 Industry pitfalls and challenges
- 3.2.2.1 Inefficient recycling infrastructure
- 3.2.2.2 Limited availability & high cost of rPET
- 3.2.1 Growth drivers
- 3.3 Growth potential analysis
- 3.4 Regulatory landscape
- 3.5 Technology landscape
- 3.6 Future market trends
- 3.7 Gap analysis
- 3.8 Porter’s analysis
- 3.9 PESTEL analysis
Chapter 4 Competitive Landscape, 2024
- 4.1 Introduction
- 4.2 Company market share analysis
- 4.3 Competitive analysis of major market players
- 4.4 Competitive positioning matrix
- 4.5 Strategy dashboard
Chapter 5 Market Estimates and Forecast, By Grade, 2021 - 2034 (USD Million & Million Units)
- 5.1 Key trends
- 5.2 Food-Grade rPET
- 5.3 Non-Food-Grade rPET
Chapter 6 Market Estimates and Forecast, By Type, 2021 - 2034 (USD Million & Million Units)
- 6.1 Key trends
- 6.2 Clear
- 6.3 Colored
Chapter 7 Market Estimates and Forecast, By End Use Industry, 2021 - 2034 (USD Million & Million Units)
- 7.1 Key trends
- 7.2 Food & beverage
- 7.3 Pharmaceuticals
- 7.4 Personal care & cosmetics
- 7.5 Others
Chapter 8 Market Estimates and Forecast, By Region, 2021 - 2034 (USD Million & Million Units)
- 8.1 Key trends
- 8.2 North America
- 8.2.1 U.S.
- 8.2.2 Canada
- 8.3 Europe
- 8.3.1 Germany
- 8.3.2 UK
- 8.3.3 France
- 8.3.4 Spain
- 8.3.5 Italy
- 8.3.6 Netherlands
- 8.4 Asia Pacific
- 8.4.1 China
- 8.4.2 India
- 8.4.3 Japan
- 8.4.4 Australia
- 8.4.5 South Korea
- 8.5 Latin America
- 8.5.1 Brazil
- 8.5.2 Mexico
- 8.5.3 Argentina
- 8.6 Middle East and Africa
- 8.6.1 Saudi Arabia
- 8.6.2 South Africa
- 8.6.3 UAE
Chapter 9 Company Profiles
- 9.1 Alpek S.A.B. de C.V.
- 9.2 ALPLA Werke Alwin Lehner GmbH & Co KG
- 9.3 Verdeco Recycling, Inc.
- 9.4 Amcor
- 9.5 Berry Global Group, Inc
- 9.6 Sidel Group
- 9.7 Resilux NV
- 9.8 Graham Packaging
- 9.9 Taiwan Hon Chuan
- 9.10 Phoenix Technologies
 生物降解感测器市场分析及预测(至2035年):按类型、产品类型、技术、组件、应用、材料类型、最终用户、功能和安装类型划分零废弃生物发酵市场分析及预测(至2035年):依类型、产品、服务、技术、应用、製程、最终用户、材料类型、设备及解决方案划分
 全球可生物降解纸和塑胶包装市场规模、份额、趋势和成长分析报告(2026-2034年)
 2026年全球可生物分解纸和塑胶包装市场报告淀粉基包装市场-2026-2031年预测竹製包装市场-2026-2031年预测
 生质塑胶包装袋市场规模、份额和成长分析(按产品类型、应用、材料、最终用途产业、分销通路和地区划分)-2026-2033年产业预测
 黄麻包装市场规模、份额及成长分析(按类型、销售、应用及地区划分)-2026-2033年产业预测
 生质塑胶包装市场规模、份额和成长分析(按产品类型、应用、萃取技术、最终用户和地区划分)-2026-2033年产业预测
 医疗设备生质塑胶市场规模、份额和趋势分析报告:按材料、应用、地区和细分市场预测(2025-2033 年)