


 |
市场调查报告书
商品编码
1740846
永续製造设备市场机会、成长动力、产业趋势分析及 2025 - 2034 年预测Sustainable Manufacturing Equipment Market Opportunity, Growth Drivers, Industry Trend Analysis, and Forecast 2025 - 2034 |
||||||
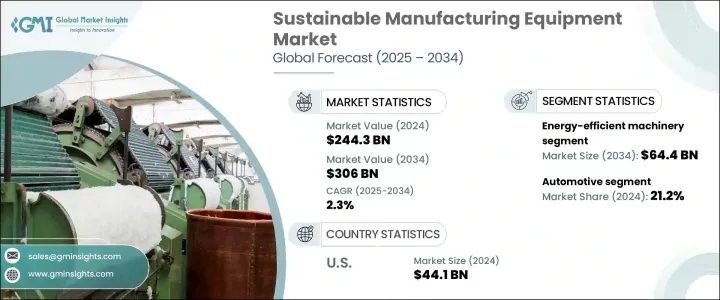
2024 年全球永续製造设备市场规模达 2,443 亿美元,预计到 2034 年将以 2.3% 的复合年增长率成长至 3,060 亿美元。日益增长的环境问题和企业减少碳排放的承诺不断增加,促使製造商采用环保生产技术。企业正在积极转向永续设备,以符合气候目标并提高长期获利能力。这一趋势背后的主要驱动力是向循环生产系统的过渡,该系统强调有效利用资源和减少废物产生。为了实现这一目标,製造商正在彻底改革产品设计策略,优先考虑耐用性、易拆卸性和可回收性——这需要专门的设备来支援这些转变。这种转变不仅是为了减少对环境的影响;它还透过重复使用和回收材料创造了新的收入来源,同时降低了原材料成本。因此,整合永续製造实践已成为一项策略性倡议,而非一项监管义务。
世界各国政府正透过优惠立法、税收抵免和资助计画支持这项转变。这些倡议旨在透过降低采用新技术的财务障碍来加速向清洁製造的转型。在这种不断变化的情况下,投资永续设备的公司更有能力遵守新兴法规并抓住新的市场机会。随着企业寻求既能满足效率标准又能提升营运绩效的技术,设备製造商的需求也不断成长。人们对环保解决方案日益增长的兴趣正在培育一种竞争激烈、创新驱动的市场氛围。
| 市场范围 | |
|---|---|
| 起始年份 | 2024 |
| 预测年份 | 2025-2034 |
| 起始值 | 2443亿美元 |
| 预测值 | 3060亿美元 |
| 复合年增长率 | 2.3% |
在各类设备中,节能机械以2024年572亿美元的营收领跑市场,预计2034年将成长至644亿美元。节能係统在各行各业的广泛应用,加上其降低营运成本的能力,使其成为整个市场中最突出的类别。希望降低能耗和营运效率的企业正在投资升级设备,以大幅节省水电费。由于这些投资对能源费用和生产力有直接影响,通常被视为低风险、高回报的决策。此外,许多此类系统符合财务支援条件,这使得初始采用成本更易于管理,并吸引更广泛的企业。
永续製造设备市场按终端用户产业细分,2024年,汽车产业成为最大贡献者,收入达519亿美元,约占总市场份额的21.2%。汽车产业注重清洁生产流程和节能减排,使其成为采用永续设备的领导者。该行业面临着减少排放和精简供应链的巨大压力,这促使其大力投资于支持更负责任製造实践的技术。透过实施节能係统和减排工具,汽车製造商正在努力实现永续发展目标,并在不断变化的市场中保持竞争力。
在区域分析中,美国在2024年占据了永续製造设备市场的441亿美元,预计2025年至2034年的复合年增长率将达到1.6%。美国强大的工业生态系统及其对绿色技术创新的投入,使其成为该领域的关键参与者。在监管压力和企业责任框架的推动下,美国製造商在采用永续生产工具方面处于领先地位。政府主导的措施和激励计划进一步鼓励企业向更清洁的技术转型。这些努力得到了美国境内密集的设备供应商和技术公司网路的支持,从而能够更快地整合尖端解决方案。
永续製造设备领域的主要公司包括ABB有限公司、3D系统公司、阿特拉斯·科普柯公司、艾默生电气公司、博世力士乐公司、发那科公司、霍尼韦尔国际公司、通用电气公司、三菱电机公司、施耐德电气公司、罗克韦尔自动化公司、西门子股份公司、威立雅环境公司、利乐国际公司和安川电机公司、利乐国际公司和安川电机公司。这些公司正在积极投资研发并扩展其产品线,以满足对可持续高效製造解决方案日益增长的需求。
目录
第一章:方法论与范围
第二章:执行摘要
第三章:行业洞察
- 产业生态系统分析
- 影响价值链的因素
- 利润率分析
- 中断
- 未来展望
- 製造商
- 经销商
- 川普政府关税分析
- 对贸易的影响
- 贸易量中断
- 报復措施
- 对产业的影响
- 供给侧影响(原料)
- 主要材料价格波动
- 供应链重组
- 生产成本影响
- 需求面影响(售价)
- 价格传导至终端市场
- 市占率动态
- 消费者反应模式
- 供给侧影响(原料)
- 受影响的主要公司
- 策略产业回应
- 供应链重构
- 定价和产品策略
- 政策参与
- 展望与未来考虑
- 对贸易的影响
- 供应商格局
- 技术概述
- 重要新闻和倡议
- 监管格局
- 衝击力
- 成长动力
- 企业对净零排放的承诺
- 采用循环经济原则
- 政府法规和激励措施
- 产业陷阱与挑战
- 初始投资成本高
- 监理合规的复杂性
- 成长动力
- 成长潜力分析
- 波特的分析
- PESTEL分析
第四章:竞争格局
- 介绍
- 公司市占率分析
- 竞争定位矩阵
- 战略展望矩阵
第五章:市场估计与预测:依设备类型,2021 - 2034 年
- 主要趋势
- 节能机械
- 废弃物管理设备
- 水和废水处理设备
- 碳排放控制系统
- 再生能源整合设备
- 智慧製造及监控设备
- 永续包装设备
- 积层製造设备
- 其他(材料回收系统等)
第六章:市场估计与预测:按最终用途产业,2021 - 2034 年
- 主要趋势
- 汽车
- 电子和半导体
- 食品和饮料
- 化学製造
- 製药
- 金属和采矿
- 消费品
- 其他(纺织製造等)
第七章:市场估计与预测:依最终用途,2021 - 2034 年
- 主要趋势
- 大型企业
- 中小企业(SMEs)
- 政府及研究机构
- 永续製造新创企业
第八章:市场估计与预测:按配销通路,2021 - 2034 年
- 主要趋势
- 直接的
- 间接
第九章:市场估计与预测:按地区,2021 - 2034 年
- 主要趋势
- 北美洲
- 我们
- 加拿大
- 欧洲
- 德国
- 英国
- 法国
- 义大利
- 西班牙
- 亚太地区
- 中国
- 印度
- 日本
- 韩国
- 澳洲
- 拉丁美洲
- 巴西
- 墨西哥
- 阿根廷
- MEA
- 阿联酋
- 沙乌地阿拉伯
- 南非
第十章:公司简介
- 3D Systems Corporation
- ABB Ltd.
- Atlas Copco AB
- Bosch Rexroth AG
- Emerson Electric Co.
- FANUC Corporation
- General Electric (GE) Company
- Honeywell International Inc.
- Mitsubishi Electric Corporation
- Rockwell Automation, Inc.
- Schneider Electric SE
- Siemens AG
- Tetra Pak International SA
- Veolia Environment SA
- Yaskawa Electric Corporation
The Global Sustainable Manufacturing Equipment Market was valued at USD 244.3 billion in 2024 and is estimated to grow at a CAGR of 2.3% to reach USD 306 billion by 2034. Growing environmental concerns and increasing corporate commitments to reduce carbon emissions are pushing manufacturers to adopt eco-friendly production technologies. Companies are actively shifting toward sustainable equipment to align with climate targets and improve long-term profitability. A major driver behind this trend is the transition to circular production systems, which emphasize efficient resource use and reduced waste generation. To achieve this, manufacturers are overhauling product design strategies to prioritize longevity, ease of disassembly, and recyclability-requiring specialized equipment to support such changes. This transformation is not just about reducing environmental impact; it also creates new avenues for revenue through reuse and recycled materials while cutting down on raw material expenses. As a result, integrating sustainable manufacturing practices has become a strategic move rather than a regulatory obligation.
Governments around the world are supporting this shift through favorable legislation, tax credits, and funding programs. These initiatives are designed to accelerate the transition to cleaner manufacturing by reducing the financial barriers to adopting new technologies. In this evolving landscape, companies that invest in sustainable equipment are better positioned to stay compliant with emerging regulations and tap into new market opportunities. Equipment manufacturers are also experiencing heightened demand, as businesses seek technologies that can meet efficiency standards while driving operational performance. This growing interest in environmentally sound solutions is fostering a competitive and innovation-driven market atmosphere.
| Market Scope | |
|---|---|
| Start Year | 2024 |
| Forecast Year | 2025-2034 |
| Start Value | $244.3 Billion |
| Forecast Value | $306 Billion |
| CAGR | 2.3% |
Among various equipment types, energy-efficient machinery led the market with a revenue of USD 57.2 billion in 2024 and is anticipated to grow to USD 64.4 billion by 2034. The widespread use of energy-efficient systems across multiple industries, combined with their ability to lower operating costs, makes this category the most prominent in the overall market. Businesses looking to reduce power consumption and operational inefficiencies are investing in upgraded machines that deliver measurable savings on utilities. These investments are typically seen as low-risk, high-reward decisions due to their direct impact on energy bills and productivity. Moreover, many of these systems qualify for financial support, making the initial cost of adoption more manageable and attractive to a wider range of companies.
The sustainable manufacturing equipment market is segmented by end-user industry, and in 2024, the automotive sector emerged as the largest contributor with USD 51.9 billion in revenue, capturing approximately 21.2% of the total market share. The automotive industry's focus on clean production processes and energy conservation has made it a frontrunner in adopting sustainable equipment. The sector faces considerable pressure to reduce emissions and streamline its supply chains, prompting heavy investment in technologies that support more responsible manufacturing practices. By implementing energy-saving systems and emission-reduction tools, automakers are striving to meet sustainability goals and maintain competitiveness in an evolving marketplace.
In regional analysis, the United States accounted for USD 44.1 billion of the sustainable manufacturing equipment market in 2024 and is expected to register a CAGR of 1.6% from 2025 to 2034. The country's strong industrial ecosystem and commitment to innovation in green technology position it as a key player in this space. American manufacturers are leading the way in adopting sustainable production tools, driven by both regulatory pressure and corporate responsibility frameworks. The availability of government-led initiatives and incentive programs has further encouraged companies to transition toward cleaner technologies. These efforts are supported by a dense network of equipment providers and technology firms operating within the country, allowing faster integration of cutting-edge solutions.
Key companies in the sustainable manufacturing equipment space include ABB Ltd., 3D Systems Corporation, Atlas Copco AB, Emerson Electric Co., Bosch Rexroth AG, FANUC Corporation, Honeywell International Inc., General Electric (GE) Company, Mitsubishi Electric Corporation, Schneider Electric SE, Rockwell Automation, Inc., Siemens AG, Veolia Environment S.A., Tetra Pak International S.A., and Yaskawa Electric Corporation. These players are actively investing in R&D and expanding their offerings to meet the growing demand for sustainable and efficient manufacturing solutions.
Table of Contents
Chapter 1 Methodology & Scope
- 1.1 Market scope & definition
- 1.2 Base estimates & calculations
- 1.3 Forecast parameters
- 1.4 Data sources
- 1.4.1 Primary
- 1.4.2 Secondary
- 1.4.2.1 Paid sources
- 1.4.2.2 Public sources
Chapter 2 Executive Summary
- 2.1 Industry 3600 synopsis, 2021 - 2034
Chapter 3 Industry Insights
- 3.1 Industry ecosystem analysis
- 3.1.1 Factor affecting the value chain
- 3.1.2 Profit margin analysis
- 3.1.3 Disruptions
- 3.1.4 Future outlook
- 3.1.5 Manufacturers
- 3.1.6 Distributors
- 3.2 Trump Administration Tariffs Analysis
- 3.2.1 Impact on Trade
- 3.2.1.1 Trade Volume Disruptions
- 3.2.1.2 Retaliatory Measures
- 3.2.2 Impact on the Industry
- 3.2.2.1 Supply-Side Impact (Raw Materials)
- 3.2.2.1.1 Price Volatility in Key Materials
- 3.2.2.1.2 Supply Chain Restructuring
- 3.2.2.1.3 Production Cost Implications
- 3.2.2.2 Demand-Side Impact (Selling Price)
- 3.2.2.2.1 Price Transmission to End Markets
- 3.2.2.2.2 Market Share Dynamics
- 3.2.2.2.3 Consumer Response Patterns
- 3.2.2.1 Supply-Side Impact (Raw Materials)
- 3.2.3 Key Companies Impacted
- 3.2.4 Strategic Industry Responses
- 3.2.4.1 Supply Chain Reconfiguration
- 3.2.4.2 Pricing and Product Strategies
- 3.2.4.3 Policy Engagement
- 3.2.5 Outlook and Future Considerations
- 3.2.1 Impact on Trade
- 3.3 Supplier landscape
- 3.4 Technological overview
- 3.5 Key news & initiatives
- 3.6 Regulatory landscape
- 3.7 Impact forces
- 3.7.1 Growth drivers
- 3.7.1.1 Corporate Commitments to Net-Zero Emissions
- 3.7.1.2 Adoption of Circular Economy Principles
- 3.7.1.3 Government Regulations and Incentives
- 3.7.2 Industry pitfalls & challenges
- 3.7.2.1 High Initial Investment Costs
- 3.7.2.2 Complexity of Regulatory Compliance
- 3.7.1 Growth drivers
- 3.8 Growth potential analysis
- 3.9 Porter's analysis
- 3.10 PESTEL analysis
Chapter 4 Competitive Landscape, 2024
- 4.1 Introduction
- 4.2 Company market share analysis
- 4.3 Competitive positioning matrix
- 4.4 Strategic outlook matrix
Chapter 5 Market Estimates & Forecast, By Equipment Type, 2021 - 2034 (USD Billion) (Thousand Units)
- 5.1 Key Trends
- 5.2 Energy-efficient Machinery
- 5.3 Waste Management Equipment
- 5.4 Water & Wastewater Treatment Equipment
- 5.5 Carbon Emission Control Systems
- 5.6 Renewable Energy Integration Equipment
- 5.7 Smart Manufacturing & Monitoring Equipment
- 5.8 Sustainable Packaging Equipment
- 5.9 Additive Manufacturing Equipment
- 5.10 Others (Material Recovery Systems, etc.)
Chapter 6 Market Estimates & Forecast, By End Use Industry, 2021 - 2034 (USD Billion) (Thousand Units)
- 6.1 Key trends
- 6.2 Automotive
- 6.3 Electronics and Semiconductor
- 6.4 Food and Beverage
- 6.5 Chemical Manufacturing
- 6.6 Pharmaceuticals
- 6.7 Metals and Mining
- 6.8 Consumer Goods
- 6.9 Others (Textile Manufacturing, etc.)
Chapter 7 Market Estimates & Forecast, By End Use, 2021 - 2034, (USD Billion) (Thousand Units)
- 7.1 Key trends
- 7.2 Large Enterprises
- 7.3 Small & Medium Enterprises (SMEs)
- 7.4 Government & Research Institutes
- 7.5 Sustainable Manufacturing Startups
Chapter 8 Market Estimates & Forecast, By Distribution Channel, 2021 - 2034, (USD Billion) (Thousand Units)
- 8.1 Key trends
- 8.2 Direct
- 8.3 Indirect
Chapter 9 Market Estimates & Forecast, By Region, 2021 - 2034, (USD Billion) (Thousand Units)
- 9.1 Key trends
- 9.2 North America
- 9.2.1 U.S.
- 9.2.2 Canada
- 9.3 Europe
- 9.3.1 Germany
- 9.3.2 U.K.
- 9.3.3 France
- 9.3.4 Italy
- 9.3.5 Spain
- 9.4 Asia Pacific
- 9.4.1 China
- 9.4.2 India
- 9.4.3 Japan
- 9.4.4 South Korea
- 9.4.5 Australia
- 9.5 Latin America
- 9.5.1 Brazil
- 9.5.2 Mexico
- 9.5.3 Argentina
- 9.6 MEA
- 9.6.1 UAE
- 9.6.2 Saudi Arabia
- 9.6.3 South Africa
Chapter 10 Company Profiles (Business Overview, Financial Data, Product Landscape, Strategic Outlook, SWOT Analysis)
- 10.1 3D Systems Corporation
- 10.2 ABB Ltd.
- 10.3 Atlas Copco AB
- 10.4 Bosch Rexroth AG
- 10.5 Emerson Electric Co.
- 10.6 FANUC Corporation
- 10.7 General Electric (GE) Company
- 10.8 Honeywell International Inc.
- 10.9 Mitsubishi Electric Corporation
- 10.10 Rockwell Automation, Inc.
- 10.11 Schneider Electric SE
- 10.12 Siemens AG
- 10.13 Tetra Pak International S.A.
- 10.14 Veolia Environment S.A.
- 10.15 Yaskawa Electric Corporation
 永续製造市场分析及预测(至2034年):类型、产品、服务、技术、组件、应用、材料类型、流程、最终用户、解决方案
 永续製造市场:按材料、最终用途、製程、技术、设备类型、服务类型和应用划分-2025-2032年全球预测混凝土管材和砌块製造市场:依产品类型、应用、最终用户、製造流程和尺寸范围划分-2025年至2032年全球预测
 2025年永续製造全球市场报告
 工业与製造业调查:机器人技术(2024财年下半年/2025财年上半年)
 全球精密金属车床加工市场全球永续製造市场
 按行业、技术和地区分類的全球製造业市场
 金属精密车削产品製造:市场占有率分析、产业趋势与统计、成长预测(2025-2030 年)
 製造业研究回顾:2024 年